Stochastic Momentum Index and RSI Based Quant Trading Strategy
This strategy is mainly based on two indicators - Stochastic Momentum Index (SMI) and Relative Strength Index (RSI). It also incorporates color filter and candle body filter as auxiliary judgement conditions. Trading…
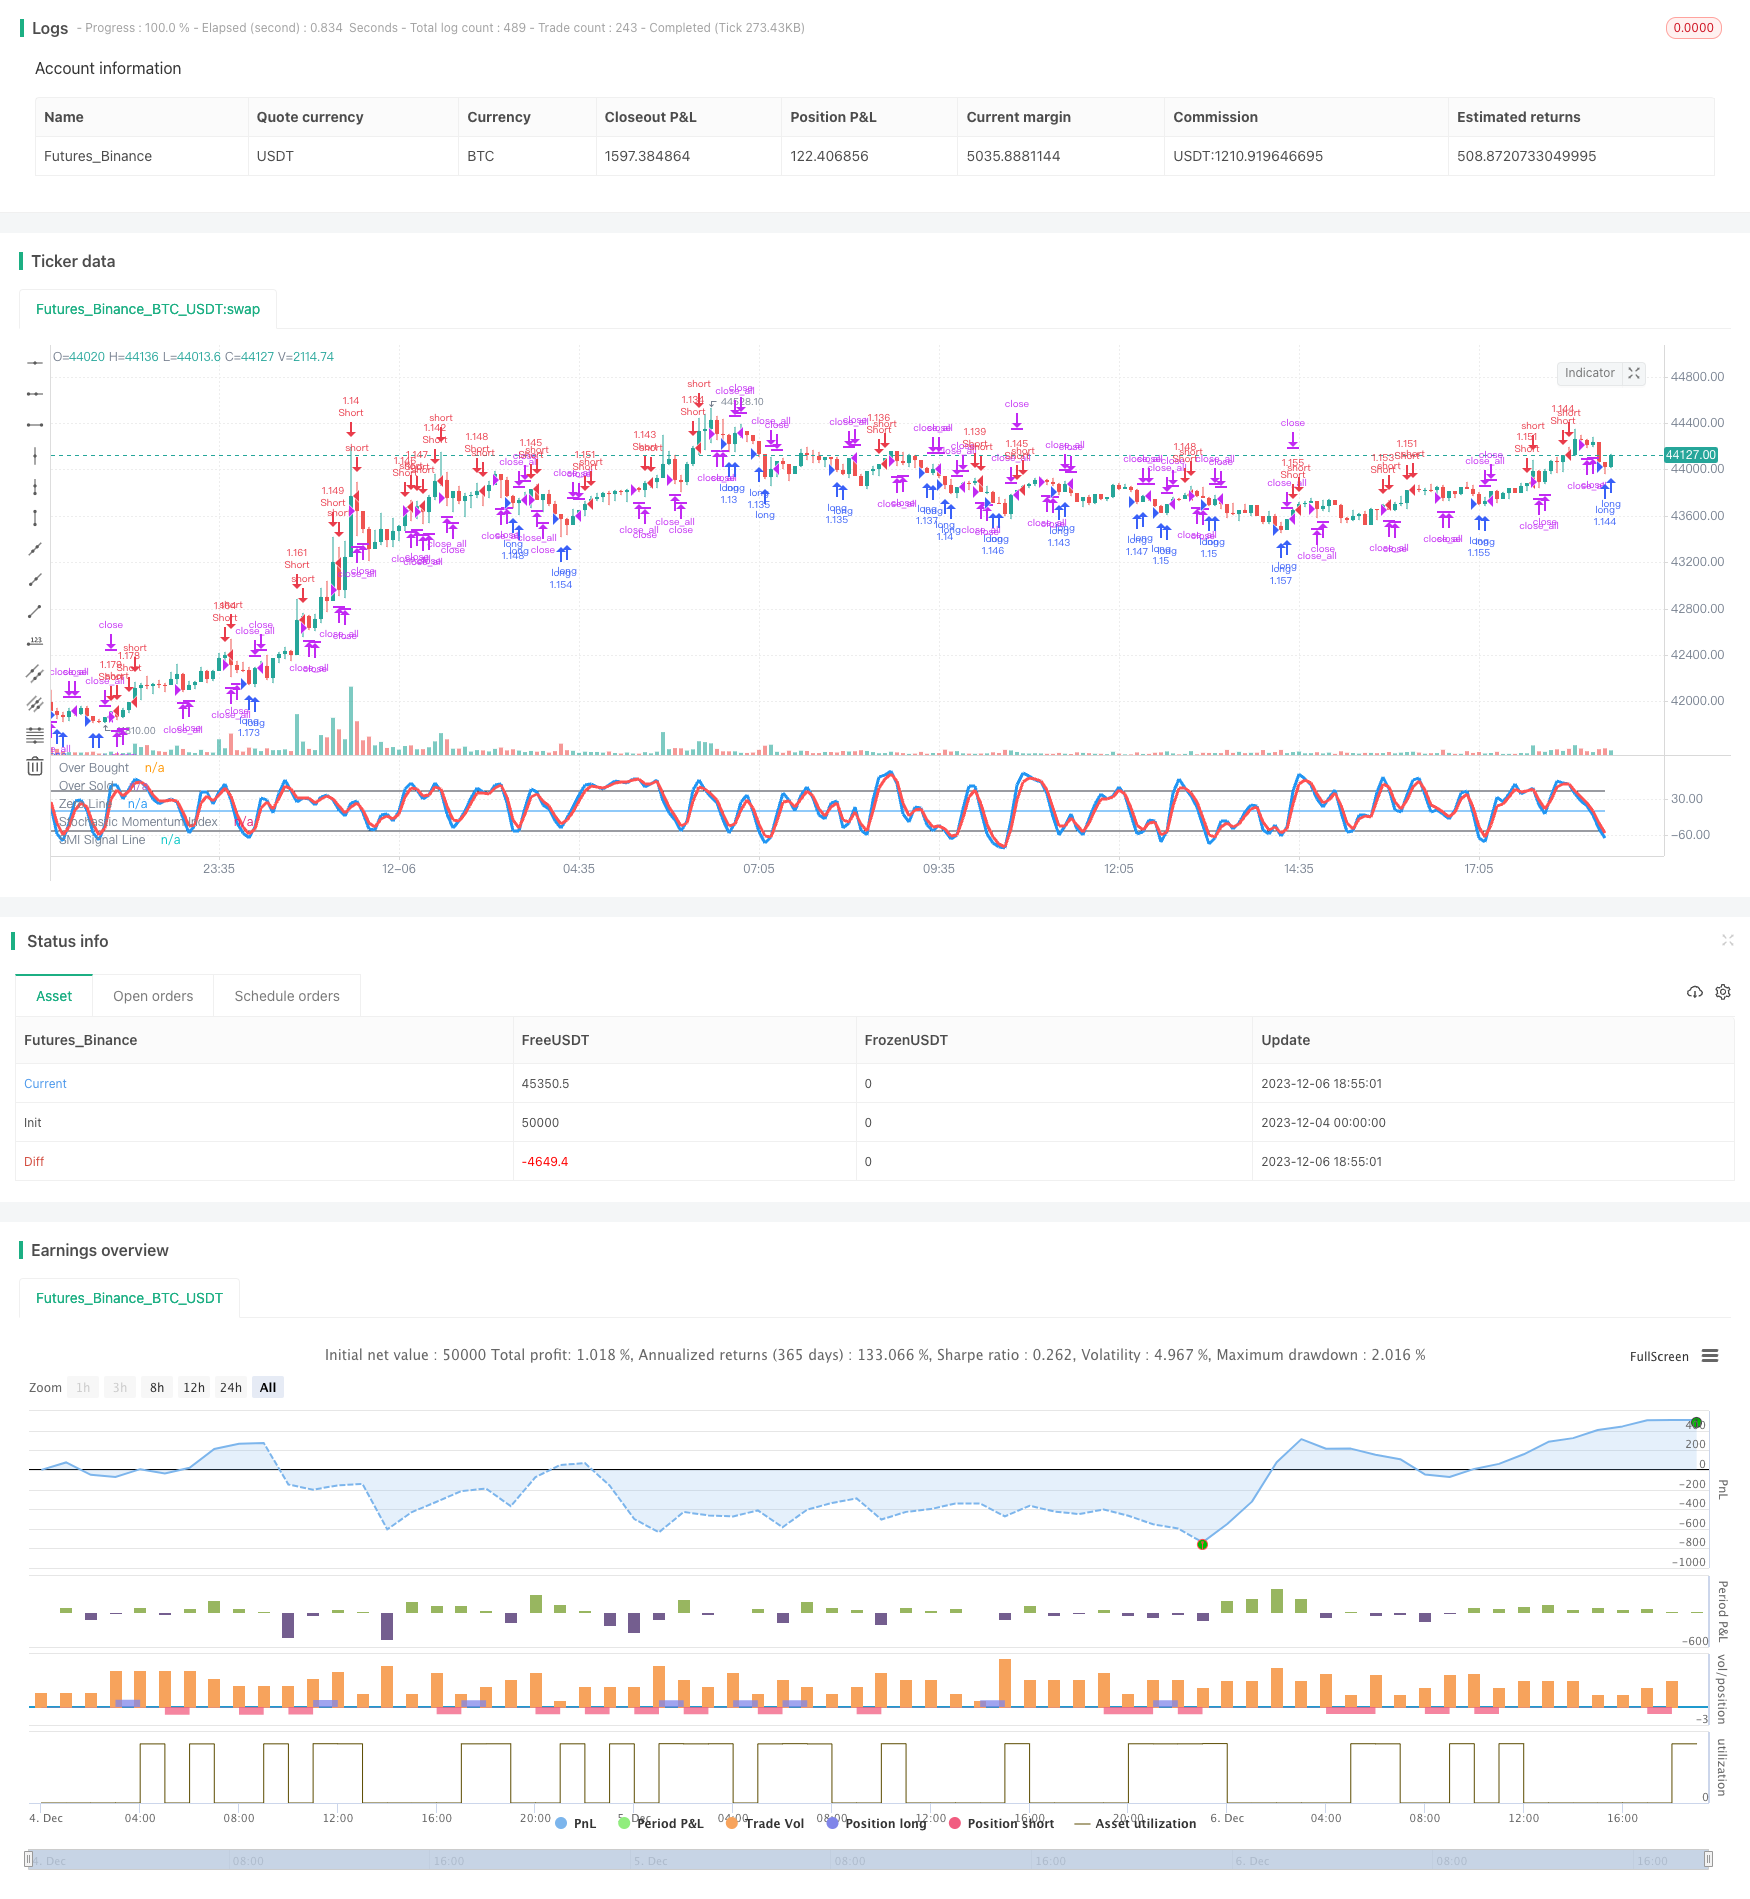
Overview
This strategy is mainly based on two indicators - Stochastic Momentum Index (SMI) and Relative Strength Index (RSI). It also incorporates color filter and candle body filter as auxiliary judgement conditions. Trading signals are generated based on the buy and sell signals from SMI and RSI, combined with filter conditions. This strategy can effectively discover short-term trading opportunities in the market.
Strategy Logic
This strategy relies on SMI and RSI indicators for judgement. SMI mainly judges whether a stock is overbought or oversold, while RSI determines the relative strength of a stock. When both indicators give buy signals at the same time, a buy action will be triggered. The specific logic is as follows:
- When SMI is oversold (below lower limit), it is considered as a buy signal
- When RSI is below threshold, it is considered as a buy signal
- When both SMI oversold and RSI below corresponding threshold occur, a buy signal is triggered
- Sell signal logic is similar
In addition, this strategy has a dual signals mode. This mode requires both SMI and RSI signals to trigger any trades. This can effectively reduce false signals.
Moreover, color filter and candle body filter are incorporated. These filters require relatively large candle body and last candle close higher than open. This can further avoid trading false breakouts.
Advantages
- Utilize SMI for overbought/oversold and RSI for relative strength, dual confirmation can reduce false signals
- Dual signal mode can greatly decrease ineffective trades
- Color and body filters can filter out false breakouts effectively
- Strategy logic is simple and clean
- Most parameters are customizable
Risks and Optimization
- SMI and RSI may produce more false signals when used alone, need careful examination
- In dual signal mode, good trading opportunities may be missed if parameters not set properly
- Can test strategy profitability under different periodic parameters to find optimum parameter combination
- Can evaluate threshold parameters through simulation or backtesting
- Can consider incorporating more filters to optimize the strategy
Summary
This strategy integrates the signals from both SMI and RSI indicators and generates trading orders through dual confirmation. Color filter and candle body filter are also implemented to filter out false breakouts. The strategy has simple and clean logic flow, and most parameters are customizable. Better return can be achieved by tuning the parameters accordingly.
Parameters
| Name | Default | What it controls |
|---|---|---|
| v_input_1 | true | Long |
| v_input_2 | true | Short |
| v_input_3 | false | Use Martingale |
| v_input_4 | 100 | Capital, % |
| v_input_5 | true | Use SMI Strategy |
| v_input_6 | true | Use RSI Strategy |
| v_input_7 | true | Use Color-Filter |
| v_input_8 | true | Use Body-Filter |
| v_input_9 | 2 | SMI Percent K Length |
| v_input_10 | 2 | SMI Percent D Length |
| v_input_11 | 50 | SMI Limit |
| v_input_12 | 2 | RSI Period |
| v_input_13 | 10 | RSI Limit |
| v_input_14 | false | SMI+RSI Mode |
| v_input_15 | false | Show background |
| v_input_16 | 2018 | From Year |
| v_input_17 | 2100 | To Year |
| v_input_18 | true | From Month |
| v_input_19 | 12 | To Month |
| v_input_20 | true | From day |
| v_input_21 | 31 | To day |
Source Pine Script
/*backtest
start: 2023-12-04 00:00:00
end: 2023-12-06 19:00:00
period: 5m
basePeriod: 1m
exchanges: [{"eid":"Futures_Binance","currency":"BTC_USDT"}]
*/

//Noro
//2018

//@version=2
strategy(title = "Noro's Stochastic Strategy v1.3", shorttitle = "Stochastic str 1.3", overlay = false, default_qty_type = strategy.percent_of_equity, default_qty_value = 100, pyramiding = 0)

//Settings
needlong = input(true, defval = true, title = "Long")
needshort = input(true, defval = true, title = "Short")
usemar = input(false, defval = false, title = "Use Martingale")
capital = input(100, defval = 100, minval = 1, maxval = 10000, title = "Capital, %")
usesmi = input(true, defval = true, title = "Use SMI Strategy")
usersi = input(true, defval = true, title = "Use RSI Strategy")
usecol = input(true, defval = true, title = "Use Color-Filter")
usebod = input(true, defval = true, title = "Use Body-Filter")
a = input(2, defval = 2, minval = 2, maxval = 50, title = "SMI Percent K Length")
b = input(2, defval = 2, minval = 2, maxval = 50, title = "SMI Percent D Length")
limitsmi = input(50, defval = 50, minval = 1, maxval = 100, title = "SMI Limit")
periodrsi = input(2, defval = 2, minval = 2, maxval = 50, title = "RSI Period")
limitrsi = input(10, defval = 10, minval = 1, maxval = 50, title = "RSI Limit")
double = input(false, defval = false, title = "SMI+RSI Mode")
showbg = input(false, defval = false, title = "Show background")
fromyear = input(2018, defval = 2018, minval = 1900, maxval = 2100, title = "From Year")
toyear = input(2100, defval = 2100, minval = 1900, maxval = 2100, title = "To Year")
frommonth = input(01, defval = 01, minval = 01, maxval = 12, title = "From Month")
tomonth = input(12, defval = 12, minval = 01, maxval = 12, title = "To Month")
fromday = input(01, defval = 01, minval = 01, maxval = 31, title = "From day")
today = input(31, defval = 31, minval = 01, maxval = 31, title = "To day")

//Fast RSI
fastup = rma(max(change(close), 0), periodrsi)
fastdown = rma(-min(change(close), 0), periodrsi)
fastrsi = fastdown == 0 ? 100 : fastup == 0 ? 0 : 100 - (100 / (1 + fastup / fastdown))

//Stochastic Momentum Index
ll = lowest (low, a)
hh = highest (high, a)
diff = hh - ll
rdiff = close - (hh+ll)/2
//avgrel = ema(ema(rdiff,b),b)
//avgdiff = ema(ema(diff,b),b)
avgrel = sma(sma(rdiff,b),b)
avgdiff = sma(sma(diff,b),b)
SMI = avgdiff != 0 ? (avgrel/(avgdiff/2)*100) : 0
SMIsignal = ema(SMI,b)

//Lines
plot(SMI, color = blue, linewidth = 3, title = "Stochastic Momentum Index")
plot(SMIsignal, color = red, linewidth = 3, title = "SMI Signal Line")
plot(limitsmi, color = black, title = "Over Bought")
plot(-1 * limitsmi, color = black, title = "Over Sold")
plot(0, color = blue, title = "Zero Line")

//Color-Filter
gb = close > open or usecol == false
rb = close < open or usecol == false

//Body Filter
nbody = abs(close - open)
abody = sma(nbody, 10)
body = nbody > abody / 3 or usebod == false

//Signals
up1 = SMI < -1 * limitsmi and rb and body and usesmi
dn1 = SMI > limitsmi and gb and body and usesmi
up2 = fastrsi < limitrsi and rb and body and usersi
dn2 = fastrsi > 100 - limitrsi and gb and body and usersi
exit = ((strategy.position_size > 0 and close > open) or (strategy.position_size < 0 and close < open)) and body

//Background
redb = (SMI > limitsmi and usesmi) or (fastrsi > 100 - limitrsi and usersi)
limeb = (SMI < -1 * limitsmi and usesmi) or (fastrsi < limitrsi and usersi)
col = showbg == false ? na : redb ? red : limeb ? lime : na
bgcolor(col, transp = 50)

//Trading
profit = exit ? ((strategy.position_size > 0 and close > strategy.position_avg_price) or (strategy.position_size < 0 and close < strategy.position_avg_price)) ? 1 : -1 : profit[1]
mult = usemar ? exit ? profit == -1 ? mult[1] * 2 : 1 : mult[1] : 1
lot = strategy.position_size == 0 ? strategy.equity / close * capital / 100 * mult : lot[1]

signalup = ((up1 or up2) and double == false) or (up1 and up2 and double)
if signalup
    if strategy.position_size < 0
        strategy.close_all()

    strategy.entry("long", strategy.long, needlong == false ? 0 : lot, when=(time > timestamp(fromyear, frommonth, fromday, 00, 00) and time < timestamp(toyear, tomonth, today, 23, 59)))

signaldn = ((dn1 or dn2) and double == false) or (dn1 and dn2 and double)
if signaldn
    if strategy.position_size > 0
        strategy.close_all()

    strategy.entry("Short", strategy.short, needshort == false ? 0 : lot, when=(time > timestamp(fromyear, frommonth, fromday, 00, 00) and time < timestamp(toyear, tomonth, today, 23, 59)))

if time > timestamp(toyear, tomonth, today, 23, 59) or exit
strategy.close_all()Published by ChaoZhang on the FMZ strategy square · last modified 2023-12-12. Collected in the Quant Trading Vault. Unvalidated research: re-test with your own data and costs before trusting it.
Build this with AgenKit
A spec is not a trading system. Paste this into your coding agent and AgenKit runs a specialist team — architecture, test-first build, risk gates, review — with paper trading on by default.
/agenkit build a production-grade trading bot with a backtest engine, risk controls and paper trading by default from strategies/Stochastic-Momentum-Index-and-RSI-Based-Quant-Trading-Strategy.md- npx agenkit install engineering-kit in your project
- Paste the command into your agent and approve each phase
- Get tests, backtest, risk controls and a paper-trading switch
Understand it first
Before you run this, read the lesson behind the idea and how to backtest it honestly. Specs like this one are the survivors of an unknown number of trials; deflate their results accordingly.
Related specs
- MoonFlag MACD Momentum StochRSI Trading StrategyPine Script · Momentum · 1d
- Multi EMA Trend Momentum Trading Strategy with Risk Management SystemPine Script · Momentum · 1h
- Multi factor Adaptive Momentum Tracking StrategyPine Script · Momentum · 3m
- Dual Momentum Oscillator Smart Timing Trading StrategyPine Script · Momentum · 1h
- Momentum Trading Strategy Based on Multi factor ModelPine Script · Momentum · 1d
- Multi Confirmation EMA Trend and Stochastic RSI Momentum Trading StrategyPine Script · Momentum · 1m