Strategy vault / Mean reversion
Strategy of Synthesis between Multiple Relative Strength Indicators
The strategy of synthesis between multiple relative strength indicators (RSI) is a timing trading strategy that utilizes multiple RSIs with different periods to trade stocks. It tracks 1-, 2-, 3-, 4-, and 5-period…
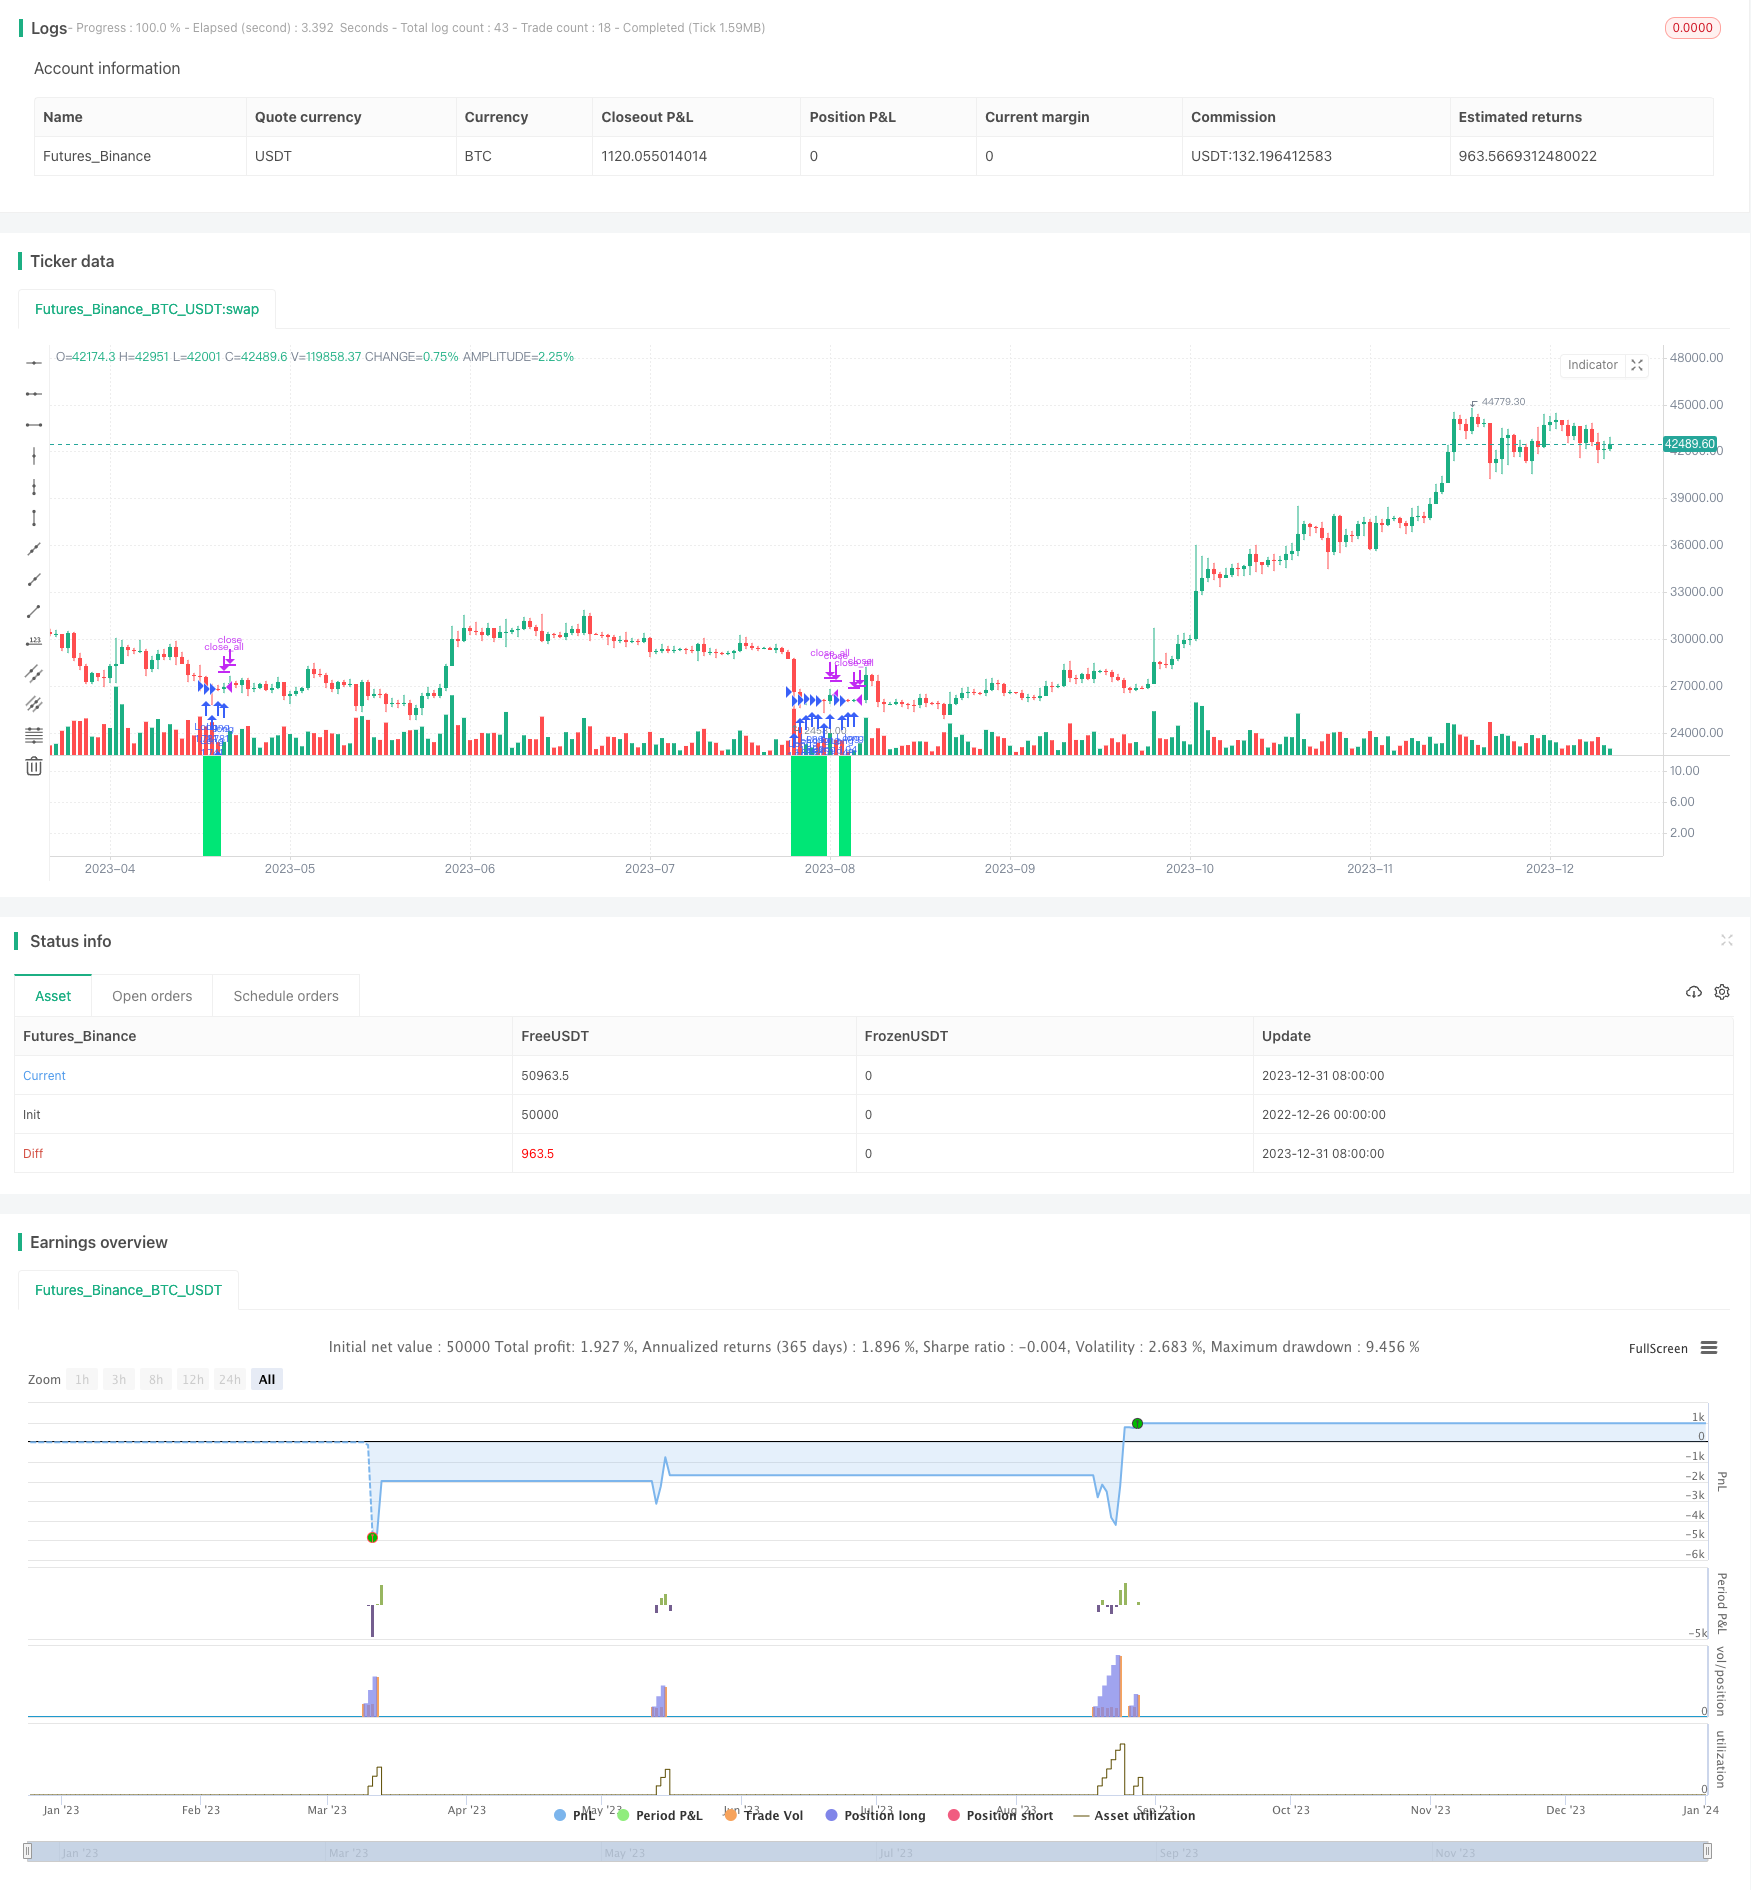
Overview
The strategy of synthesis between multiple relative strength indicators (RSI) is a timing trading strategy that utilizes multiple RSIs with different periods to trade stocks. It tracks 1-, 2-, 3-, 4-, and 5-period RSI indicators simultaneously. Buying signals are generated when any of the RSI goes below a threshold. Selling signals are generated when all RSIs exceed their own thresholds, in order to earn profits. Thus, timing entries and exits can be achieved in stocks.
Strategy Logic
The key rationale behind this strategy is to track 1-, 2-, 3-, 4-, and 5-period RSI indicators simultaneously, including 4-, 7-, 14-, 21-, and 28-period RSIs. Separate threshold values are set for each of the 5 RSI indicators. A buying signal is triggered when any of the RSI drops below its own threshold.
For example, the threshold of the 4-period RSI is set as 15. A buying signal is generated when the 4-period RSI falls below 15. The strategy checks other RSIs to see whether they also drop below their own thresholds. If yes, more buying signals will be produced.
When all the 5 RSI indicators rally and exceed their own thresholds, a selling signal is generated in order to gain profits. By congregation signals of the multiple-period indicators, accuracy of entries can be improved.
Strategy Strengths
- Improve accuracy of entries with multiple RSIs
The strategy utilizes 5 RSIs of different periods to generate buy and sell signals. One single indicator may generate false signal at times. However, with the congregation of multiple ones, accuracy of signal can be improved, hence enhancing accuracy of entries.
RSIs of different periods suitable for various market conditions
The 1-, 2-, 3-, 4-, 5-period RSIs used in this strategy can adapt to stock fluctuations of different frequencies. For instance, 28-period RSI suits long-term trading while 4-period RSI suits short-term trading. This guarantees the strategy works under different market situations.
Clean and clear code structure
The variable naming and overall structure of the strategy code is neat and self-evident. The logic flow for different indicators and signals is clear. This makes the strategy easy to understand, modify and optimize, which is of great essence for quantitative strategies.
Risks of The Strategy
Invalid in trending market
The strategy relies heavily on overbought and oversold signals. Its effectiveness would be compromised in persistent up- or downtrend market. This is a ubiquitous flaw of mean-reversion strategies using reverse indicators.
Difficulty in parameter optimization
A variety of indicators and input parameters exist in this strategy. This poses immense challenges for parameter optimization. Improper parameter combination may diminish the strategy efficacy drastically. Optimizing tools should be utilized to seek for the parameter set that maximizes strategy performance.
Frequent reversals between long and short
Due to the usage of multiple-period indicators, long and short position changes in the strategy could be rather frequent. This may lead to higher costs associated with trading and risks related to price slippage.
Directions for Optimization
Incorporate trend-following indicators
Trend tools such as MA and BOLL can be added. Signals are only taken when trend tools concur to the signals generated by reverse indicators. This helps avoid losses in persistent trend situations.
Reduce the number of RSI indicators
Try decreasing the number of RSI tools used. This mitigates the difficulty in parameter optimization. Experiments manifest 2 to 3 indicators can already create satisfying efficacy.
Optimize parameter ranges
Seek optimal ranges and combinations of RSI parameters and thresholds using optimization methods like gradient descent and random search. This maximizes strategy performance.
Conclusion
The strategy of RSI synthesis generates trading signals by congregation signals from multiple RSIs with different periods. This improves accuracy of entries to realize timing trading in stocks. Despite advantages inherited from the usage of multiple indicators, flaws including ineffectiveness in trending markets and difficulty in optimization remain. Methods like adding trend tools, reducing indicator numbers, and parameter optimization can help further boost the strategy's robustness.
Parameters
| Name | Default | What it controls |
|---|---|---|
| v_input_1 | true | Long |
| v_input_2 | true | Short |
| v_input_3 | 100 | Lot, % |
| v_input_4 | true | Use RSI 1 |
| v_input_5 | 4 | RSI 1 Period |
| v_input_6 | 15 | RSI 1 Limit |
| v_input_7 | true | Use RSI 2 |
| v_input_8 | 7 | RSI 2 Period |
| v_input_9 | 20 | RSI 2 Limit |
| v_input_10 | true | Use RSI 3 |
| v_input_11 | 14 | RSI 3 Period |
| v_input_12 | 25 | RSI 3 Limit |
| v_input_13 | true | Use RSI 4 |
| v_input_14 | 21 | RSI 4 Period |
| v_input_15 | 30 | RSI 4 Limit |
| v_input_16 | true | Use RSI 5 |
| v_input_17 | 28 | RSI 5 Period |
| v_input_18 | 35 | RSI 5 Limit |
| v_input_19 | false | Use color filter |
| v_input_20 | 1900 | From Year |
| v_input_21 | 2100 | To Year |
| v_input_22 | true | From Month |
| v_input_23 | 12 | To Month |
| v_input_24 | true | From Day |
| v_input_25 | 31 | To Day |
Source Pine Script
/*backtest
start: 2022-12-26 00:00:00
end: 2024-01-01 00:00:00
period: 1d
basePeriod: 1h
exchanges: [{"eid":"Futures_Binance","currency":"BTC_USDT"}]
*/

//Noro
//2018

//@version=2
strategy(title = "Noro's Symphony v1.0", shorttitle = "Symphony 1.0", overlay = false, default_qty_type = strategy.percent_of_equity, default_qty_value = 100, pyramiding = 20)

//Settings
needlong = input(true, defval = true, title = "Long")
needshort = input(true, defval = true, title = "Short")
capital = input(100, defval = 100, minval = 1, maxval = 10000, title = "Lot, %")
usersi1 = input(true, defval = true, title = "Use RSI 1")
rsiperiod1 = input(4, defval = 4, minval = 2, maxval = 100, title = "RSI 1 Period")
rsilimit1 = input(15, defval = 15, minval = 2, maxval = 50, title = "RSI 1 Limit")
usersi2 = input(true, defval = true, title = "Use RSI 2")
rsiperiod2 = input(7, defval = 7, minval = 2, maxval = 100, title = "RSI 2 Period")
rsilimit2 = input(20, defval = 20, minval = 2, maxval = 50, title = "RSI 2 Limit")
usersi3 = input(true, defval = true, title = "Use RSI 3")
rsiperiod3 = input(14, defval = 14, minval = 2, maxval = 100, title = "RSI 3 Period")
rsilimit3 = input(25, defval = 25, minval = 2, maxval = 50, title = "RSI 3 Limit")
usersi4 = input(true, defval = true, title = "Use RSI 4")
rsiperiod4 = input(21, defval = 21, minval = 2, maxval = 100, title = "RSI 4 Period")
rsilimit4 = input(30, defval = 30, minval = 2, maxval = 50, title = "RSI 4 Limit")
usersi5 = input(true, defval = true, title = "Use RSI 5")
rsiperiod5 = input(28, defval = 28, minval = 2, maxval = 100, title = "RSI 5 Period")
rsilimit5 = input(35, defval = 35, minval = 2, maxval = 50, title = "RSI 5 Limit")
cf = input(false, defval = false, title = "Use color filter")
fromyear = input(1900, defval = 1900, minval = 1900, maxval = 2100, title = "From Year")
toyear = input(2100, defval = 2100, minval = 1900, maxval = 2100, title = "To Year")
frommonth = input(01, defval = 01, minval = 01, maxval = 12, title = "From Month")
tomonth = input(12, defval = 12, minval = 01, maxval = 12, title = "To Month")
fromday = input(01, defval = 01, minval = 01, maxval = 31, title = "From Day")
today = input(31, defval = 31, minval = 01, maxval = 31, title = "To Day")

//RSI
rsi1 = rsi(close, rsiperiod1)
rsi2 = rsi(close, rsiperiod2)
rsi3 = rsi(close, rsiperiod3)
rsi4 = rsi(close, rsiperiod4)
rsi5 = rsi(close, rsiperiod5)

//Signals
up1 = rsi1 < rsilimit1 and usersi1
up2 = rsi2 < rsilimit2 and usersi2
up3 = rsi3 < rsilimit3 and usersi3
up4 = rsi4 < rsilimit4 and usersi4
up5 = rsi5 < rsilimit5 and usersi5

up = up1 or up2 or up3 or up4 or up5
exit = rsi1 > rsilimit1 and rsi2 > rsilimit2 and rsi3 > rsilimit3 and rsi4 > rsilimit4 and rsi5 > rsilimit5
lot = strategy.position_size == 0 ? strategy.equity / close * capital / 100 : lot[1]

//Background
col = up ? lime : na
bgcolor(col, transp = 0)

//Trading
if up and (close < open or cf == false)
    strategy.entry("Long", strategy.long, needlong == false ? 0 : lot)

if  exit
strategy.close_all()Published by ChaoZhang on the FMZ strategy square · last modified 2024-01-02. Collected in the Quant Trading Vault. Unvalidated research: re-test with your own data and costs before trusting it.
Build this with AgenKit
A spec is not a trading system. Paste this into your coding agent and AgenKit runs a specialist team — architecture, test-first build, risk gates, review — with paper trading on by default.
/agenkit build a production-grade trading bot with a backtest engine, risk controls and paper trading by default from strategies/Strategy-of-Synthesis-between-Multiple-Relative-Strength-Indicators.md- npx agenkit install engineering-kit in your project
- Paste the command into your agent and approve each phase
- Get tests, backtest, risk controls and a paper-trading switch
Understand it first
Before you run this, read the lesson behind the idea and how to backtest it honestly. Specs like this one are the survivors of an unknown number of trials; deflate their results accordingly.
Related specs
- ATR and EMA based Dynamic Take Profit and Stop Loss Adaptive StrategyPine Script · Mean reversion · 1h
- Adaptive Mean Reversion Trading Strategy Based on Chande Momentum OscillatorPine Script · Mean reversion · 1d
- Adaptive RSI Oscillator Dynamic Trading Strategy with Threshold OptimizationPine Script · Mean reversion · 1d
- Advanced 15 Minute Chart Trading Signal StrategyPine Script · Mean reversion · 3h
- Advanced Fibonacci Retracement Trend Following and Reversal Trading StrategyPine Script · Mean reversion · 3h
- Advanced Momentum EMA Trend Following with RSI Overbought Oversold Trading StrategyPine Script · Mean reversion · 1d