Super Ichi Strategy
The Super Ichi strategy is a trend trading strategy that makes trading decisions based on the Super Ichi indicator. It uses the relationships between the Tenkan line, Kijun line and the Ichimoku Cloud of the Super…
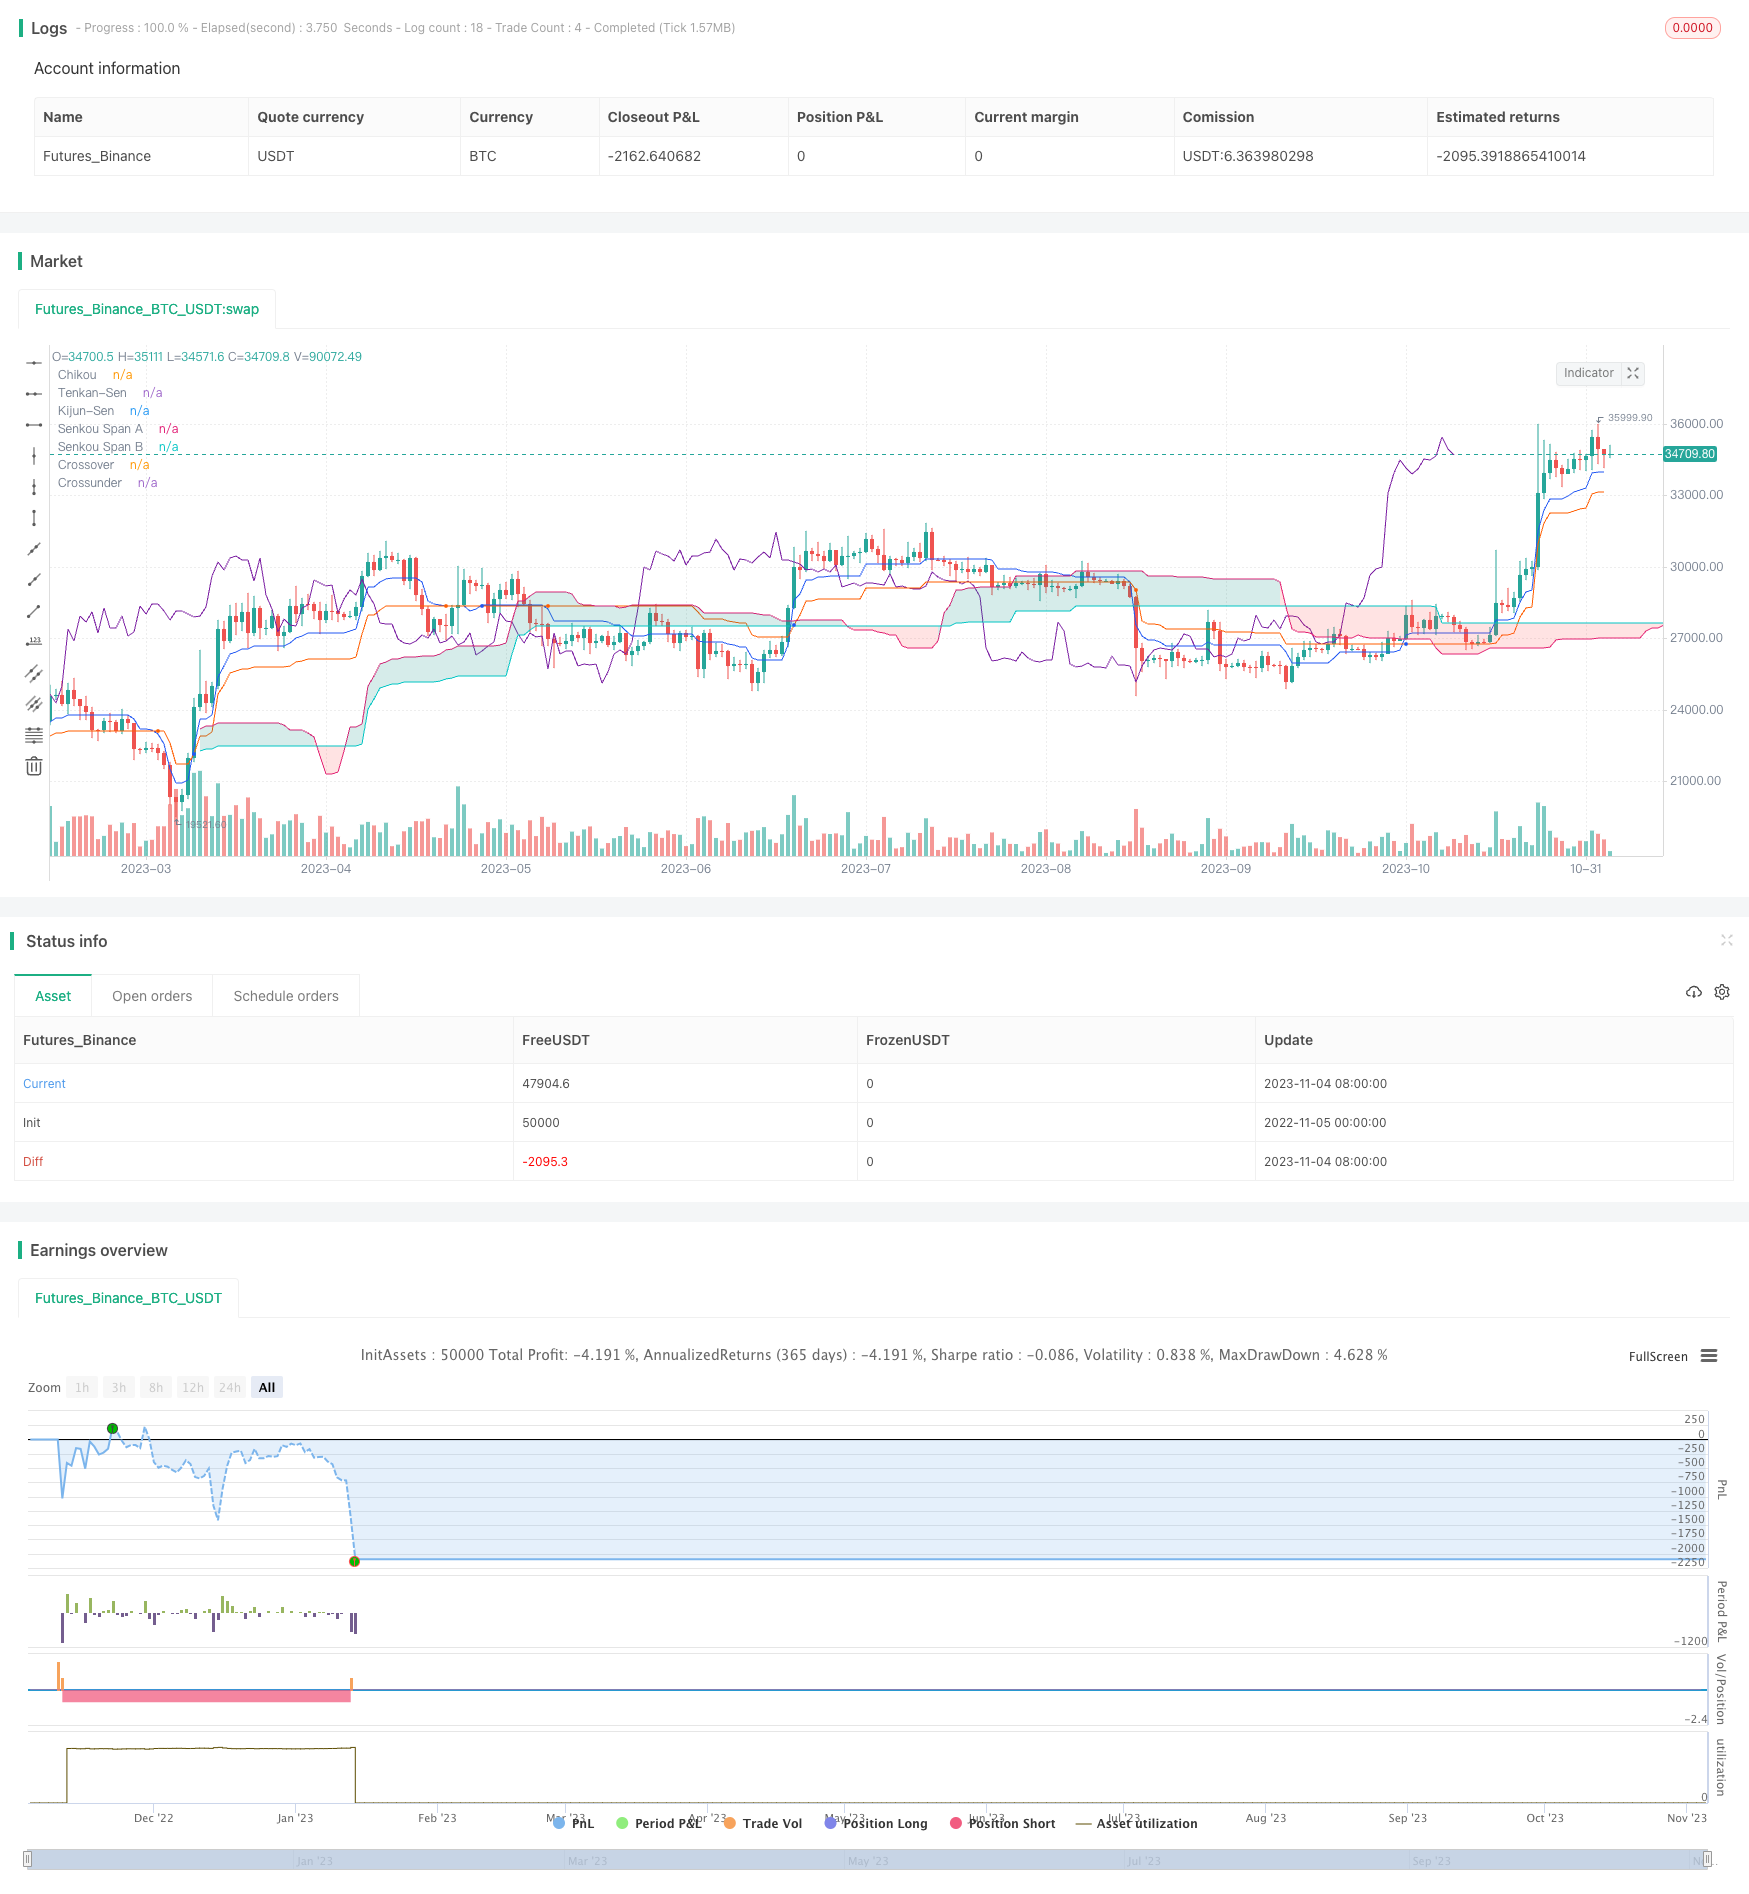
Overview
The Super Ichi strategy is a trend trading strategy that makes trading decisions based on the Super Ichi indicator. It uses the relationships between the Tenkan line, Kijun line and the Ichimoku Cloud of the Super Ichi indicator to determine the current trend direction, and enters on price pullbacks.
The Super Ichi strategy is mainly suitable for medium-to-long term trend trading and aims to profit from major trends. It also has strong trend identification capabilities.
Strategy Logic
The Super Ichi strategy mainly judges the following elements to determine the trading direction:
Tenkan and Kijun Relationship: Bullish when Tenkan is on top, bearish when below
Cloud Color: Bullish when cloud is green, bearish when red
Price Pullback: Requires a pullback from the lines before entry
Specifically, the trading signals are:
Long Signal:
- Tenkan above Kijun
- Price above Tenkan and Kijun
- Tenkan and Kijun above Cloud
- Price pulls back below Tenkan and Kijun
Short Signal:
- Tenkan below Kijun
- Price below Tenkan and Kijun
- Tenkan and Kijun below Cloud
- Price pulls back above Tenkan and Kijun
When the long/short signal is triggered, a position will be opened based on the current position.
Advantage Analysis
The Super Ichi strategy has the following advantages:
Uses Ichimoku combination to determine trends accurately
Tenkan/Kijun shows short-term, Cloud shows long-term trends
Pullback requirement avoids false breakouts
Risk management uses recent swing high/low for stop loss to limit losses
Reasonable risk-reward ratio for steady gains
Applicable to different timeframes for medium-to-long term trend trading
Clear logic and large optimization space
Performs well across various market conditions
Risk Analysis
The Super Ichi strategy also has the following risks:
Stop loss may be triggered frequently during ranging markets, impacting profitability
Failure to quickly reverse positions when trend changes swiftly could lead to losses
Default risk-reward ratios may not suit all instruments, fine tuning required
Limited upside potential when Cloud breakout has limited follow-through
Indicator parameters need extensive testing and optimization for active instruments
Risks can be reduced through:
Optimizing parameters for different timeframes and instruments
Adding filters to avoid false breakout entries during ranging market
Using dynamic stop loss to reduce being stopped out
Testing different risk-reward ratio settings
Confirming signal strength using chart patterns etc.
Optimization Directions
The Super Ichi strategy can be optimized in the following aspects:
Optimize Tenkan/Kijun parameters to better suit the traded instrument
Optimize Cloud parameters for better long-term trend assessment
Enhance stop loss algorithm, e.g. ATR-based or trailing stops
Add filters using other indicators to reduce false entries
Fine-tune risk-reward ratios for different instruments and timeframes
Use martingale position sizing to accommodate varying market volatility
Utilize machine learning for parameter optimization and robustness
Set separate parameters for day vs overnight sessions
Summary
The Super Ichi strategy is well-suited for medium-to-long term trend trading overall. It excels at determining trend direction using Ichimoku, while the pullback requirement avoids false entries. With parameter optimization, it can achieve steady profits across more instruments and timeframes. Easy to understand yet highly optimizable, the Super Ichi strategy serves as an excellent basic trend following strategy for research and learning.
Parameters
| Name | Default | What it controls |
|---|---|---|
| v_input_int_1 | 15 | (?Strategy: Risk Management)Swing High/Low Lookback Length |
| v_input_float_1 | 2 | Account percent loss per trade |
| v_input_float_2 | 2 | Profit Factor (R:R Ratio) |
| v_input_bool_1 | true | Use Swing High/Low ATR Override |
| v_input_int_2 | true | Swing High/Low ATR Override Multiplier |
| v_input_int_3 | 14 | Swing High/Low ATR Override Length |
| v_input_int_4 | 5 | (?Strategy: Settings)Pullback Lookback Length |
| v_input_int_5 | 2022 | (?Strategy: Date Range)Start Date |
| v_input_int_6 | 0 | start_month: 1 | 2 | 3 | 4 | 5 | 6 | 7 | 8 | 9 | 10 | 11 | 12 |
| v_input_int_7 | 0 | start_date: 1 | 2 | 3 | 4 | 5 | 6 | 7 | 8 | 9 | 10 | 11 | 12 | 13 | 14 | 15 | 16 | 17 | 18 | 19 | 20 | 21 | 22 | 23 | 24 | 25 | 26 | 27 | 28 | 29 | 30 | 31 |
| v_input_int_8 | 2023 | End Date |
| v_input_int_9 | 0 | end_month: 1 | 2 | 3 | 4 | 5 | 6 | 7 | 8 | 9 | 10 | 11 | 12 |
| v_input_int_10 | 0 | end_date: 1 | 2 | 3 | 4 | 5 | 6 | 7 | 8 | 9 | 10 | 11 | 12 | 13 | 14 | 15 | 16 | 17 | 18 | 19 | 20 | 21 | 22 | 23 | 24 | 25 | 26 | 27 | 28 | 29 | 30 | 31 |
| v_input_1 | 9 | (?Indicator: SuperIchi Settings)Tenkan |
| v_input_2 | 2 | tenkan_mult |
| v_input_3 | 26 | Kijun |
| v_input_4 | 4 | kijun_mult |
| v_input_5 | 52 | Senkou Span B |
| v_input_6 | 6 | spanB_mult |
| v_input_7 | 26 | Displacement |
Source Pine Script
/*backtest
start: 2022-11-05 00:00:00
end: 2023-11-05 00:00:00
period: 1d
basePeriod: 1h
exchanges: [{"eid":"Futures_Binance","currency":"BTC_USDT"}]
*/

// Strategy based on the the SuperIchi indicator.
//
// Strategy was designed for the purpose of back testing.
// See strategy documentation for info on trade entry logic.
//
// Credits:
//  - SuperIchi [LUX]: LuxAlgo (https://www.tradingview.com/script/vDGd9X9y-SuperIchi-LUX/)

//@version=5
strategy("SuperIchi Strategy", overlay=true, initial_capital=1000, currency=currency.NONE, max_labels_count=500, default_qty_type=strategy.cash, commission_type=strategy.commission.percent, commission_value=0.01)

// =============================================================================
// STRATEGY INPUT SETTINGS
// =============================================================================

// ---------------
// Risk Management
// ---------------
swingLength = input.int(15, "Swing High/Low Lookback Length", group='Strategy: Risk Management', tooltip='Stop Loss is calculated by the swing high or low over the previous X candles')
accountRiskPercent = input.float(2, "Account percent loss per trade", step=0.1, group='Strategy: Risk Management', tooltip='Each trade will risk X% of the account balance')
profitFactor = input.float(2, "Profit Factor (R:R Ratio)", step = 0.1, group='Strategy: Risk Management')
useAtrOverride = input.bool(true, "Use Swing High/Low ATR Override", group='Strategy: Risk Management', tooltip='In some cases price may not have a large enough (if any) swing withing previous X candles. Turn this on to use an ATR value when swing high/low is lower than the given ATR value')
atrMultiplier = input.int(1, "Swing High/Low ATR Override Multiplier", group='Strategy: Risk Management')
atrLength = input.int(14, "Swing High/Low ATR Override Length", group='Strategy: Risk Management')

// -----------------
// Strategy Settings
// -----------------
pullbackLength = input.int(5, "Pullback Lookback Length", group='Strategy: Settings', tooltip='Number of candles to consider for a pullback into the moving averages (prerequisite for trade entry)')

// ----------
// Date Range
// ----------
start_year = input.int(title='Start Date', defval=2022, minval=2010, maxval=3000, group='Strategy: Date Range', inline='1')
start_month = input.int(title='', defval=1, group='Strategy: Date Range', inline='1', options = [1, 2, 3, 4, 5, 6, 7, 8, 9, 10, 11, 12])
start_date = input.int(title='', defval=1, group='Strategy: Date Range', inline='1', options = [1, 2, 3, 4, 5, 6, 7, 8, 9, 10, 11, 12, 13, 14, 15, 16, 17, 18, 19, 20, 21, 22, 23, 24, 25, 26, 27, 28, 29, 30, 31])
end_year = input.int(title='End Date', defval=2023, minval=1800, maxval=3000, group='Strategy: Date Range', inline='2')
end_month = input.int(title='', defval=1, group='Strategy: Date Range', inline='2', options = [1, 2, 3, 4, 5, 6, 7, 8, 9, 10, 11, 12])
end_date = input.int(title='', defval=1, group='Strategy: Date Range', inline='2', options = [1, 2, 3, 4, 5, 6, 7, 8, 9, 10, 11, 12, 13, 14, 15, 16, 17, 18, 19, 20, 21, 22, 23, 24, 25, 26, 27, 28, 29, 30, 31])
in_date_range = time >= timestamp(syminfo.timezone, start_year, start_month, start_date, 0, 0) and time < timestamp(syminfo.timezone, end_year, end_month, end_date, 0, 0)

// =============================================================================
// INDICATORS
// =============================================================================

// ---------------
// SuperIchi [LUX]
// ---------------
tenkan_len  = input(9,'Tenkan          ',inline='SuperIchi', group='Indicator: SuperIchi Settings')
tenkan_mult = input(2.,'',inline='SuperIchi', group='Indicator: SuperIchi Settings')

kijun_len   = input(26,'Kijun             ',inline='SuperIchi', group='Indicator: SuperIchi Settings')
kijun_mult  = input(4.,'',inline='SuperIchi', group='Indicator: SuperIchi Settings')

spanB_len   = input(52,'Senkou Span B ',inline='SuperIchi', group='Indicator: SuperIchi Settings')
spanB_mult  = input(6.,'',inline='SuperIchi', group='Indicator: SuperIchi Settings')

offset      = input(26,'Displacement', inline='SuperIchi', group='Indicator: SuperIchi Settings')
//------------------------------------------------------------------------------
avg(src,length,mult)=>
    atr = ta.atr(length)*mult
    up = hl2 + atr
    dn = hl2 - atr
    upper = 0.,lower = 0.
    upper := src[1] < upper[1] ? math.min(up,upper[1]) : up
    lower := src[1] > lower[1] ? math.max(dn,lower[1]) : dn

    os = 0,max = 0.,min = 0.
    os := src > upper ? 1 : src < lower ? 0 : os[1]
    spt = os == 1 ? lower : upper
    max := ta.cross(src,spt) ? math.max(src,max[1]) : os == 1 ? math.max(src,max[1]) : spt
    min := ta.cross(src,spt) ? math.min(src,min[1]) : os == 0 ? math.min(src,min[1]) : spt
    math.avg(max,min)
//------------------------------------------------------------------------------
tenkan = avg(close,tenkan_len,tenkan_mult)
kijun = avg(close,kijun_len,kijun_mult)

senkouA = math.avg(kijun,tenkan)
senkouB = avg(close,spanB_len,spanB_mult)
//------------------------------------------------------------------------------
tenkan_css = #2157f3 //blue
kijun_css = #ff5d00 //red

cloud_a = color.new(color.teal,80)
cloud_b = color.new(color.red,80)

chikou_css = #7b1fa2

plot(tenkan,'Tenkan-Sen',tenkan_css)
plot(kijun,'Kijun-Sen',kijun_css)

plot(ta.crossover(tenkan,kijun) ? kijun : na,'Crossover',#2157f3,3,plot.style_circles)
plot(ta.crossunder(tenkan,kijun) ? kijun : na,'Crossunder',#ff5d00,3,plot.style_circles)

A = plot(senkouA,'Senkou Span A',na,offset=offset-1)
B = plot(senkouB,'Senkou Span B',na,offset=offset-1)
fill(A,B,senkouA > senkouB ? cloud_a : cloud_b)

plot(close,'Chikou',chikou_css,offset=-offset+1,display=display.none)


// =============================================================================
// STRATEGY LOGIC
// =============================================================================
plotchar(kijun, "kijun", "", location = location.top)
plotchar(senkouA[offset-1], "senkouA", "", location = location.top)


plotchar(tenkan > kijun, "line above", "", location = location.top)
plotchar(close > tenkan, "price above", "", location = location.top)
plotchar(kijun > senkouA[offset-1], "above cloud", "", location = location.top)
// blue line above red line + price above both lines + both lines above cloud
longSen = tenkan > kijun and close > tenkan and kijun > senkouA[offset-1]
// red line below blue line + price below both lines + both lines below cloud
shortSen = tenkan < kijun and close < tenkan and kijun < senkouA[offset-1]

plotchar(longSen, "longSen", "", location = location.top)
plotchar(shortSen, "shortSen", "", location = location.top)

// Cloud is green
longSenkou = senkouA[offset-1] > senkouB[offset-1]
// Cloud is red
shortSenkou = senkouA[offset-1] < senkouB[offset-1]

// price must have pulled back below sen lines before entry
barsSinceLongPullback = ta.barssince(close < kijun and close < tenkan)
longPullback = barsSinceLongPullback <= pullbackLength
// price must have pulled back above sen lines before entry
barsSinceShortPullback = ta.barssince(close > kijun and close > tenkan)
shortPullback = barsSinceShortPullback <= pullbackLength

// plotchar(lowestClose, "lowestClose", "", location = location.top)
// plotchar(highestClose, "highestClose", "", location = location.top)

inLong = strategy.position_size > 0
inShort = strategy.position_size < 0

longCondition = longSen and longSenkou and longPullback and in_date_range
shortCondition = shortSen and shortSenkou and shortPullback and in_date_range

swingLow = ta.lowest(source=low, length=swingLength)
swingHigh = ta.highest(source=high, length=swingLength)

atr = useAtrOverride ? ta.atr(atrLength) * atrMultiplier : 0
longSl = math.min(close - atr, swingLow)
shortSl = math.max(close + atr, swingHigh)

longStopPercent = math.abs((1 - (longSl / close)) * 100)
shortStopPercent = math.abs((1 - (shortSl / close)) * 100)

longTpPercent = longStopPercent * profitFactor
shortTpPercent = shortStopPercent * profitFactor
longTp = close + (close * (longTpPercent / 100))
shortTp = close - (close * (shortTpPercent / 100))

// Position sizing (default risk 2% per trade)
riskAmt = strategy.equity * accountRiskPercent / 100
longQty = math.abs(riskAmt / longStopPercent * 100) / close
shortQty = math.abs(riskAmt / shortStopPercent * 100) / close

if (longCondition and not inLong)
    strategy.entry("Long", strategy.long, qty=longQty)
    strategy.exit("Long  SL/TP", from_entry="Long", stop=longSl, limit=longTp, alert_message='Long SL Hit')
    buyLabel = label.new(x=bar_index, y=high[1], color=color.green, style=label.style_label_up)
    label.set_y(id=buyLabel, y=low)
    label.set_tooltip(id=buyLabel, tooltip="Risk Amt: " + str.tostring(riskAmt) + "\nQty: " + str.tostring(longQty) + "\nSwing low: " + str.tostring(swingLow) + "\nStop Percent: " + str.tostring(longStopPercent) + "\nTP Percent: " + str.tostring(longTpPercent))

if (shortCondition and not inShort)
    strategy.entry("Short", strategy.short, qty=shortQty)
    strategy.exit("Short  SL/TP", from_entry="Short", stop=shortSl, limit=shortTp, alert_message='Short SL Hit')
    sellLabel = label.new(x=bar_index, y=high[1], color=color.red, style=label.style_label_up)
    label.set_y(id=sellLabel, y=low)
    label.set_tooltip(id=sellLabel, tooltip="Risk Amt: " + str.tostring(riskAmt) + "\nQty: " + str.tostring(shortQty) + "\nSwing high: " + str.tostring(swingHigh) + "\nStop Percent: " + str.tostring(shortStopPercent) + "\nTP Percent: " + str.tostring(shortTpPercent))
Published by ChaoZhang on the FMZ strategy square · last modified 2023-11-06. Collected in the Quant Trading Vault. Unvalidated research: re-test with your own data and costs before trusting it.
Build this with AgenKit
A spec is not a trading system. Paste this into your coding agent and AgenKit runs a specialist team — architecture, test-first build, risk gates, review — with paper trading on by default.
/agenkit build a production-grade trading bot with a backtest engine, risk controls and paper trading by default from strategies/Super-Ichi-Strategy.md- npx agenkit install engineering-kit in your project
- Paste the command into your agent and approve each phase
- Get tests, backtest, risk controls and a paper-trading switch
Understand it first
Before you run this, read the lesson behind the idea and how to backtest it honestly. Specs like this one are the survivors of an unknown number of trials; deflate their results accordingly.
Related specs
- Quantitative Trading Strategy Based on Ichimoku with Multiple SignalsPine Script · Breakout · 1h
- Integrated Ichimoku Keltner Trading System Based on Moving Average StrategyPine Script · Breakout · 1h
- ATR Stop Loss Ichimoku Kijun Breakout StrategyPine Script · Breakout · 15m
- Ichimoku Entries StrategyPine Script · Breakout · 1d
- Multi Dimensional Ichimoku Cloud Price Breakthrough Trend Confirmation Trading StrategyPine Script · Breakout · 10m
- BVs ICHIMOKU CLOUD All SignalsPine Script · Breakout · 1h