Strategy vault / Trend following
Super Trend V Strategy
The Super Trend V strategy is a short-term trading strategy based on moving averages and standard deviations. It uses the Super Trend indicator to determine the price trend direction and combines the support and…
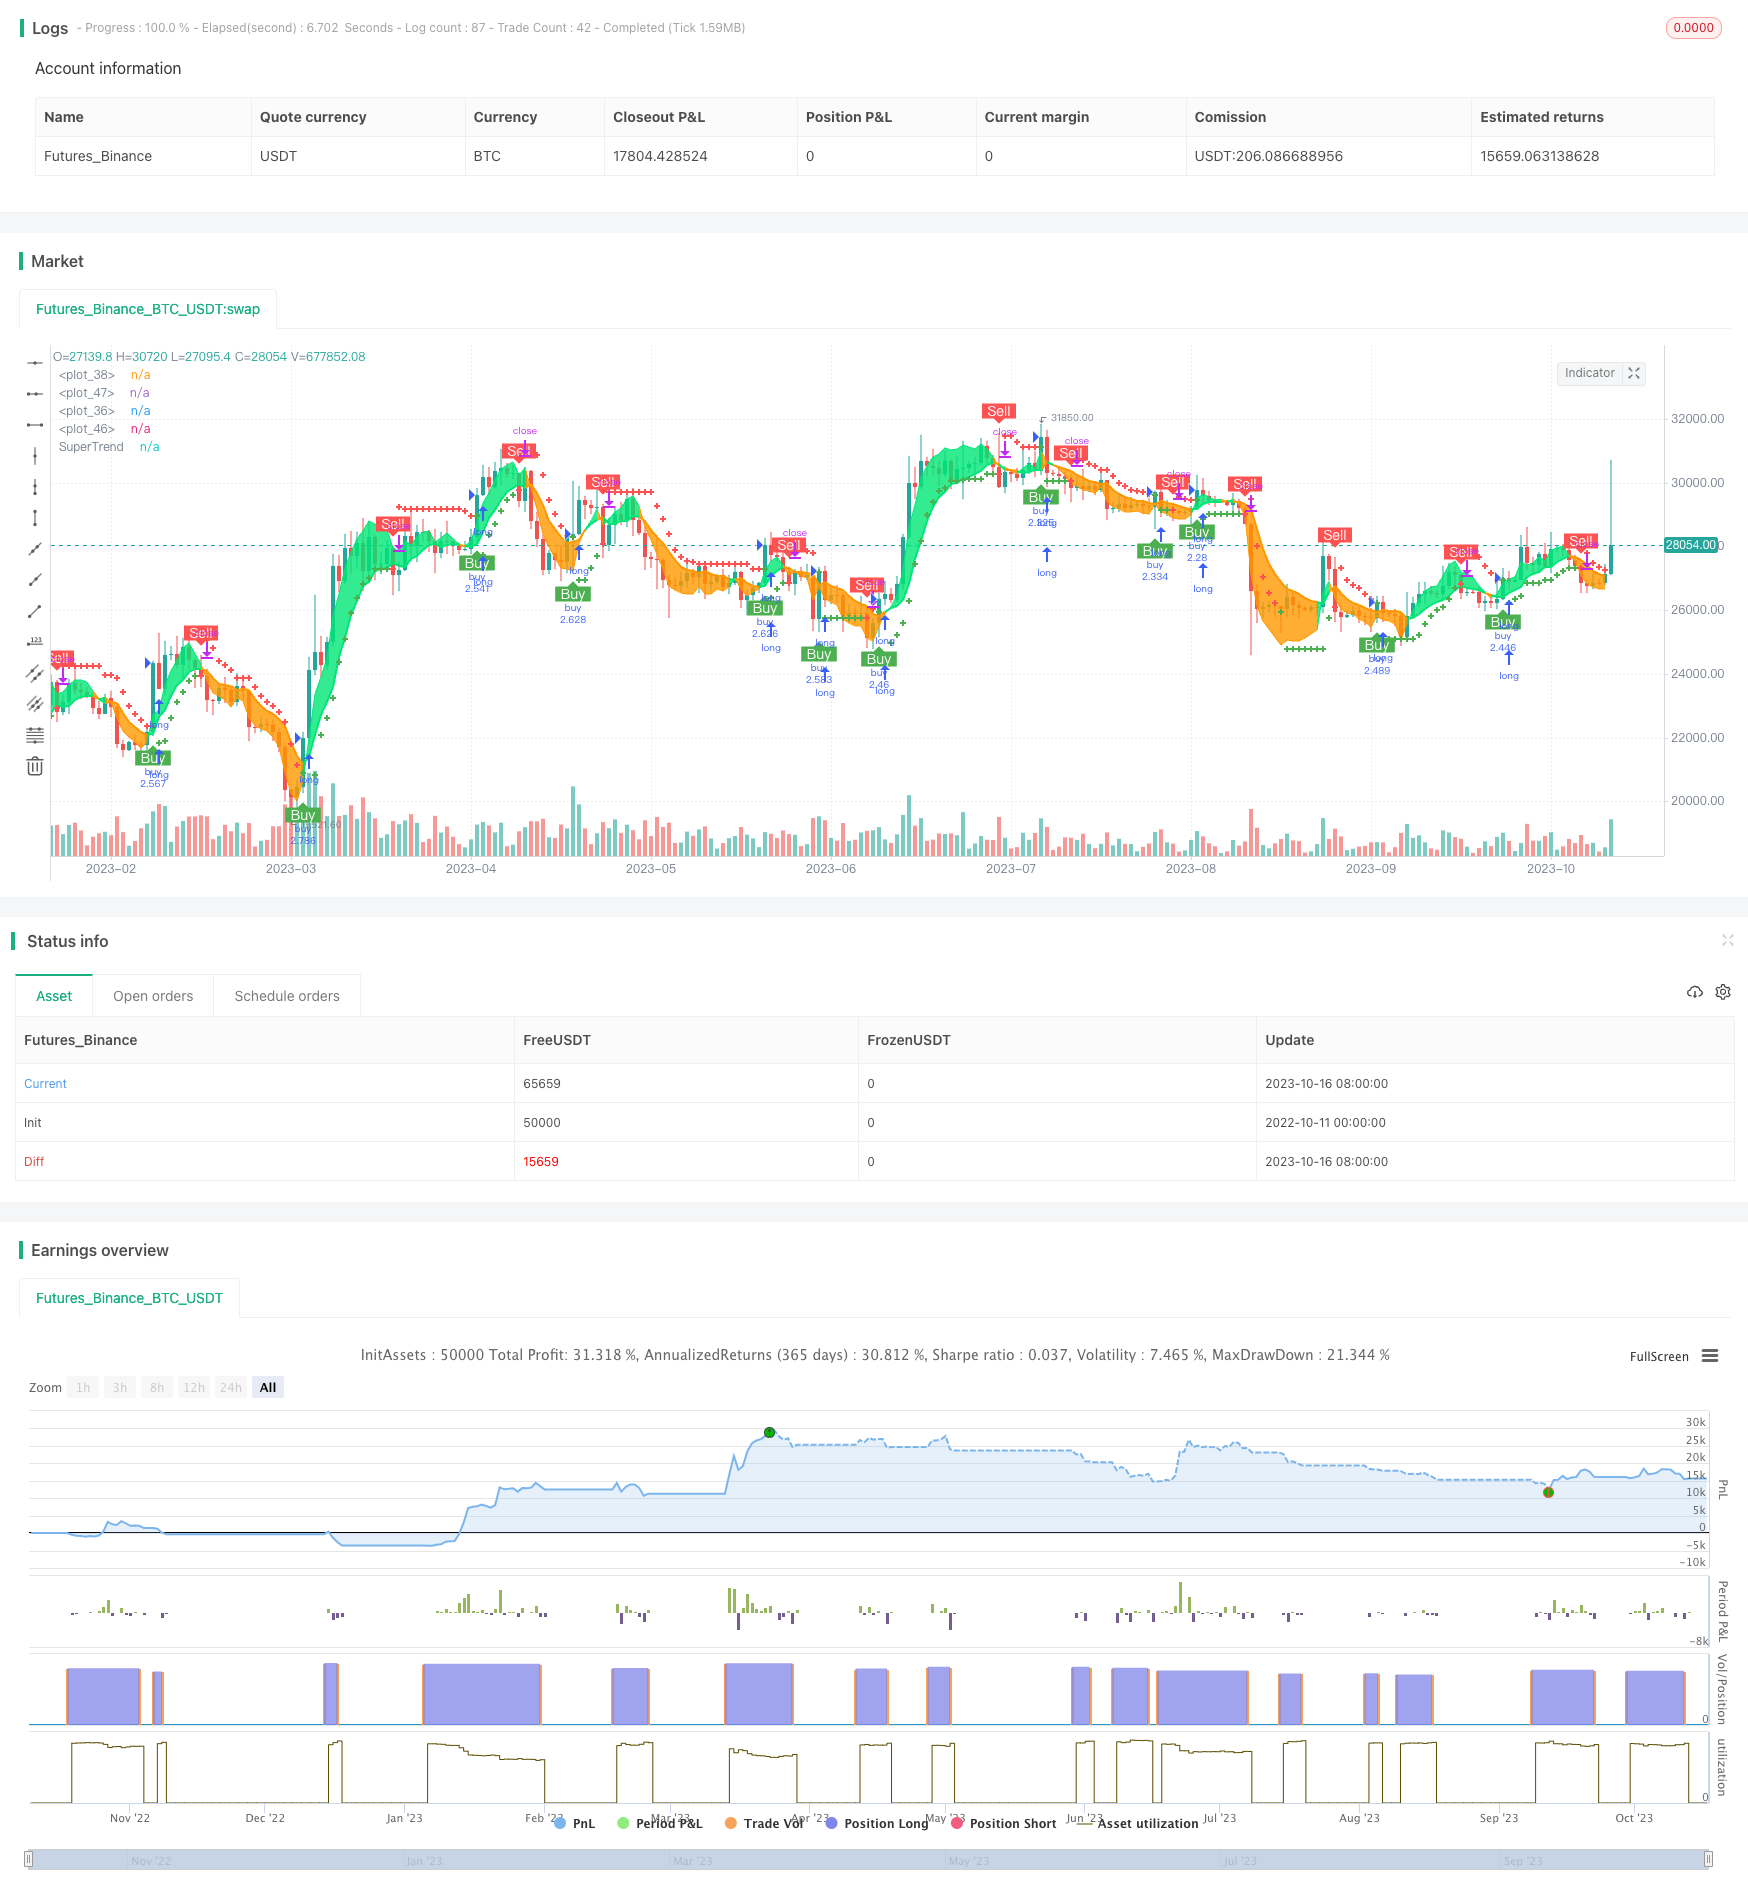
Overview
The Super Trend V strategy is a short-term trading strategy based on moving averages and standard deviations. It uses the Super Trend indicator to determine the price trend direction and combines the support and resistance formed by moving averages to enter the market. Meanwhile, it uses the standard deviation channel to predict the potential support and resistance zones of the price and sets the stop loss and take profit price range to implement a trend-following and efficient-exiting short-term trading strategy.
Strategy Logic
Firstly, this strategy calculates the Super Trend indicator. The Super Trend indicator uses the relationship between ATR and price to determine the trend direction. When the price is above the rising trend, it is bullish. When the price is below the falling trend, it is bearish.
Then it calculates the EMA of price and the EMA of open price. When the price crosses above the EMA and is higher than the open price EMA, it is a buy signal. When the price crosses below the EMA and is lower than the open price EMA, it is a sell signal.
Next, it uses standard deviation to calculate the upper and lower bands of the price channel and makes smoothing processing. When the price breaks through the upper band of standard deviation, it is a stop loss signal. When the price breaks through the lower band of standard deviation, it is a take profit signal.
Finally, it combines moving averages of different timeframes to determine the trend direction, together with the Super Trend indicator, to form a stable trend judgment.
Advantages of the Strategy
- Use Super Trend indicator to determine the price trend direction, avoiding losses caused by trend reversal
- Moving averages combined with open price help determine entry timing, avoiding false breakdowns
- Standard deviation channel predicts potential support and resistance zones of the price for stop loss and take profit
- Multiple timeframes combination improves the stability of trend judgment
Risks of the Strategy
- Super Trend indicator has lagging effect, may miss trend change points
- Crossovers of moving averages have lagging effect, entry timing may not be accurate
- Range of standard deviation channel is too fixed to reflect market fluctuation in real time
- Judgment based on multiple timeframes may conflict with each other
Risk Management:
- Shorten Super Trend parameters properly to improve sensitivity
- Optimize moving average periods, or add other indicators to determine entry
- Adjust standard deviation channel dynamically to match the market
- Define clear logic for multi-timeframe judgments to handle conflicts
Optimization Directions
- Optimize Super Trend parameters to find the best combination
- Try other indicators combined with moving averages to determine entry
- Try dynamic adjustment of standard deviation channel
- Test different multi-timeframe combinations to find the best match
- Optimize stop loss and take profit strategies to improve profit space
Conclusion
The Super Trend V strategy integrates the advantages of trend, moving average, standard deviation channel and other indicators to achieve stable trend judgment, proper entry timing, and stop loss and take profit based on price zones. By optimizing parameters, indicators, stop loss and take profit, etc., it can improve the stability and profitability of the strategy. Its solid logic and rigorous thinking are worth learning and researching.
Parameters
| Name | Default | What it controls |
|---|---|---|
| v_input_1 | 0 | Strategy Direction: long | short | all |
| v_input_2 | 720 | tf |
| v_input_3 | true | SuperTrend Multiplier |
| v_input_4 | 10 | SuperTrend Period |
| v_input_5 | 2 | TP VWAP Deviation |
| v_input_6 | 150 | TP length |
| v_input_7 | 2016 | Backtest Start Year |
| v_input_8 | true | Backtest Start Month |
| v_input_9 | true | Backtest Start Day |
| v_input_10 | 2030 | Backtest Stop Year |
| v_input_11 | 12 | Backtest Stop Month |
| v_input_12 | 30 | Backtest Stop Day |
Source Pine Script
/*backtest
start: 2022-10-11 00:00:00
end: 2023-10-17 00:00:00
period: 1d
basePeriod: 1h
exchanges: [{"eid":"Futures_Binance","currency":"BTC_USDT"}]
*/

// © theCrypster 2020

//@version=4
strategy(title = "Super trend V Strategy version", overlay = true, pyramiding=1,initial_capital = 1000, default_qty_type= strategy.percent_of_equity, default_qty_value = 100, calc_on_order_fills=false, slippage=0,commission_type=strategy.commission.percent,commission_value=0.075)
strat_dir_input = input(title="Strategy Direction", defval="long", options=["long", "short", "all"])
strat_dir_value = strat_dir_input == "long" ? strategy.direction.long : strat_dir_input == "short" ? strategy.direction.short : strategy.direction.all
strategy.risk.allow_entry_in(strat_dir_value)
hilow = ((high - low)*100)
openclose = ((close - open)*100)
vol = (volume / hilow)
spreadvol = (openclose * vol)
VPT = spreadvol + cum(spreadvol)
window_len = 28

v_len = 14
price_spread = stdev(high-low, window_len)

v =  spreadvol + cum(spreadvol)
smooth = sma(v, v_len)
v_spread = stdev(v - smooth, window_len)
shadow = (v - smooth) / v_spread * price_spread

out = shadow > 0 ? high + shadow : low + shadow
//
src = out
src1=open
src2=low
src3=high
tf =input(720)
len = timeframe.isintraday and timeframe.multiplier >= 1 ?
   tf / timeframe.multiplier * 7 :
   timeframe.isintraday and timeframe.multiplier < 60 ?
   60 / timeframe.multiplier * 24 * 7 : 7

c = ema(src, len)
plot(c,color=color.red)
o = ema(src1,len)
plot(o,color=color.blue)
//h = ema(src3,len)
//l=ema(src2,len)
//
col=c > o? color.lime : color.orange
vis = true
vl = c
ll = o
m1 = plot(vl, color=col, linewidth=1, transp=60)
m2 = plot(vis ? ll : na,  color=col, linewidth=2, transp=80)

fill(m1, m2,  color=col, transp=70)
//

vpt=ema(out,len)

// INPUTS //
st_mult   = input(1,   title = 'SuperTrend Multiplier', minval = 0, maxval = 100, step = 0.01)
st_period = input(10, title = 'SuperTrend Period',     minval = 1)

// CALCULATIONS //
up_lev = vpt - (st_mult * atr(st_period))
dn_lev = vpt + (st_mult * atr(st_period))

up_trend   = 0.0
up_trend   := close[1] > up_trend[1]   ? max(up_lev, up_trend[1])   : up_lev

down_trend = 0.0
down_trend := close[1] < down_trend[1] ? min(dn_lev, down_trend[1]) : dn_lev

// Calculate trend var
trend = 0
trend := close > down_trend[1] ? 1: close < up_trend[1] ? -1 : nz(trend[1], 1)

// Calculate SuperTrend Line
st_line = trend ==1 ? up_trend : down_trend

// Plotting
plot(st_line[1], color = trend == 1 ? color.green : color.red , style = plot.style_cross, linewidth = 2, title = "SuperTrend")
buy=crossover( close, st_line) and close>o
sell=crossunder(close, st_line) and close<o
//plotshape(crossover( close, st_line), location = location.belowbar, color = color.green,size=size.tiny)
//plotshape(crossunder(close, st_line), location = location.abovebar, color = color.red,size=size.tiny)
plotshape(buy, title="buy", text="Buy", color=color.green, style=shape.labelup, location=location.belowbar, size=size.small, textcolor=color.white, transp=0)  //plot for buy icon
plotshape(sell, title="sell", text="Sell", color=color.red, style=shape.labeldown, location=location.abovebar, size=size.small, textcolor=color.white, transp=0)  //plot for sell icon


//
multiplier = input(title="TP VWAP Deviation", type=input.float, defval=2, minval=1)
src5 = vwap
len5 = input(title="TP length", defval=150, minval=1)
offset = 0

calcSlope(src5, len5) =>
    sumX = 0.0
    sumY = 0.0
    sumXSqr = 0.0
    sumXY = 0.0
    for i = 1 to len5
        val = src5[len5-i]
        per = i + 1.0
        sumX := sumX + per
        sumY := sumY + val
        sumXSqr := sumXSqr + per * per
        sumXY := sumXY + val * per


    slope = (len5 * sumXY - sumX * sumY) / (len5 * sumXSqr - sumX * sumX)
    average = sumY / len5
    intercept = average - slope * sumX / len5 + slope
    [slope, average, intercept]

var float tmp = na
[s, a, i] = calcSlope(src5, len5)

vwap1=(i + s * (len5 - offset))
sdev = stdev(vwap, len5)
dev = multiplier * sdev
top=vwap1+dev
bott=vwap1-dev

//
z1 = vwap1 + dev
x1 = vwap1 - dev

low1 = crossover(close, x1)
high1 = crossunder(close, z1)

plotshape(low1, title="low", text="TP", color=color.red, style=shape.labelup, location=location.belowbar, size=size.small, textcolor=color.white, transp=0)  //plot for buy icon
plotshape(high1, title="high", text="TP", color=color.green, style=shape.labeldown, location=location.abovebar, size=size.small, textcolor=color.white, transp=0)  //plot for sell icon


//
// Testing Start dates
testStartYear = input(2016, "Backtest Start Year")
testStartMonth = input(1, "Backtest Start Month")
testStartDay = input(1, "Backtest Start Day")
testPeriodStart = timestamp(testStartYear,testStartMonth,testStartDay,0,0)
//Stop date if you want to use a specific range of dates
testStopYear = input(2030, "Backtest Stop Year")
testStopMonth = input(12, "Backtest Stop Month")
testStopDay = input(30, "Backtest Stop Day")
testPeriodStop = timestamp(testStopYear,testStopMonth,testStopDay,0,0)


testPeriod() =>
    time >= testPeriodStart and time <= testPeriodStop ? true : false

l = buy
s1 = sell

if l and testPeriod()
    strategy.entry("buy", strategy.long)
if s1 and testPeriod()
    strategy.entry("sell", strategy.short)
Published by ChaoZhang on the FMZ strategy square · last modified 2023-10-18. Collected in the Quant Trading Vault. Unvalidated research: re-test with your own data and costs before trusting it.
Build this with AgenKit
A spec is not a trading system. Paste this into your coding agent and AgenKit runs a specialist team — architecture, test-first build, risk gates, review — with paper trading on by default.
/agenkit build a production-grade trading bot with a backtest engine, risk controls and paper trading by default from strategies/Super-Trend-V-Strategy.md- npx agenkit install engineering-kit in your project
- Paste the command into your agent and approve each phase
- Get tests, backtest, risk controls and a paper-trading switch
Understand it first
Before you run this, read the lesson behind the idea and how to backtest it honestly. Specs like this one are the survivors of an unknown number of trials; deflate their results accordingly.
Related specs
- Trend Confirmation Tracking StrategyPine Script · Trend following · 1h
- Fixed Range Volume Profile And Anchored VWAP Trend Identification Strategy With Dynamic Stop LossPine Script · Trend following · 1h
- Multi Indicator Dynamic Trend Following Strategy Based on EMA and SMAPine Script · Trend following · 1d
- Trend Following Strategy Based on PMax IndicatorPine Script · Trend following · 5m
- Trend Tracking and Short term Trading Strategy Based on ADX IndicatorPine Script · Trend following · 1d
- Triple Supertrend Ichimoku Cloud Quantitative Trading StrategyPine Script · Trend following · 1d