Strategy vault / Trend following
Supertrend Bollinger Bands Strategy
The Supertrend Bollinger Bands strategy is a common trailing stop indicator strategy based on the ATR (Average True Range). This strategy uses the Supertrend indicator to draw bullish and bearish trend channels on…
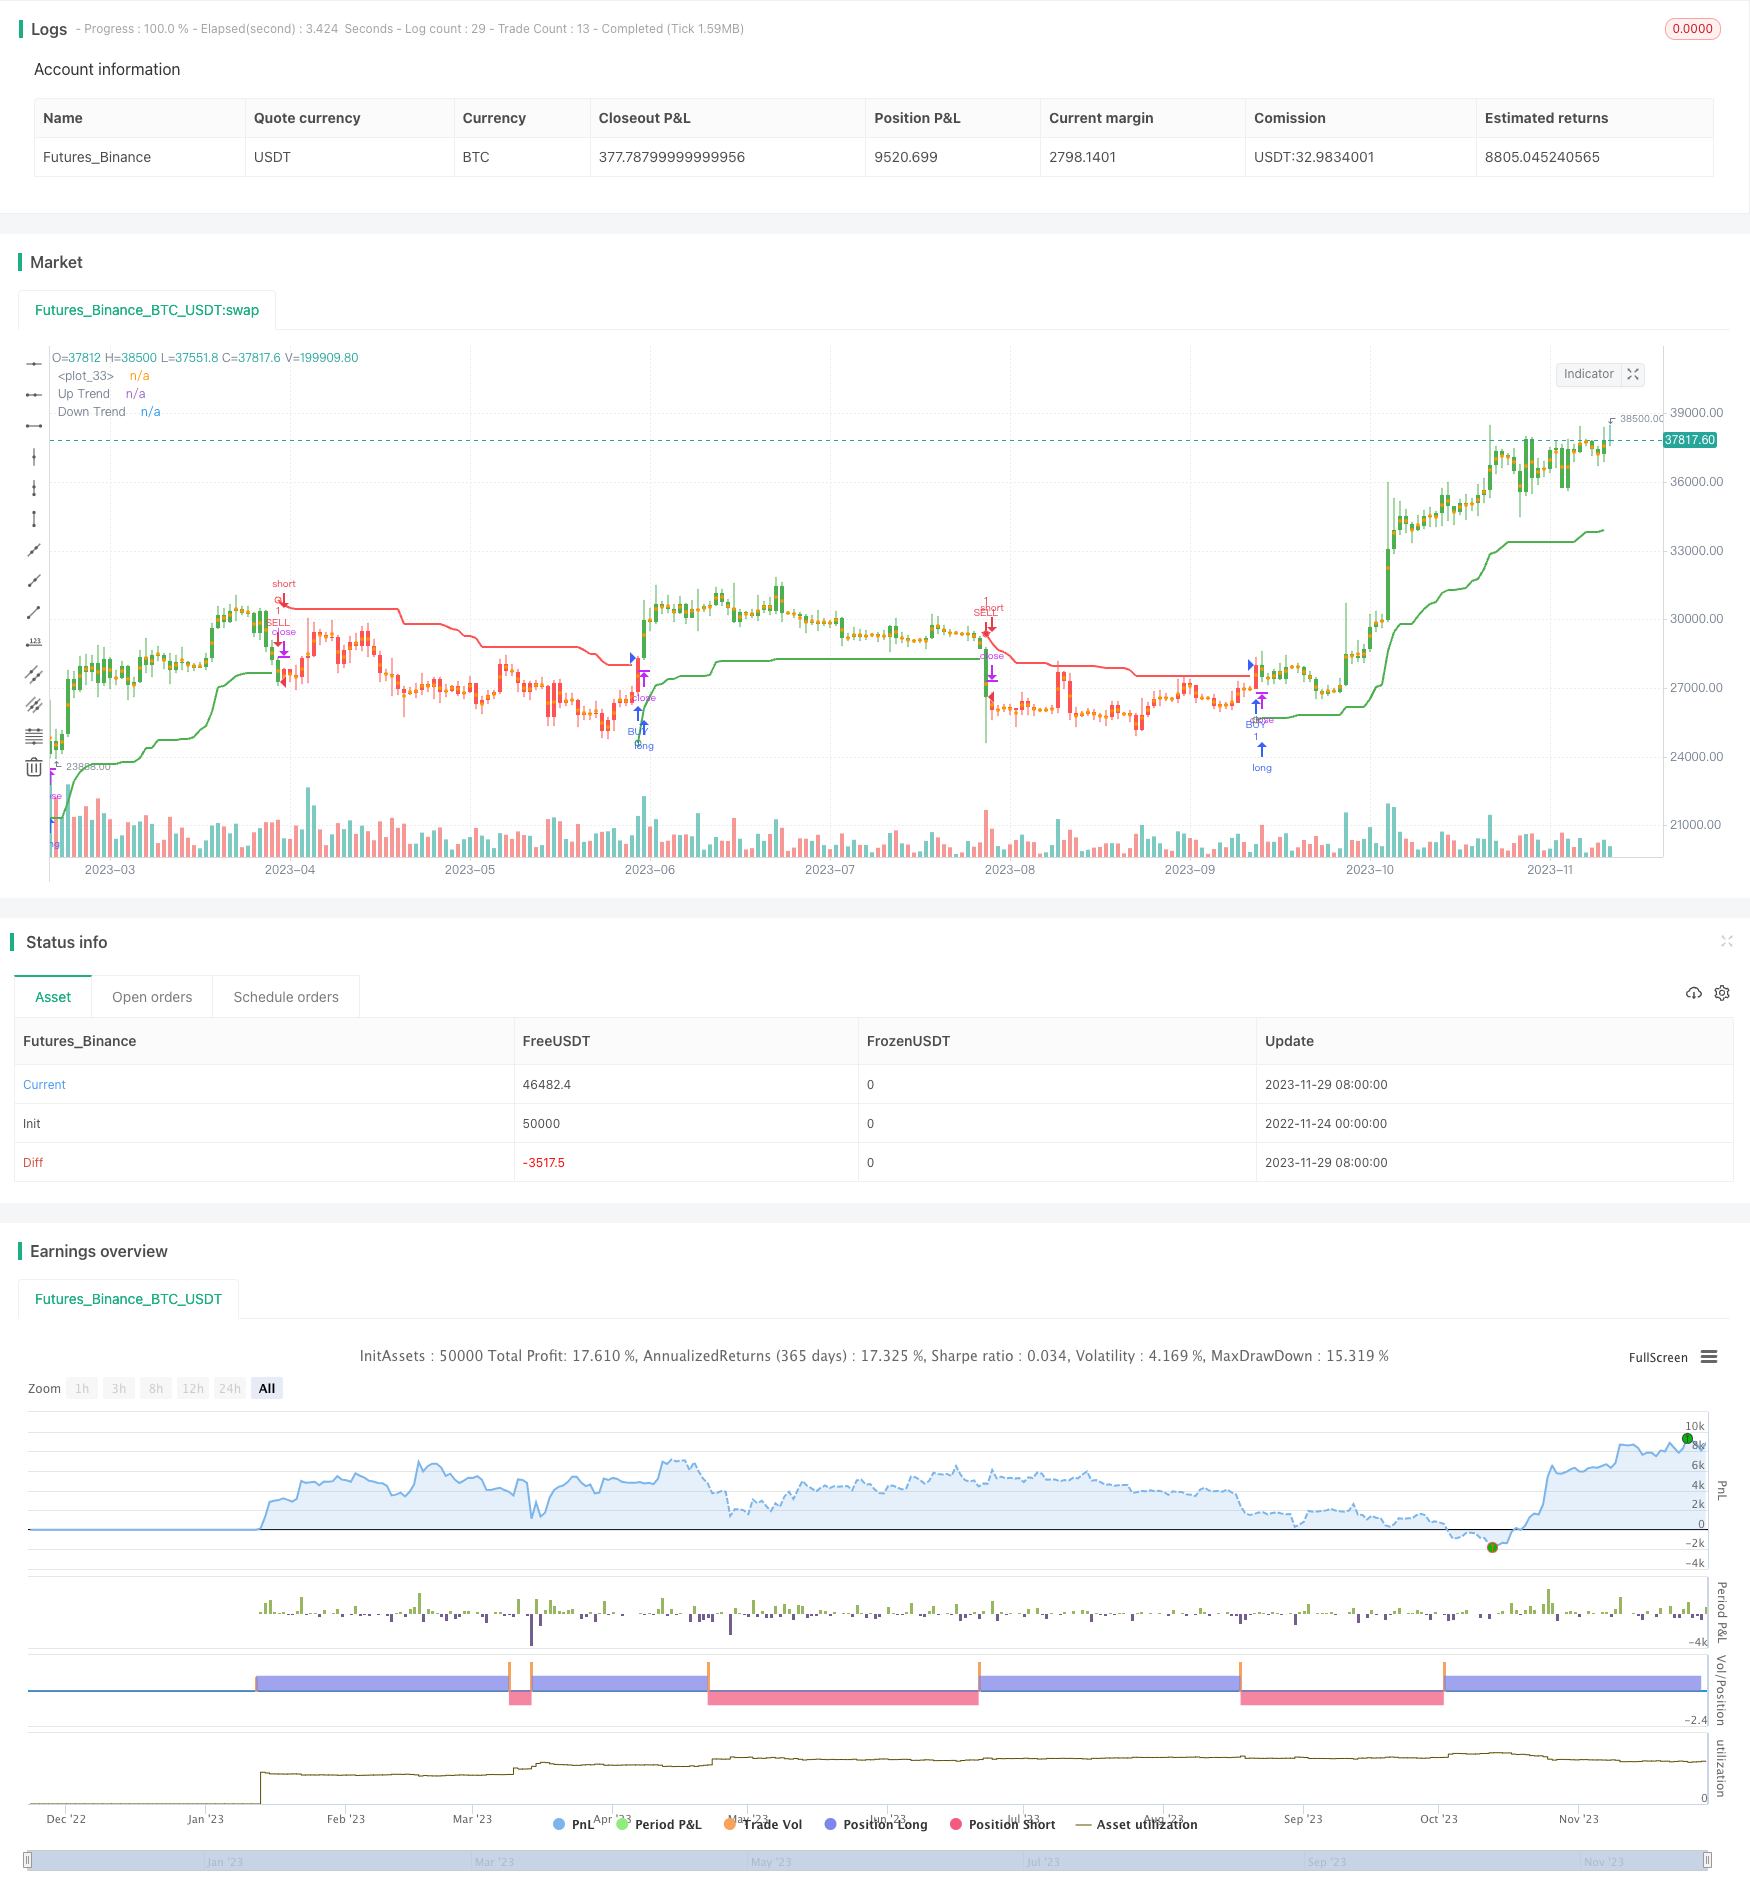
Overview
The Supertrend Bollinger Bands strategy is a common trailing stop indicator strategy based on the ATR (Average True Range). This strategy uses the Supertrend indicator to draw bullish and bearish trend channels on the chart and generates trading signals in combination with Bollinger Bands.
Strategy Logic
The strategy uses two main parameters - period and multiplier, with default values of 10 and 3 respectively, to calculate the Supertrend lines. The specific calculation formula is as follows:
Upper Line: Close - (Multiplier x ATR) Lower Line: Close + (Multiplier x ATR)
When the closing price is higher than the previous upper line, it is considered a bullish signal. When the closing price breaks below the previous lower line, it is considered a bearish signal.
The strategy also incorporates the Bollinger Bands indicator, using the middle band as the baseline, and the upper and lower bands located two standard deviations away from it. A buy signal is generated when the price breaks above the middle band from below. A sell signal is generated when the price breaks below the middle band from above.
Advantages
- Use ATR to dynamically calculate volatility, quickly capturing market trend changes
- Combining Bollinger Bands makes trading signals more reliable
- Customizable parameters suit different market environments
Risks
- Prone to false signals in sideways markets
- Improper parameter settings may cause over-trading
- Unable to determine trend reversal points, with certain lag
Optimization Directions
- Optimize ATR period parameter to reduce noise trades using filters
- Incorporate other indicators to determine support/resistance to reduce profit retracement probability
- Add position sizing rules to limit per trade loss
Summary
The Supertrend Bollinger Bands strategy integrates the strengths of multiple technical indicators and utilizes a dynamic trailing stop mechanism to effectively track market trends. This highly customizable strategy adapts well to different markets, making it a recommended breakout chasing strategy. However, risks like whipsaws and over-trading should be addressed by further optimizations to suit more complex market environments.
Parameters
| Name | Default | What it controls |
|---|---|---|
| v_input_1 | 10 | ATR Period |
| v_input_2_hl2 | 0 | Source: hl2 | high | low | open | close | hlc3 | hlcc4 | ohlc4 |
| v_input_3 | 3 | ATR Multiplier |
| v_input_4 | true | Change ATR Calculation Method ? |
| v_input_5 | false | Show Buy/Sell Signals ? |
| v_input_6 | true | Highlighter On/Off ? |
| v_input_7 | true | Bar Coloring On/Off ? |
| v_input_8 | 9 | From Month |
| v_input_9 | true | From Day |
| v_input_10 | 2018 | From Year |
| v_input_11 | true | To Month |
| v_input_12 | true | To Day |
| v_input_13 | 9999 | To Year |
Source Pine Script
/*backtest
start: 2022-11-24 00:00:00
end: 2023-11-30 00:00:00
period: 1d
basePeriod: 1h
exchanges: [{"eid":"Futures_Binance","currency":"BTC_USDT"}]
*/

// This source code is subject to the terms of the Mozilla Public License 2.0 at https://mozilla.org/MPL/2.0/
// © KivancOzbilgic


//@version=4
strategy("SuperTrend STRATEGY", overlay=true)
Periods = input(title="ATR Period", type=input.integer, defval=10)
src = input(hl2, title="Source")
Multiplier = input(title="ATR Multiplier", type=input.float, step=0.1, defval=3.0)
changeATR= input(title="Change ATR Calculation Method ?", type=input.bool, defval=true)
showsignals = input(title="Show Buy/Sell Signals ?", type=input.bool, defval=false)
highlighting = input(title="Highlighter On/Off ?", type=input.bool, defval=true)
barcoloring = input(title="Bar Coloring On/Off ?", type=input.bool, defval=true)
atr2 = sma(tr, Periods)
atr= changeATR ? atr(Periods) : atr2
up=src-(Multiplier*atr)
up1 = nz(up[1],up)
up := close[1] > up1 ? max(up,up1) : up
dn=src+(Multiplier*atr)
dn1 = nz(dn[1], dn)
dn := close[1] < dn1 ? min(dn, dn1) : dn
trend = 1
trend := nz(trend[1], trend)
trend := trend == -1 and close > dn1 ? 1 : trend == 1 and close < up1 ? -1 : trend
upPlot = plot(trend == 1 ? up : na, title="Up Trend", style=plot.style_linebr, linewidth=2, color=color.green)
buySignal = trend == 1 and trend[1] == -1
plotshape(buySignal ? up : na, title="UpTrend Begins", location=location.absolute, style=shape.circle, size=size.tiny, color=color.green, transp=0)
plotshape(buySignal and showsignals ? up : na, title="Buy", text="Buy", location=location.absolute, style=shape.labelup, size=size.tiny, color=color.green, textcolor=color.white, transp=0)
dnPlot = plot(trend == 1 ? na : dn, title="Down Trend", style=plot.style_linebr, linewidth=2, color=color.red)
sellSignal = trend == -1 and trend[1] == 1
plotshape(sellSignal ? dn : na, title="DownTrend Begins", location=location.absolute, style=shape.circle, size=size.tiny, color=color.red, transp=0)
plotshape(sellSignal and showsignals ? dn : na, title="Sell", text="Sell", location=location.absolute, style=shape.labeldown, size=size.tiny, color=color.red, textcolor=color.white, transp=0)
mPlot = plot(ohlc4, title="", style=plot.style_circles, linewidth=0)
longFillColor = highlighting ? (trend == 1 ? color.green : color.white) : color.white
shortFillColor = highlighting ? (trend == -1 ? color.red : color.white) : color.white
fill(mPlot, upPlot, title="UpTrend Highligter", color=longFillColor)
fill(mPlot, dnPlot, title="DownTrend Highligter", color=shortFillColor)
FromMonth = input(defval = 9, title = "From Month", minval = 1, maxval = 12)
FromDay   = input(defval = 1, title = "From Day", minval = 1, maxval = 31)
FromYear  = input(defval = 2018, title = "From Year", minval = 999)
ToMonth   = input(defval = 1, title = "To Month", minval = 1, maxval = 12)
ToDay     = input(defval = 1, title = "To Day", minval = 1, maxval = 31)
ToYear    = input(defval = 9999, title = "To Year", minval = 999)
start     = timestamp(FromYear, FromMonth, FromDay, 00, 00)
finish    = timestamp(ToYear, ToMonth, ToDay, 23, 59)
window()  => time >= start and time <= finish ? true : false
longCondition = buySignal
if (longCondition)
    strategy.entry("BUY", strategy.long)
shortCondition = sellSignal
if (shortCondition)
    strategy.entry("SELL", strategy.short)
buy1= barssince(buySignal)
sell1 = barssince(sellSignal)
color1 = buy1[1] < sell1[1] ? color.green : buy1[1] > sell1[1] ? color.red : na
barcolor(barcoloring ? color1 : na)Published by ChaoZhang on the FMZ strategy square · last modified 2023-12-01. Collected in the Quant Trading Vault. Unvalidated research: re-test with your own data and costs before trusting it.
Build this with AgenKit
A spec is not a trading system. Paste this into your coding agent and AgenKit runs a specialist team — architecture, test-first build, risk gates, review — with paper trading on by default.
/agenkit build a production-grade trading bot with a backtest engine, risk controls and paper trading by default from strategies/Supertrend-Bollinger-Bands-Strategy.md- npx agenkit install engineering-kit in your project
- Paste the command into your agent and approve each phase
- Get tests, backtest, risk controls and a paper-trading switch
Understand it first
Before you run this, read the lesson behind the idea and how to backtest it honestly. Specs like this one are the survivors of an unknown number of trials; deflate their results accordingly.
Related specs
- Multi Indicator Dynamic Trend Following Strategy Based on EMA and SMAPine Script · Trend following · 1d
- Trend Following Strategy Based on PMax IndicatorPine Script · Trend following · 5m
- Trend Tracking and Short term Trading Strategy Based on ADX IndicatorPine Script · Trend following · 1d
- Triple Supertrend Ichimoku Cloud Quantitative Trading StrategyPine Script · Trend following · 1d
- Going with the Trend Moving Average Crossover StrategyPine Script · Trend following · 1d
- Multi Kernel Regression Dynamic Trend Trading StrategyPine Script · Trend following · 1h