Strategy vault / Trend following
Support and Resistance Trend Tracking Strategy
This strategy utilizes three technical indicators - support, resistance and trendlines - to automate entries and stop losses. It first identifies key support and resistance levels, then combines trend direction to…
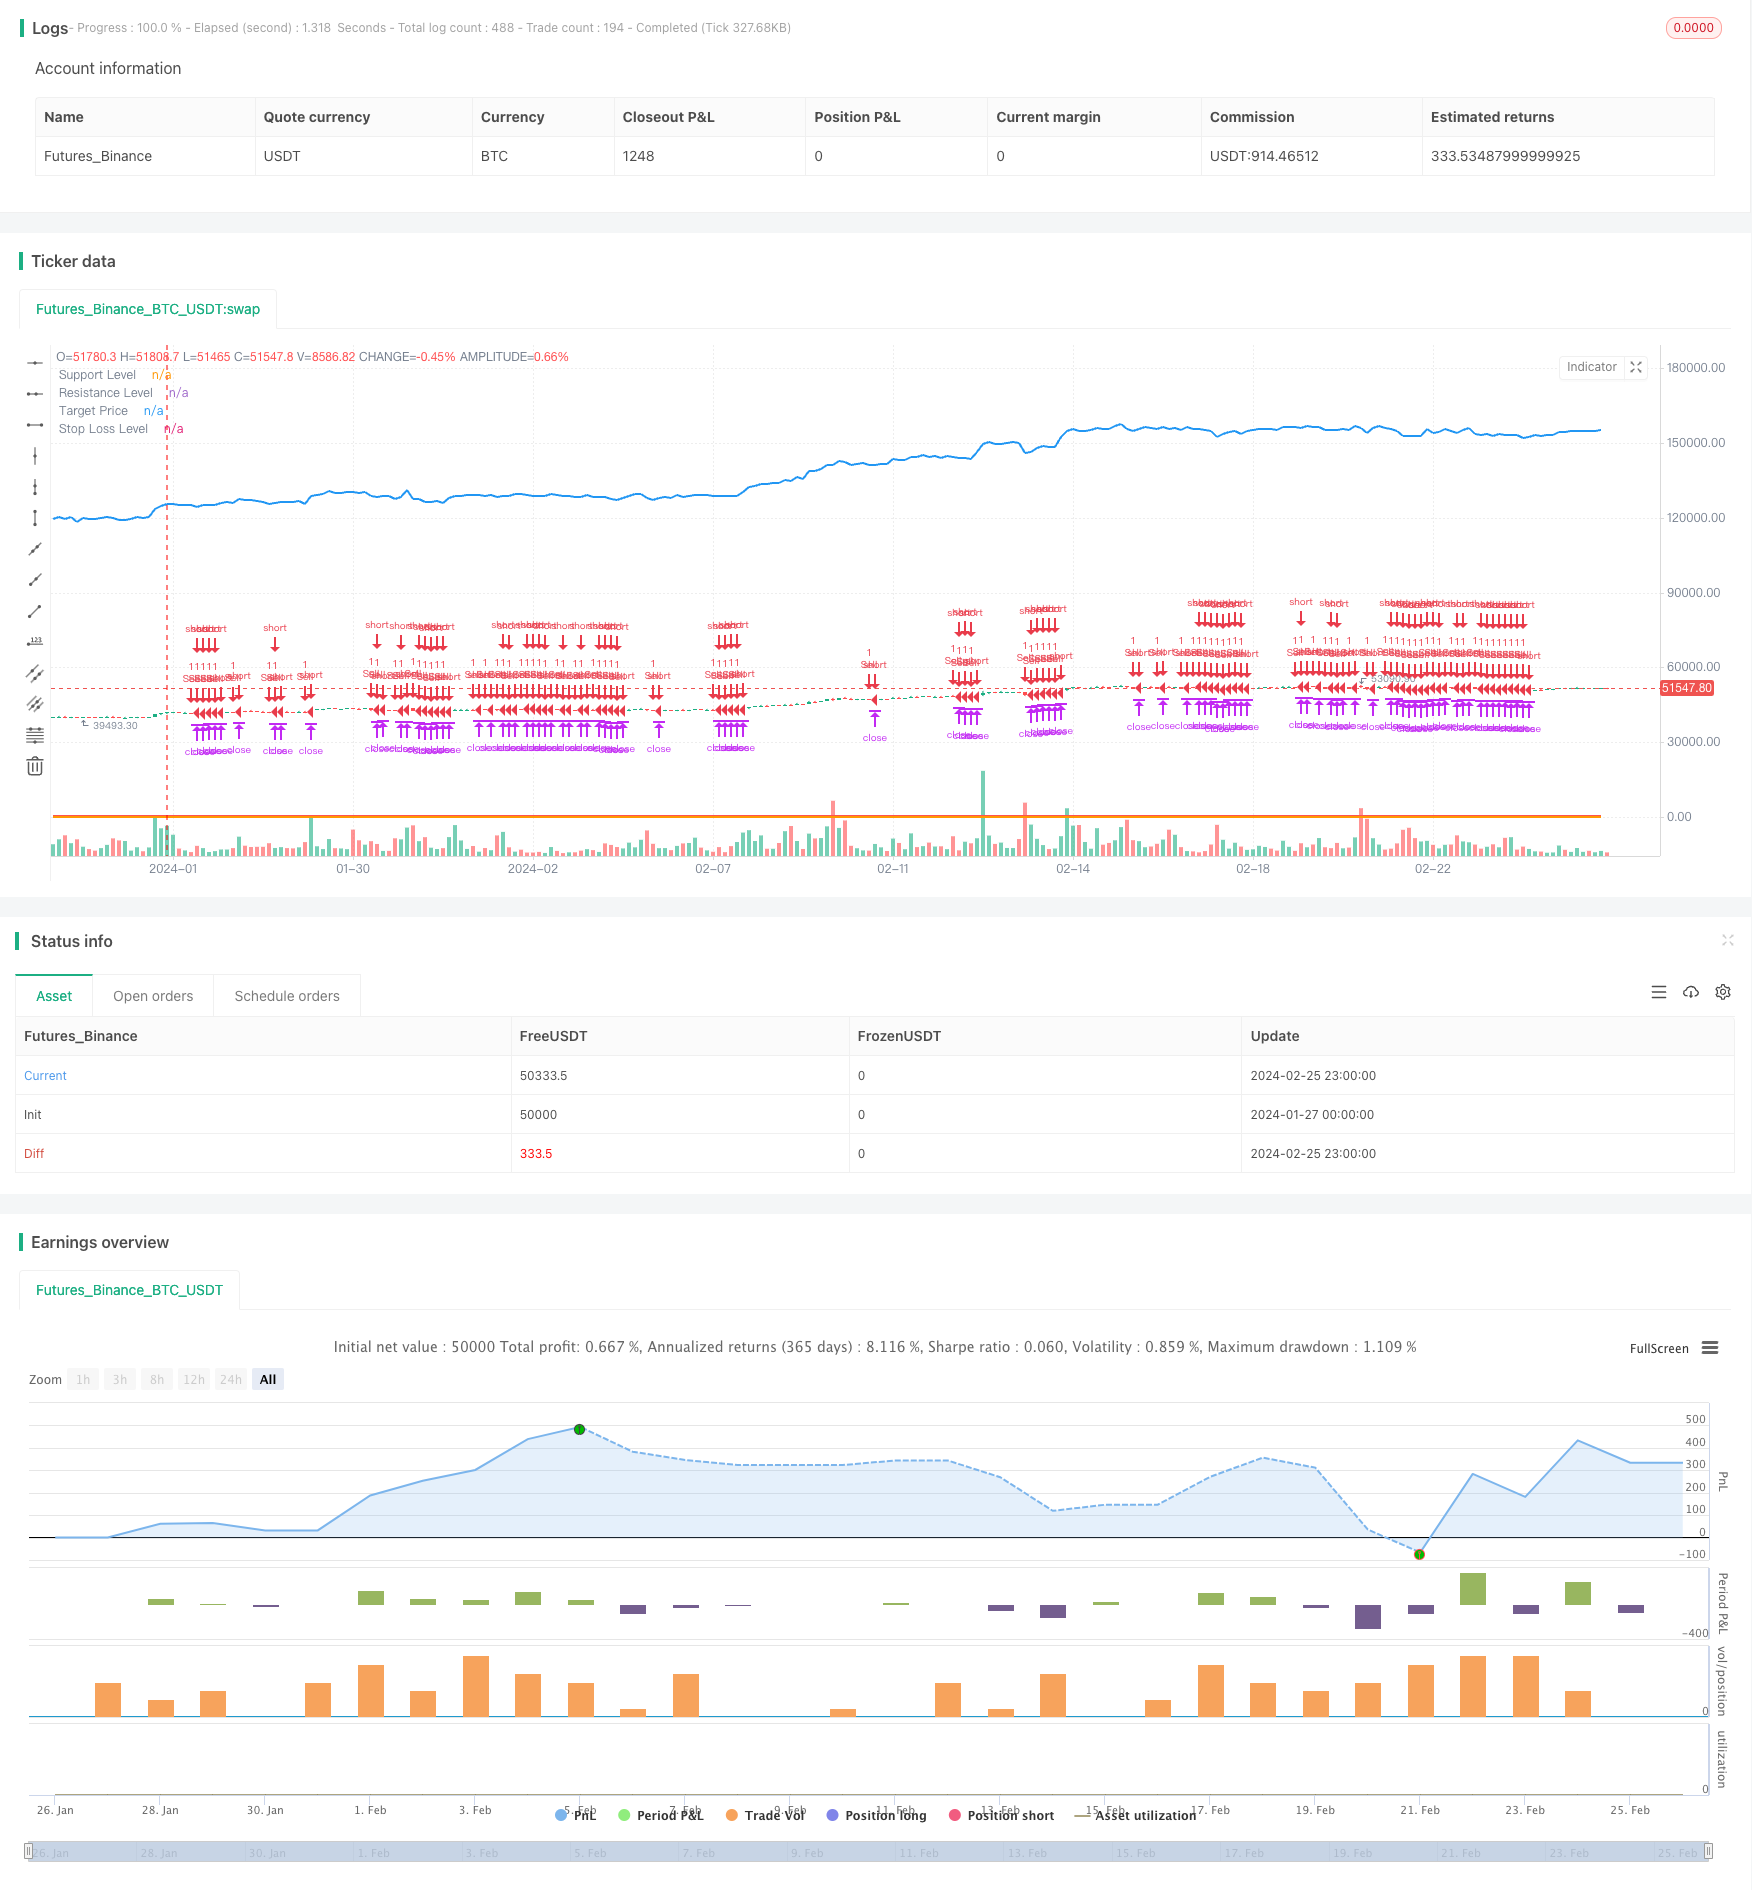
Overview
This strategy utilizes three technical indicators - support, resistance and trendlines - to automate entries and stop losses. It first identifies key support and resistance levels, then combines trend direction to determine entry timing.
Strategy Logic
- Identify key support and resistance levels.
- Use trendlines to determine market trend direction. An uptrend is defined when price is higher than previous close, otherwise it's a downtrend.
- When price approaches support level and there is an uptrend, a buy signal is triggered.
- When price approaches resistance level and there is a downtrend, a sell signal is triggered.
- Take profit target is calculated based on risk-reward ratio, stop loss is set near support level.
- Trailing stop loss can be used to lock in profits.
Advantage Analysis
- Fully utilizes the power of support, resistance and trend - three strong technical indicators.
- Automated entry timing eliminates subjective errors.
- Controllable risk with stop loss near key support levels.
- Optional trailing stop loss to avoid giving back profits.
Risk Analysis
- Failed breakout risk - price may retest the broken support or resistance level after initial breakout.
- Trend misjudgement risk - using trendlines alone may result in inaccurate trend bias.
- Stop loss being taken out risk - stop loss can still be hit by volatile price swings despite close distance from support.
Solutions:
- Allow wider range for support/resistance validation.
- Employ multiple indicators to confirm trend bias.
- Adopt range-based stop loss or timely manual intervention.
Optimization Directions
- Add more indicators to confirm entry signals, e.g. volume-based indicators, moving averages etc. This can improve accuracy.
- Optimize support, resistance and stop loss levels by testing different parameters.
- Try machine learning methods to auto-optimize parameters.
Conclusion
This strategy combines the power of multiple technical tools. With proper parameter tuning, it can achieve good risk-adjusted returns. The key is to optimize the parameters and entry sequence. Overall the strategy framework is sound and has lots of potential for improvements.\
Parameters
| Name | Default | What it controls |
|---|---|---|
| v_input_1 | 100 | Support Level |
| v_input_2 | 200 | Resistance Level |
| v_input_3 | 2 | Risk-Reward Ratio |
| v_input_4 | true | Use Trailing Stop Loss |
Source Pine Script
/*backtest
start: 2024-01-27 00:00:00
end: 2024-02-26 00:00:00
period: 3h
basePeriod: 15m
exchanges: [{"eid":"Futures_Binance","currency":"BTC_USDT"}]
*/

//@version=5
strategy("Support Resistance Trend Strategy", overlay=true)

// Input parameters
supportLevel = input(100, title="Support Level")
resistanceLevel = input(200, title="Resistance Level")
riskRewardRatio = input(2, title="Risk-Reward Ratio")
trailStopLoss = input(true, title="Use Trailing Stop Loss")

// Calculate trend direction based on trend lines
trendUp = close > request.security(syminfo.tickerid, "D", close[1])
trendDown = close < request.security(syminfo.tickerid, "D", close[1])

// Buy signal condition
buySignal = close < supportLevel and trendUp

// Sell signal condition
sellSignal = close > resistanceLevel and trendDown

// Entry point and exit conditions
strategy.entry("Buy", strategy.long, when=buySignal)
strategy.entry("Sell", strategy.short, when=sellSignal)

// Calculate targets and stop-loss levels
targetPrice = close + (close - supportLevel) * riskRewardRatio
stopLossLevel = supportLevel

// Plot support and resistance levels
plot(supportLevel, color=color.green, linewidth=2, title="Support Level")
plot(resistanceLevel, color=color.red, linewidth=2, title="Resistance Level")

// Plot targets and stop-loss levels
plot(targetPrice, color=color.blue, linewidth=2, title="Target Price")
plot(stopLossLevel, color=color.orange, linewidth=2, title="Stop Loss Level")

// Trailing stop-loss
strategy.exit("Take Profit/Stop Loss", from_entry="Buy", loss=stopLossLevel, profit=targetPrice)
strategy.exit("Take Profit/Stop Loss", from_entry="Sell", loss=targetPrice, profit=stopLossLevel)

// Plot trail stop loss
if (trailStopLoss)
    strategy.exit("Trailing Stop Loss", from_entry="Buy", loss=stopLossLevel)
    strategy.exit("Trailing Stop Loss", from_entry="Sell", loss=stopLossLevel)
Published by ChaoZhang on the FMZ strategy square · last modified 2024-02-27. Collected in the Quant Trading Vault. Unvalidated research: re-test with your own data and costs before trusting it.
Build this with AgenKit
A spec is not a trading system. Paste this into your coding agent and AgenKit runs a specialist team — architecture, test-first build, risk gates, review — with paper trading on by default.
/agenkit build a production-grade trading bot with a backtest engine, risk controls and paper trading by default from strategies/Support-and-Resistance-Trend-Tracking-Strategy.md- npx agenkit install engineering-kit in your project
- Paste the command into your agent and approve each phase
- Get tests, backtest, risk controls and a paper-trading switch
Understand it first
Before you run this, read the lesson behind the idea and how to backtest it honestly. Specs like this one are the survivors of an unknown number of trials; deflate their results accordingly.
Related specs
- Adaptive Bollinger Bands Trend Tracking StrategyPine Script · Trend following · 1h
- Automated Fibonacci Retracement Trading System StrategyPine Script · Trend following · 1d
- Bollinger Bands Precise Crossover Quantitative StrategyPine Script · Trend following · 1h
- Comprehensive Trading System Combining SMA Crossover Strategy with Fair Value Gap PullbackPine Script · Trend following · 1d
- Dual EMA Crossover StrategyPine Script · Trend following · 1d
- Dual Hull Moving Average Trading StrategyPine Script · Trend following · 1d