Support Resistance breakout
Strategy based on longing resistance breakout and shorting support breakout. It defines highs and lows using fractal with 2 bars for confirming high/lows. So it has 2 bars lag. It calculates the difference between…
Strategy based on longing resistance breakout and shorting support breakout. It defines highs and lows using fractal with 2 bars for confirming high/lows. So it has 2 bars lag. It calculates the difference between sma with defined length (21 by default) of highs and of lows and uses it as alt SR level. This idea I took from synapticEx's indicator Nebula-Advanced-Dynamic-Support-Resistance. Position enter is the breakout of SR, defined by fractals. Position exit is: bar change in opposite to position direction > difference is sma of highs and of lows.
backtest
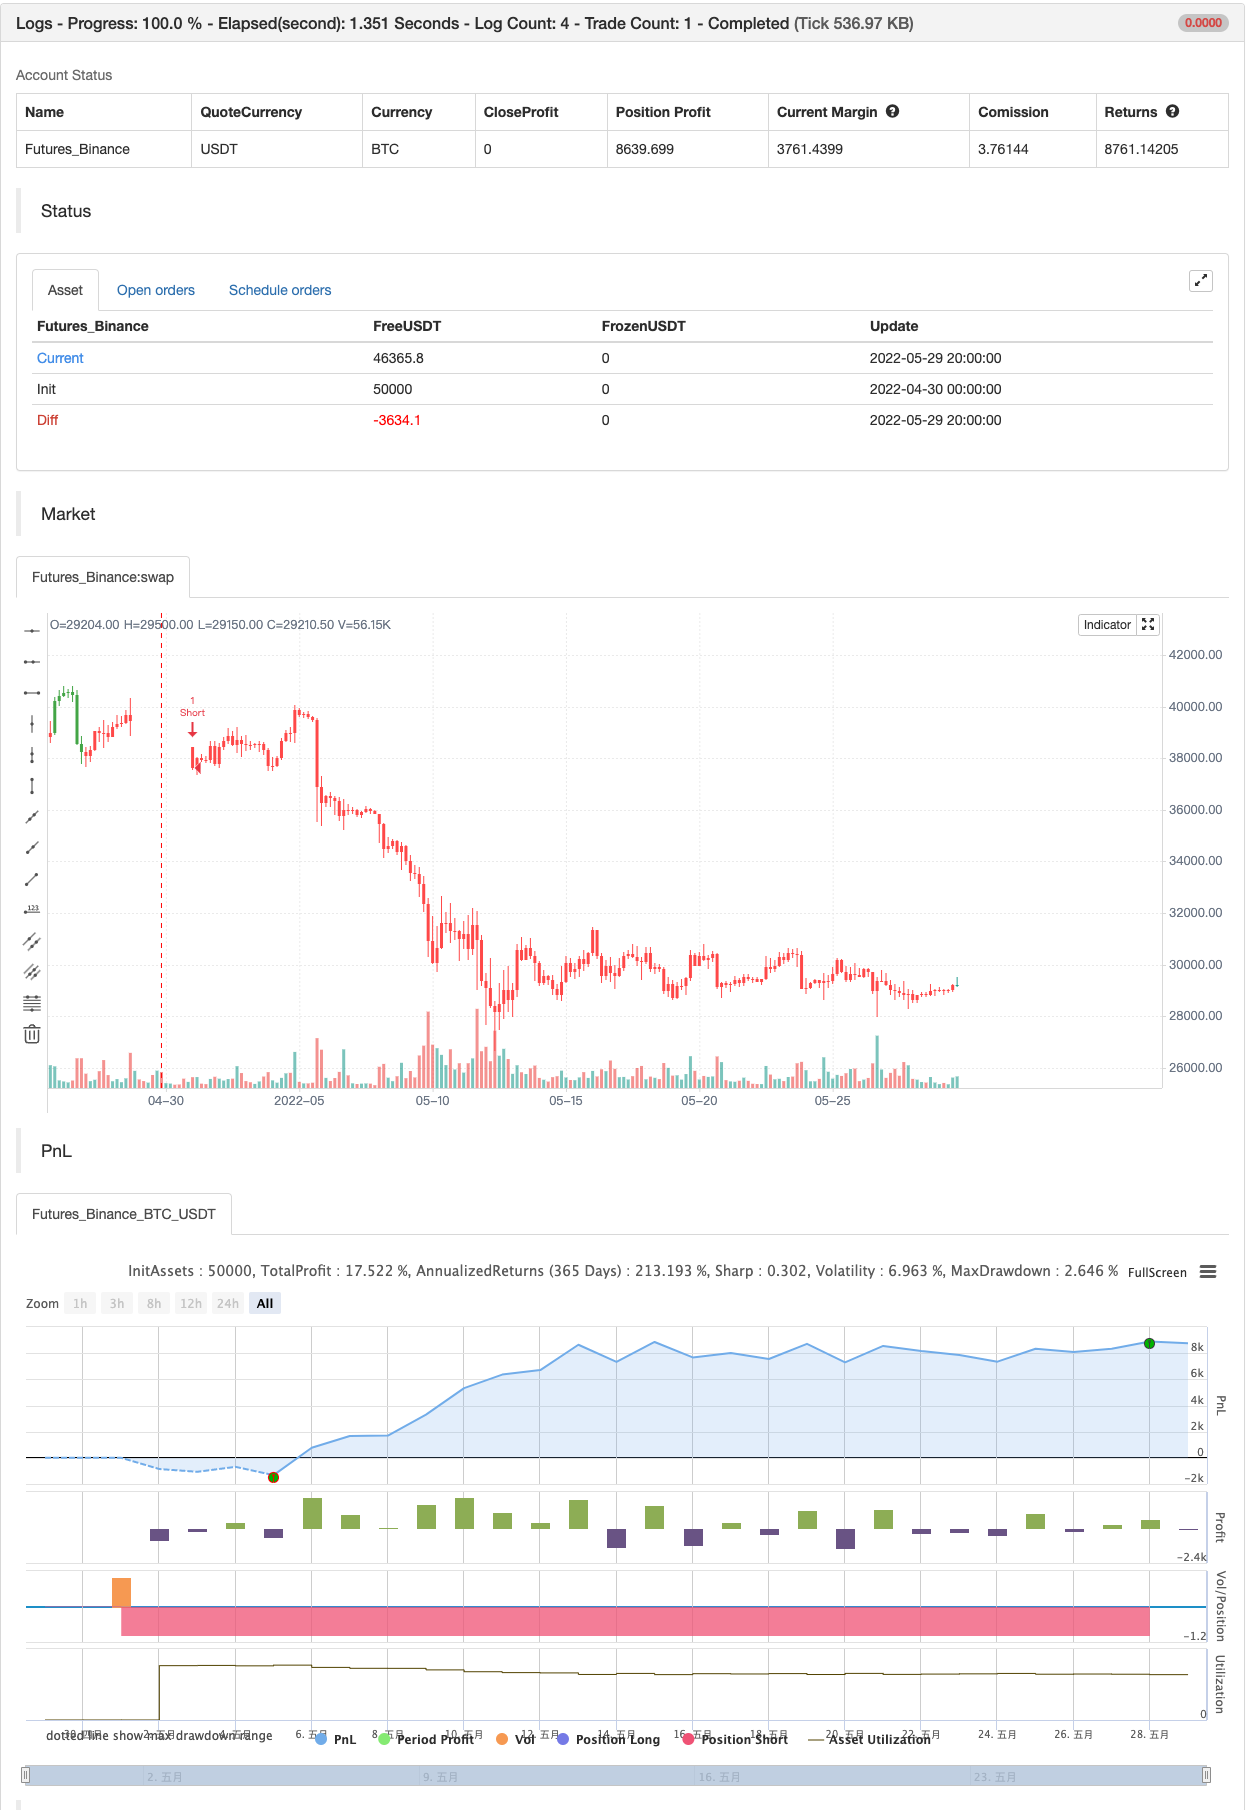
Parameters
| Name | Default | What it controls |
|---|---|---|
| v_input_1 | 21 | SR lookbak length |
Source Pine Script
/*backtest
start: 2022-04-30 00:00:00
end: 2022-05-29 23:59:00
period: 4h
basePeriod: 15m
exchanges: [{"eid":"Futures_Binance","currency":"BTC_USDT"}]
*/

//@version=4
strategy("SR TREND STRATEGY", shorttitle="SR TREND", overlay=true, calc_on_order_fills=true)
//based on by synapticEx SR indicator https://www.tradingview.com/script/O0F675Kv-Nebula-Advanced-Dynamic-Support-Resistance/
length = input(title="SR lookbak length", type=input.integer, defval=21)
h = bar_index>5 and high[5]<high[4] and high[4]<high[3] and high[3]>high[2] and high[2]>high[1] ? 1 : 0
l = bar_index>5 and low[5]>low[4]   and low[4]>low[3]   and low[3]<low[2]   and low[2]<low[1]   ? 1 : 0
ln = sum(l, length)
hn = sum(h, length)
hval =  h>0 ? high[3] : 0
lval =  l>0 ? low[3]  : 0
lsum = sum(lval, length)
hsum = sum(hval, length)
r = ln>0 and hn>0 ? abs((hsum/hn) - (lsum/ln)): 0
float lvalc = na
float lvalr = na
float hvalc = na
float hvalr = na
lvalc := lval and r>0 ? lval   : lvalc[1]
lvalr := lval and r>0 ? lval+r : lvalr[1]
hvalc := hval and r>0 ? hval   : hvalc[1]
hvalr := hval and r>0 ? hval-r : hvalr[1]
int trend=0
trend:=close > lvalr and close > hvalr ? 1 : close < lvalr and close < hvalr ? -1 : trend[1]
strategy.close("Long", when=trend==-1)
strategy.close("Short", when=trend==1)
strategy.entry("Long", strategy.long, when=trend==1 and close>hvalc)
strategy.entry("Short", strategy.short, when=trend==-1 and close<lvalc)
int long=0
int short=0
long:= trend==1 and close>hvalc ? 1 : trend==-1 ? -1 : long[1]
short:= trend==-1 and close<lvalc ? 1 : trend==1 ? -1 : short[1]
barcolor(long>0? color.green : short>0? color.red : trend>0? color.white: trend<0 ? color.orange : color.blue)
Published by ChaoZhang on the FMZ strategy square · last modified 2022-05-31. Collected in the Quant Trading Vault. Unvalidated research: re-test with your own data and costs before trusting it.
Build this with AgenKit
A spec is not a trading system. Paste this into your coding agent and AgenKit runs a specialist team — architecture, test-first build, risk gates, review — with paper trading on by default.
/agenkit build a production-grade trading bot with a backtest engine, risk controls and paper trading by default from strategies/Support-Resistance-breakout.md- npx agenkit install engineering-kit in your project
- Paste the command into your agent and approve each phase
- Get tests, backtest, risk controls and a paper-trading switch
Understand it first
Before you run this, read the lesson behind the idea and how to backtest it honestly. Specs like this one are the survivors of an unknown number of trials; deflate their results accordingly.
Related specs
- 5 Day Moving Average Channel Breakout Strategy Combined With Mileage ConceptPine Script · Breakout · 1d
- Adaptive Bollinger Breakout with Moving Average Quantitative Strategy SystemPine Script · Breakout · 1h
- Adaptive Multi Period Trading Strategy Based on Wave Trend Momentum BreakoutPine Script · Breakout · 2h
- Adaptive Trading Strategy Based on ADX IndicatorPine Script · Breakout · 1d
- Average Line Breakthrough StrategyPine Script · Breakout · 1d
- BB Breakout StrategyPine Script · Breakout · 1d