Swing Trading Strategy Based on Momentum
The Swing Trading Strategy Based on Momentum, Oscillation and Moving Average Crossover is a strategy that uses momentum indicators, oscillators and moving average crossovers to generate buy and sell signals. It can…
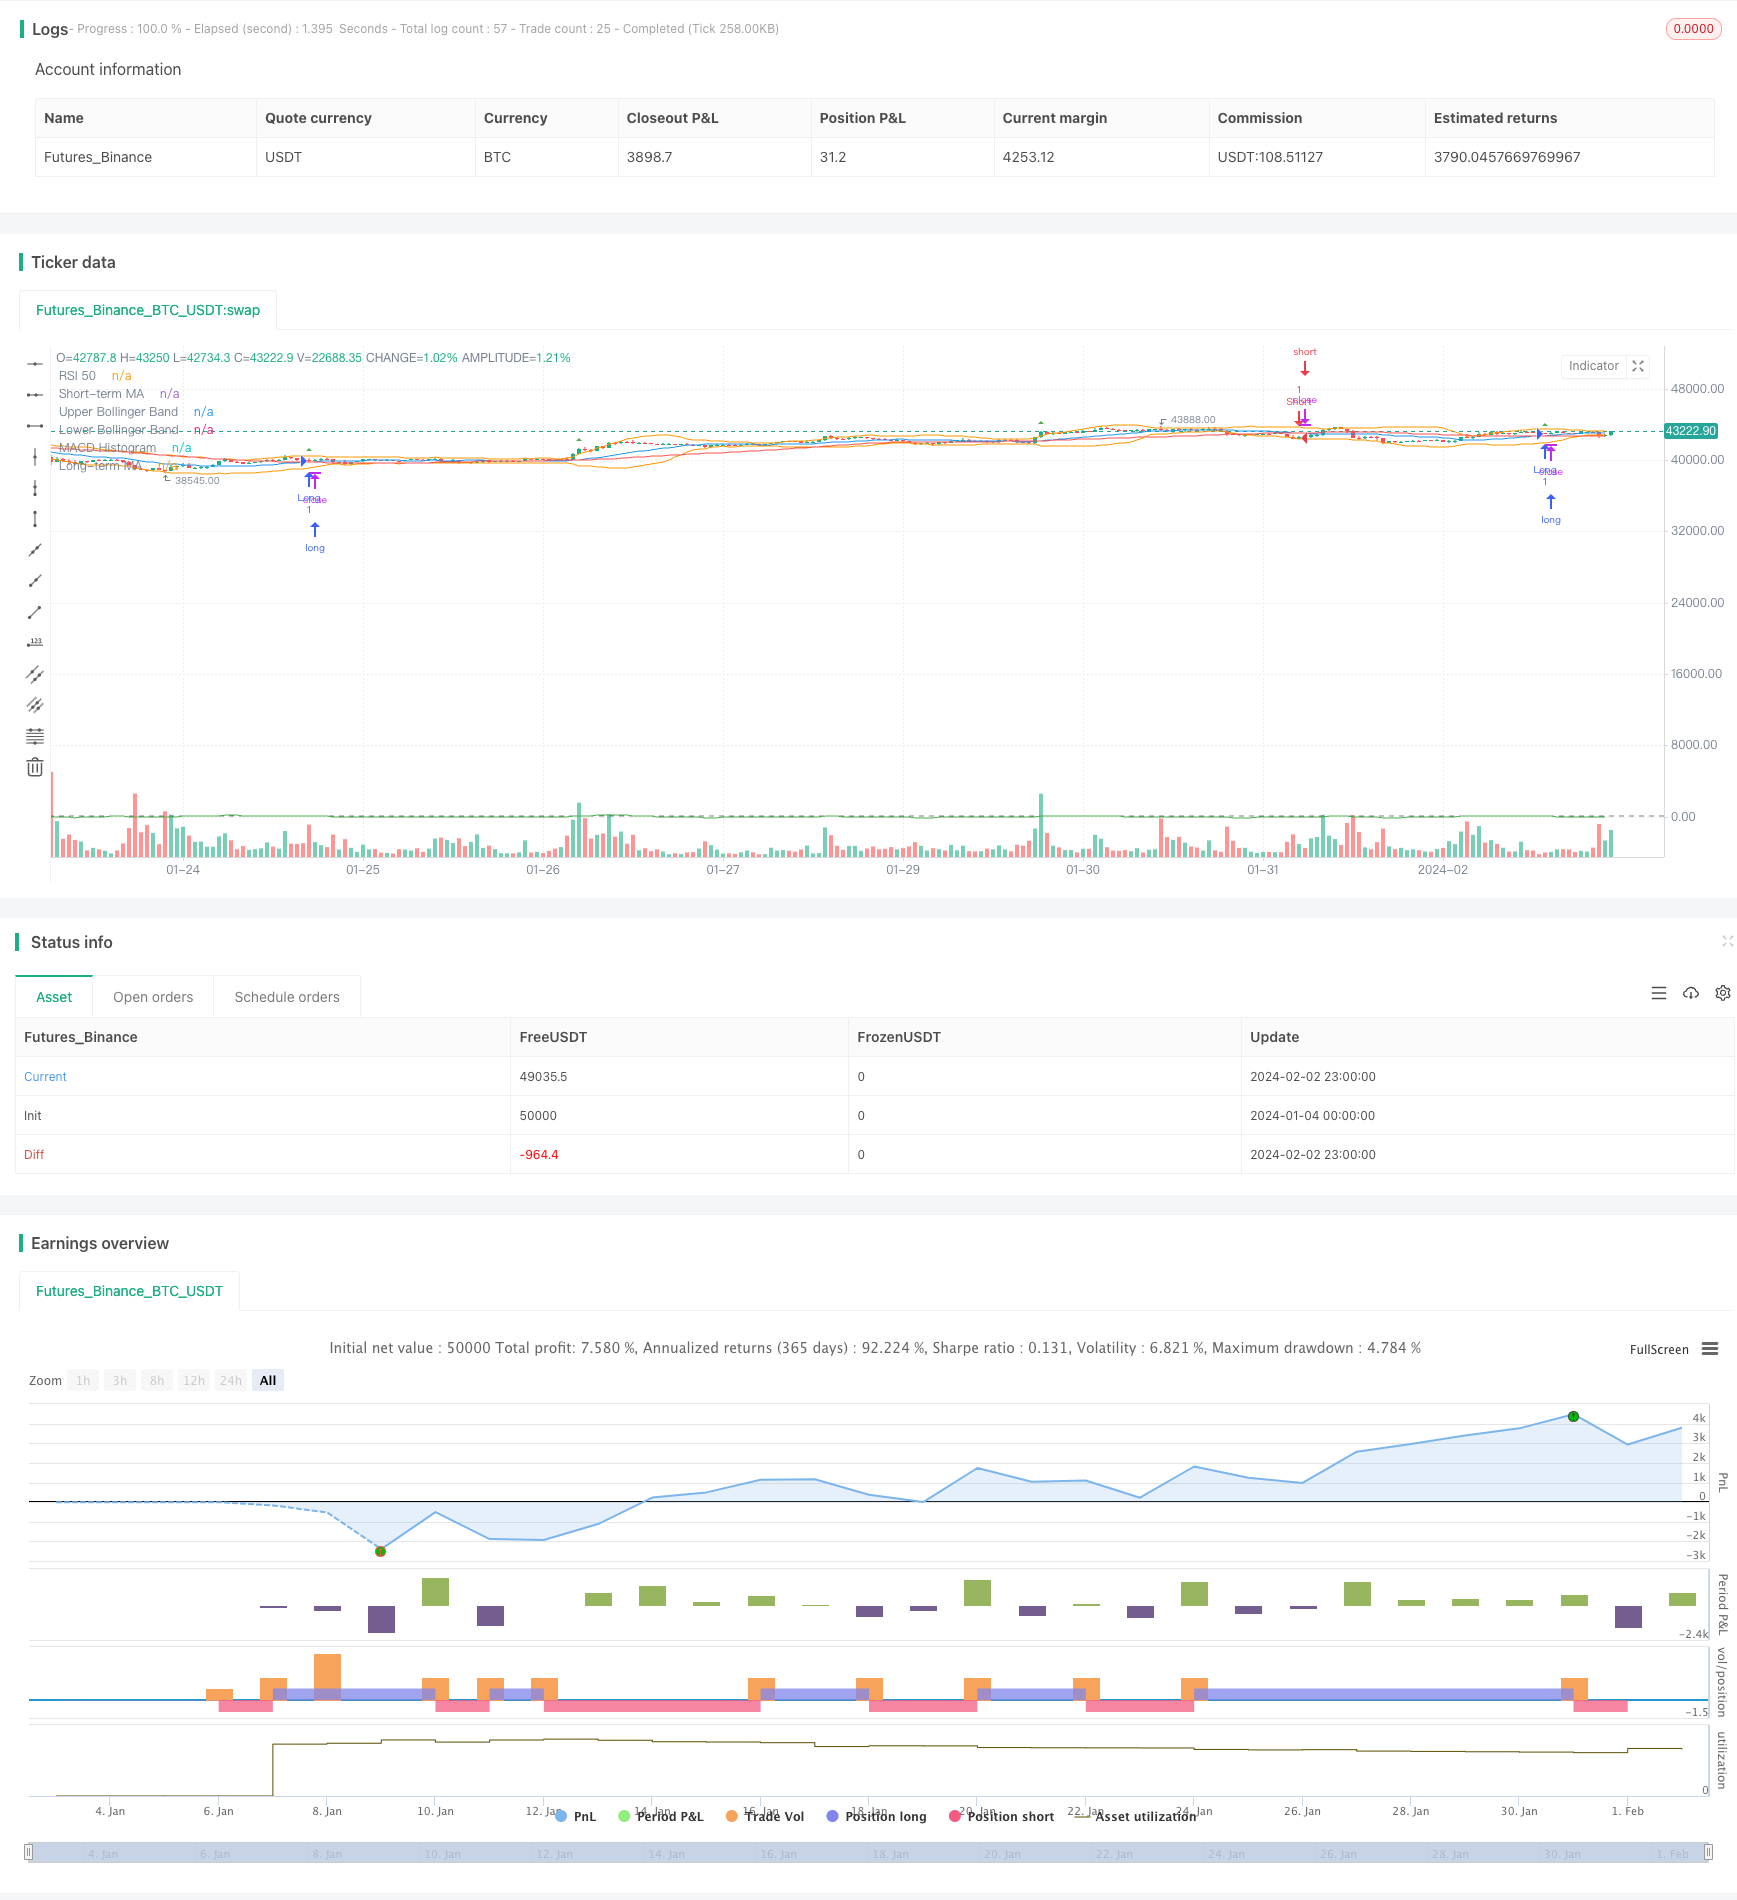
Overview
The Swing Trading Strategy Based on Momentum, Oscillation and Moving Average Crossover is a strategy that uses momentum indicators, oscillators and moving average crossovers to generate buy and sell signals. It can be used for intraday and swing trading in commodities, forex and other markets.
Strategy Logic
The strategy utilizes four technical indicators - moving averages, Relative Strength Index (RSI), MACD and Bollinger Bands - to identify entry and exit signals. Specifically:
Go long when the short-term moving average crosses above the long-term moving average, and RSI is greater than 50; Go short when the short-term moving average crosses below the long-term moving average, and RSI is less than 50.
This combination takes advantage of golden crosses and death crosses of moving averages to determine the trend, while adding RSI to avoid the risk of trend reversal. MACD's role is to determine specific entry points, and Bollinger Bands set the stop loss levels.
Advantage Analysis
The biggest advantage of this strategy is that the combination of indicators is appropriate to effectively utilize the complementary nature of trend and oscillation indicators. Specifically:
- Moving averages determine the main trend direction and trading signal points
- RSI helps avoid the risk of trend reversal
- MACD assists in determining specific entry points
- Bollinger Bands set stop loss levels
Through this combination, the advantages of each indicator can be fully utilized while complementing each other's deficiencies.
Risk Analysis
The main risks of this strategy are:
- Trend reversal risk. When the market reverses rapidly, moving averages and RSI cannot give timely signals, which may lead to greater losses.
- False signals in range-bound markets. When the market oscillates for a long time, moving averages and RSI will frequently generate buy and sell signals, making it easy to be trapped.
- Inappropriate parameter settings. If the parameters are not set appropriately, the filtering effect will be poor and wrong signals are prone to occur.
To control these risks, methods like parameter optimization, setting stop loss/take profit, reasonably controlling position size can be adopted.
Optimization Directions
The strategy can be optimized in the following aspects:
- Test different market and time frame parameter combinations to find the optimal parameters.
- Add volatility indicators to better deal with oscillating markets.
- Add trading volume indicators to filter out false breakouts.
- Optimize parameters in real time with deep learning algorithms to make the system smarter.
- Optimize stop loss/take profit logic for better profitability and smaller losses.
Conclusion
The Swing Trading Strategy Based on Momentum, Oscillation and Moving Average Crossover identifies trading signals by utilizing the complementary advantages of trend and oscillator indicators. With proper parameter optimization and risk management, it can achieve good performance. The strategy can be further improved by optimizing parameters, stop loss logic etc. for even better results.
Parameters
| Name | Default | What it controls |
|---|---|---|
| v_input_1 | 20 | Short-term MA |
| v_input_2 | 50 | Long-term MA |
| v_input_3 | 14 | RSI Length |
| v_input_4 | 12 | MACD Short |
| v_input_5 | 26 | MACD Long |
| v_input_6 | 9 | MACD Signal |
| v_input_7 | 20 | Bollinger Bands Length |
| v_input_8 | 2 | Bollinger Bands Multiplier |
Source Pine Script
//@version=5
strategy("Swing Trading Strategy", overlay=true)

// Input for moving averages
shortMA = input(20, title="Short-term MA")
longMA = input(50, title="Long-term MA")

// Input for RSI
rsiLength = input(14, title="RSI Length")

// Input for MACD
macdShort = input(12, title="MACD Short")
macdLong = input(26, title="MACD Long")
macdSignal = input(9, title="MACD Signal")

// Input for Bollinger Bands
bbLength = input(20, title="Bollinger Bands Length")
bbMultiplier = input(2, title="Bollinger Bands Multiplier")

// Calculate moving averages
shortTermMA = ta.sma(close, shortMA)
longTermMA = ta.sma(close, longMA)

// Calculate RSI
rsiValue = ta.rsi(close, rsiLength)

// Calculate MACD
[macdLine, signalLine, _] = ta.macd(close, macdShort, macdLong, macdSignal)

// Calculate Bollinger Bands
basis = ta.sma(close, bbLength)
upperBand = basis + bbMultiplier * ta.stdev(close, bbLength)
lowerBand = basis - bbMultiplier * ta.stdev(close, bbLength)

// Plot moving averages
plot(shortTermMA, color=color.blue, title="Short-term MA")
plot(longTermMA, color=color.red, title="Long-term MA")

// Plot RSI
hline(50, "RSI 50", color=color.gray)

// Plot MACD
plot(macdLine - signalLine, color=color.green, title="MACD Histogram")

// Plot Bollinger Bands
plot(upperBand, color=color.orange, title="Upper Bollinger Band")
plot(lowerBand, color=color.orange, title="Lower Bollinger Band")

// Strategy conditions
longCondition = ta.crossover(shortTermMA, longTermMA) and rsiValue > 50
shortCondition = ta.crossunder(shortTermMA, longTermMA) and rsiValue < 50

// Execute trades
strategy.entry("Long", strategy.long, when=longCondition)
strategy.entry("Short", strategy.short, when=shortCondition)

// Plot trade signals on the chart
plotshape(series=longCondition, title="Long Signal", color=color.green, style=shape.triangleup, size=size.small)
plotshape(series=shortCondition, title="Short Signal", color=color.red, style=shape.triangledown, size=size.small)
Published by ChaoZhang on the FMZ strategy square · last modified 2024-02-04. Collected in the Quant Trading Vault. Unvalidated research: re-test with your own data and costs before trusting it.
Build this with AgenKit
A spec is not a trading system. Paste this into your coding agent and AgenKit runs a specialist team — architecture, test-first build, risk gates, review — with paper trading on by default.
/agenkit build a production-grade trading bot with a backtest engine, risk controls and paper trading by default from strategies/Swing-Trading-Strategy-Based-on-Momentum.md- npx agenkit install engineering-kit in your project
- Paste the command into your agent and approve each phase
- Get tests, backtest, risk controls and a paper-trading switch
Understand it first
Before you run this, read the lesson behind the idea and how to backtest it honestly. Specs like this one are the survivors of an unknown number of trials; deflate their results accordingly.
Related specs
- Momentum Indicator Aggregation Trading StrategyPine Script · Momentum · 1h
- Multi Indicator Trend Momentum Trading Strategy An Optimized Quantitative Trading System Based on Bollinger Bands Fibonacci and ATRPine Script · Momentum · 1h
- Multi Trend Momentum Crossover Strategy with Volatility Optimization SystemPine Script · Momentum · 1d
- Momentum Oscillation Crossing Bollinger Bands with Moving Average StrategyPine Script · Momentum · 1d
- Multi factor Momentum Rotation StrategyPine Script · Momentum · 2h
- Multi Indicator Comprehensive Analysis Quantitative Trading Strategy Trend Momentum and Volatility Collaborative Prediction ModelPine Script · Momentum · 3m