Strategy vault / Trend following
Tesla Supertrend Strategy
The Tesla Supertrend Strategy is a customized trading view script designed to generate trading signals for Tesla stock or other related assets. This strategy combines various technical indicators and conditions to…
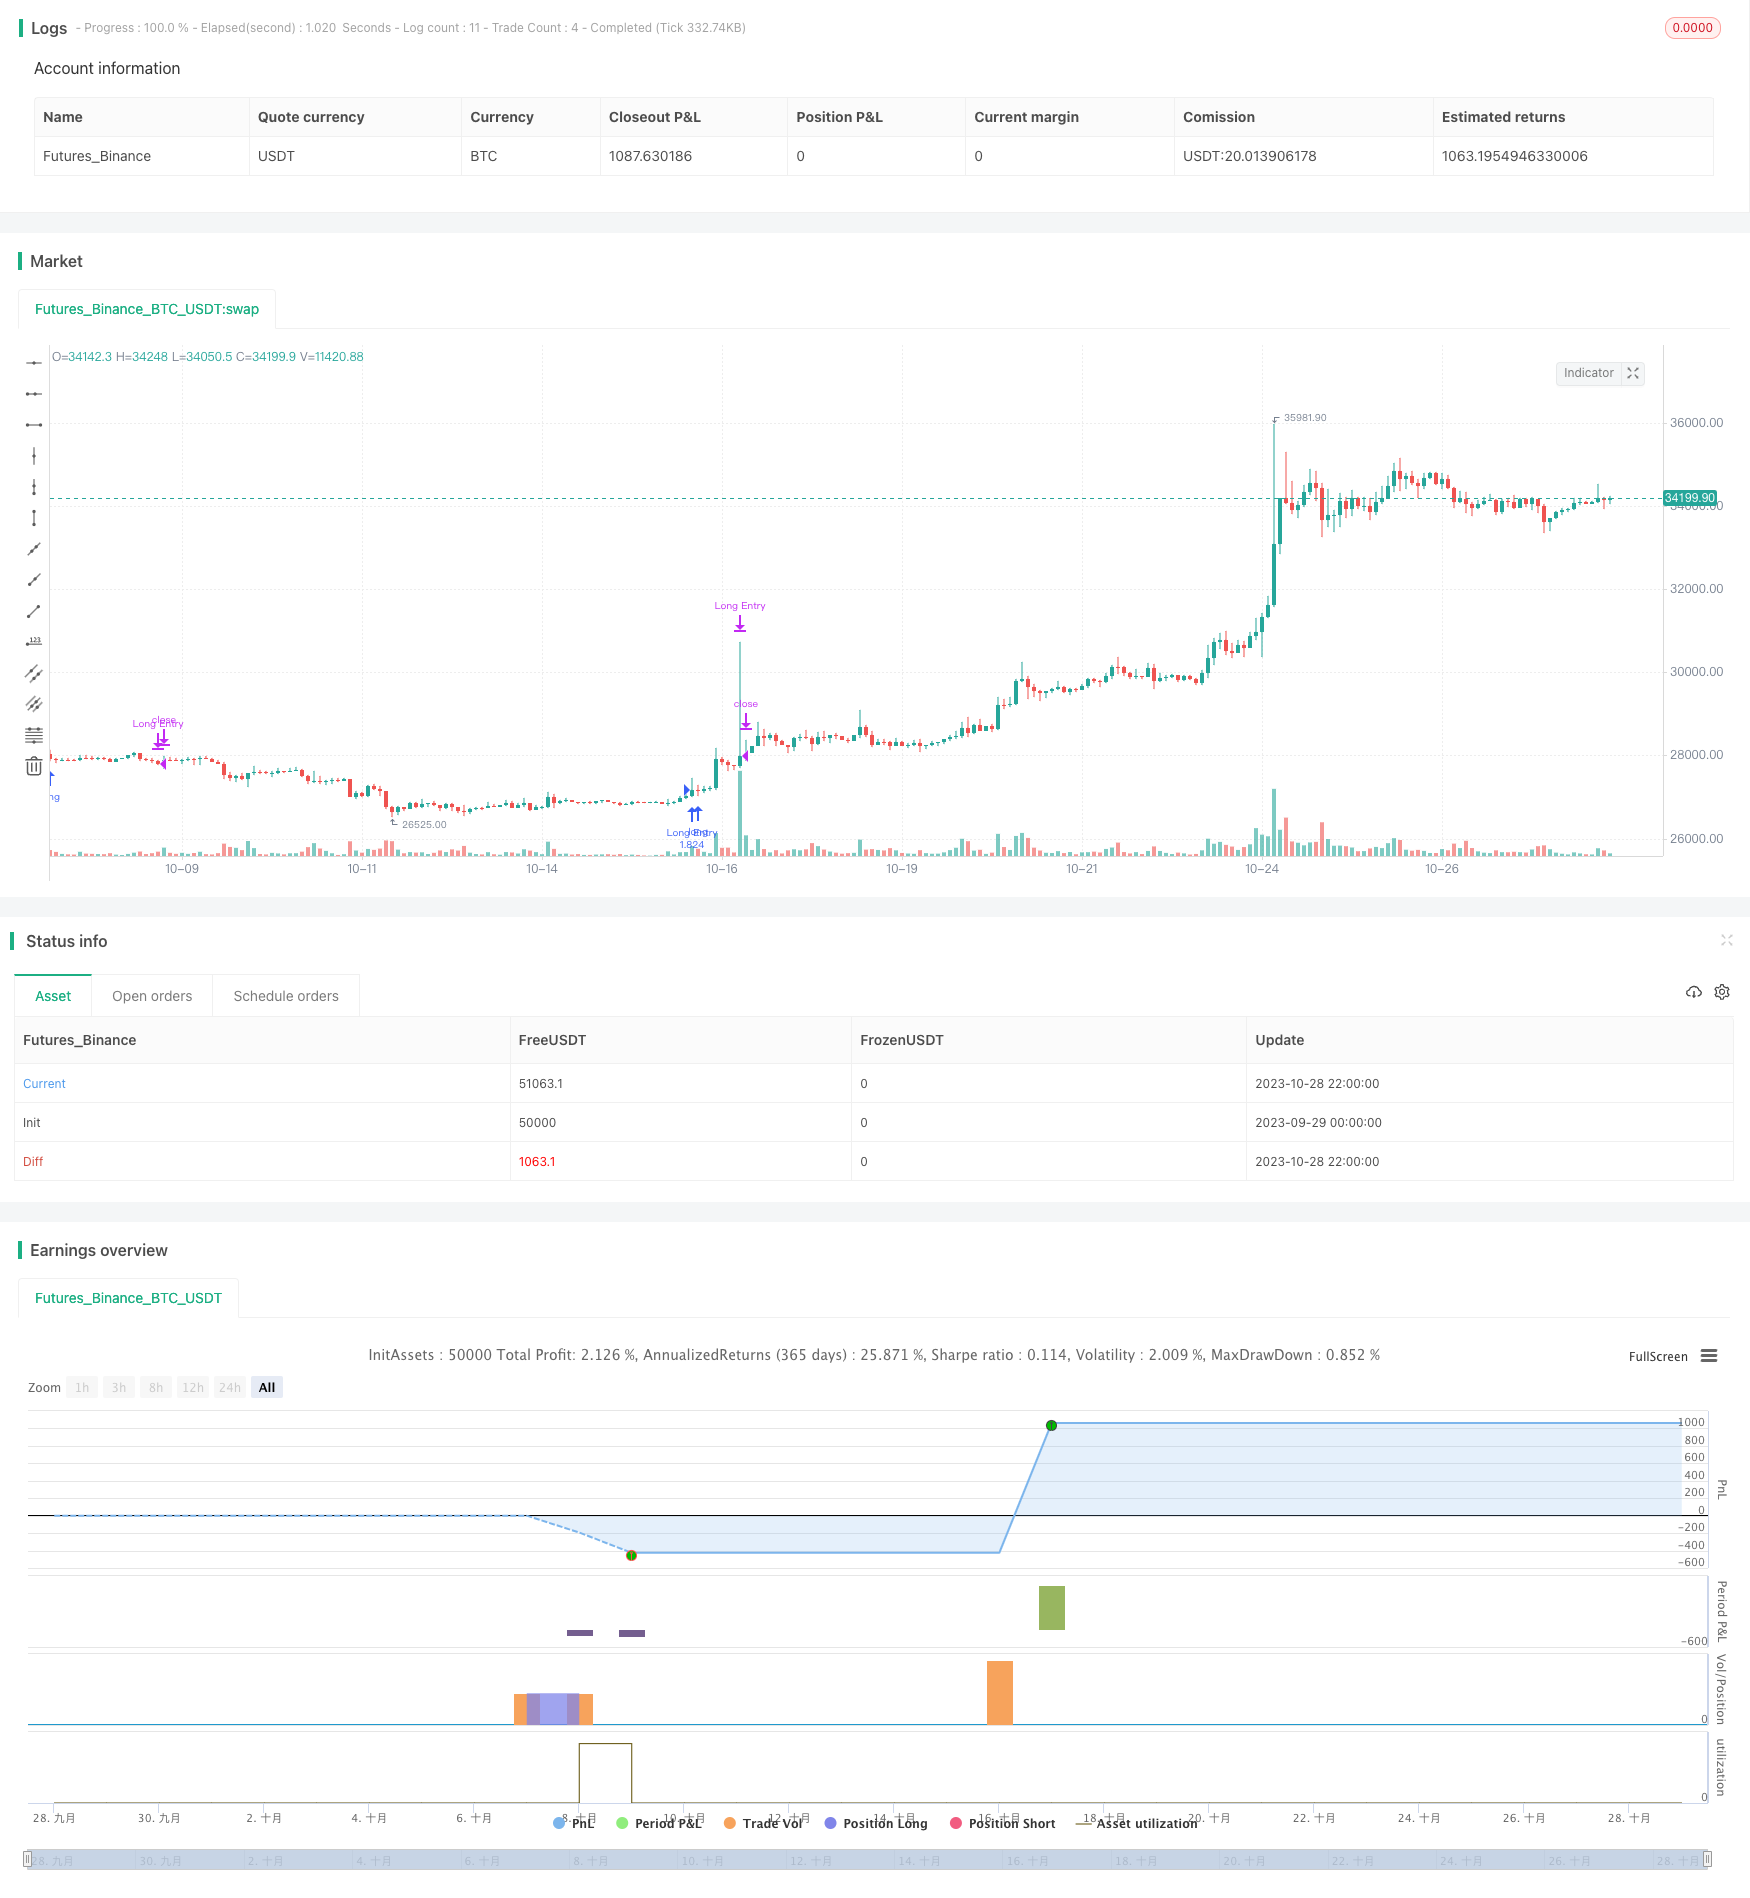
Overview
The Tesla Supertrend Strategy is a customized trading view script designed to generate trading signals for Tesla stock or other related assets. This strategy combines various technical indicators and conditions to identify potential long and short opportunities.
Strategy Logic
The strategy relies primarily on the following key indicators:
Supertrend Indicator: The Supertrend combines price data and Average True Range (ATR) to identify significant trend direction. The strategy uses the default 10-period Supertrend to determine bullish or bearish trends.
Relative Strength Index (RSI): The strategy employs multiple RSI conditions with different periods (21, 3, 10, and 28) to assess overbought and oversold conditions in the market. These RSI conditions help confirm the strength of potential trading signals.
Average Directional Index (ADX): The Average Directional Index (ADX) is used to measure the strength of a trend. Customizable parameters allow fine-tuning of ADX signals by controlling the smoothing and DI length.
Trading Logic:
Long Entry Signal: A long entry signal is generated when the following conditions align:
- Supertrend changes from bearish to bullish
- RSI(21) is below 75 (avoiding overbought)
- RSI(3) is above 65 (short-term strength)
- RSI(28) is above 49 (longer-term strength)
- ADX is above 21 (significant trend)
Exit Signal: A long position is closed when either of these conditions occur:
- Supertrend changes from bullish to bearish
- RSI(10) falls below 42 (potential weakness)
Advantage Analysis
The strategy has the following advantages:
- Supertrend identifies the major trend direction, helping avoid trading noise.
- Multiple RSI periods assess overheated and oversold conditions for higher quality signals.
- ADX ensures entry only when the trend is strong enough, avoiding false signals in choppy markets.
- Combining trend, strength and volatility indicators provides quality entry and exit points.
- Customizable parameters allow optimization for different assets and market environments.
- Easily applied on TradingView without programming for automated trading.
Risk Analysis
The strategy also carries the following risks:
- Like any technical indicator strategy, false signals may occur and stop losses are essential.
- Over-reliance on indicators ignoring fundamentals or longer-term trends.
- Over-optimization to fit historical data risks curve fitting and requires cautious backtesting.
- Real trading requires execution means like scaling in, dynamic stops for risk control.
- Indicators may fail in the event of sudden developments, requiring human intervention or suspension of trading.
Optimization Directions
The strategy can also be improved in the following aspects:
- Test different combinations of trend and strength indicators to find optimal parameters.
- Add entry conditions like volume breakouts to ensure strong reversals.
- Optimize holding period for better profit vs drawdown ratio.
- Enable trading selectively using IMPLIED VOL ATM to avoid ineffective low volatility environments.
- Incorporate machine learning models to judge quality of indicator signals and improve win rate.
- Adjust parameters based on asset characteristics to make the strategy more robust.
Conclusion
In summary, the Tesla Supertrend Strategy aims to identify quality entry and exit points by judging strong trend with a combination of indicators. Compared to single indicators, it can filter out false signals and trade when the trend and strength align. However, optimization and risk control must be done prudently without relying solely on historical performance for live trading. With continual testing and tuning, this strategy has the potential to become a valuable tool for trading Tesla or other assets.
Parameters
| Name | Default | What it controls |
|---|---|---|
| v_input_1 | 19 | ATR Length |
| v_input_float_1 | 3 | Factor |
| v_input_2 | 7 | ADX Smoothing |
| v_input_3 | 7 | DI Length |
Source Pine Script
/*backtest
start: 2023-09-29 00:00:00
end: 2023-10-29 00:00:00
period: 2h
basePeriod: 15m
exchanges: [{"eid":"Futures_Binance","currency":"BTC_USDT"}]
*/

// © cjones0313

//@version=5
strategy("TSLA 1.8k Strategy", overlay=true, default_qty_type=strategy.percent_of_equity, default_qty_value=100)


// a measure of volatility, default 10 - measured over 10 bars
// modifying the value > 10 results in a smoother supertrend line, filter out noise but slower response to price changes
// modifying the value < 10 results in faster response in price changes, but may result in more false signals
atrPeriod = input(19, "ATR Length")

// sets factor for supertrend line made up of price and ATR, this determines how much weight is given to each, default 3.0
// increasing the value > 3.0 results in faster response in price changes, but may result in more false signals
// decreasing the value results in filtering out noise, but may miss smaller price movements
factor = input.float(3.0, "Factor", step = 0.01)

// direction = 1 bullish, -1 bearish
[_, direction] = ta.supertrend(factor, atrPeriod)


adxlen = input(7, title="ADX Smoothing")
dilen = input(7, title="DI Length")
dirmov(len) =>
    up = ta.change(high)
    down = -ta.change(low)
    plusDM = na(up) ? na : (up > down and up > 0 ? up : 0)
    minusDM = na(down) ? na : (down > up and down > 0 ? down : 0)
    truerange = ta.rma(ta.tr, len)
    plus = fixnan(100 * ta.rma(plusDM, len) / truerange)
    minus = fixnan(100 * ta.rma(minusDM, len) / truerange)
    [plus, minus]
adx(dilen, adxlen) =>
    [plus, minus] = dirmov(dilen)
    sum = plus + minus
    adx = 100 * ta.rma(math.abs(plus - minus) / (sum == 0 ? 1 : sum), adxlen)
sig = adx(dilen, adxlen)

if ta.change(direction, 1) < 0 and ta.rsi(close, 21) < 75 and ta.rsi(close, 3) > 65 and ta.rsi(close, 28) > 49 and sig > 21
    strategy.entry("Long Entry", strategy.long)

if ta.change(direction, 1) > 0 or ta.rsi(close, 10) < 42
    strategy.close("Long Entry")
Published by ChaoZhang on the FMZ strategy square · last modified 2023-10-30. Collected in the Quant Trading Vault. Unvalidated research: re-test with your own data and costs before trusting it.
Build this with AgenKit
A spec is not a trading system. Paste this into your coding agent and AgenKit runs a specialist team — architecture, test-first build, risk gates, review — with paper trading on by default.
/agenkit build a production-grade trading bot with a backtest engine, risk controls and paper trading by default from strategies/Tesla-Supertrend-Strategy.md- npx agenkit install engineering-kit in your project
- Paste the command into your agent and approve each phase
- Get tests, backtest, risk controls and a paper-trading switch
Understand it first
Before you run this, read the lesson behind the idea and how to backtest it honestly. Specs like this one are the survivors of an unknown number of trials; deflate their results accordingly.
Related specs
- Trend Tracking and Short term Trading Strategy Based on ADX IndicatorPine Script · Trend following · 1d
- Advanced Quantitative Trading Strategy Multi Dimensional Super Trend ATR Dynamic Tracking SystemPine Script · Trend following · 1h
- Dual Timeframe Supertrend with RSI Optimization SystemPine Script · Trend following · 1h
- Dual directional Trailing Stop Moving Average Trend StrategyPine Script · Trend following · 1m
- Solid Trend Following StrategyPine Script · Trend following · 1h
- Supertrend Bitcoin Long Line StrategyPine Script · Trend following · 1d