The Momentum Driven Triple Confirmation Trend Following Strategy
This strategy generates trading signals using a triple confirmation mechanism, i.e. the momentum indicator confirms strong market trend, the Supertrend indicator confirms trend direction, and the EMA indicator…
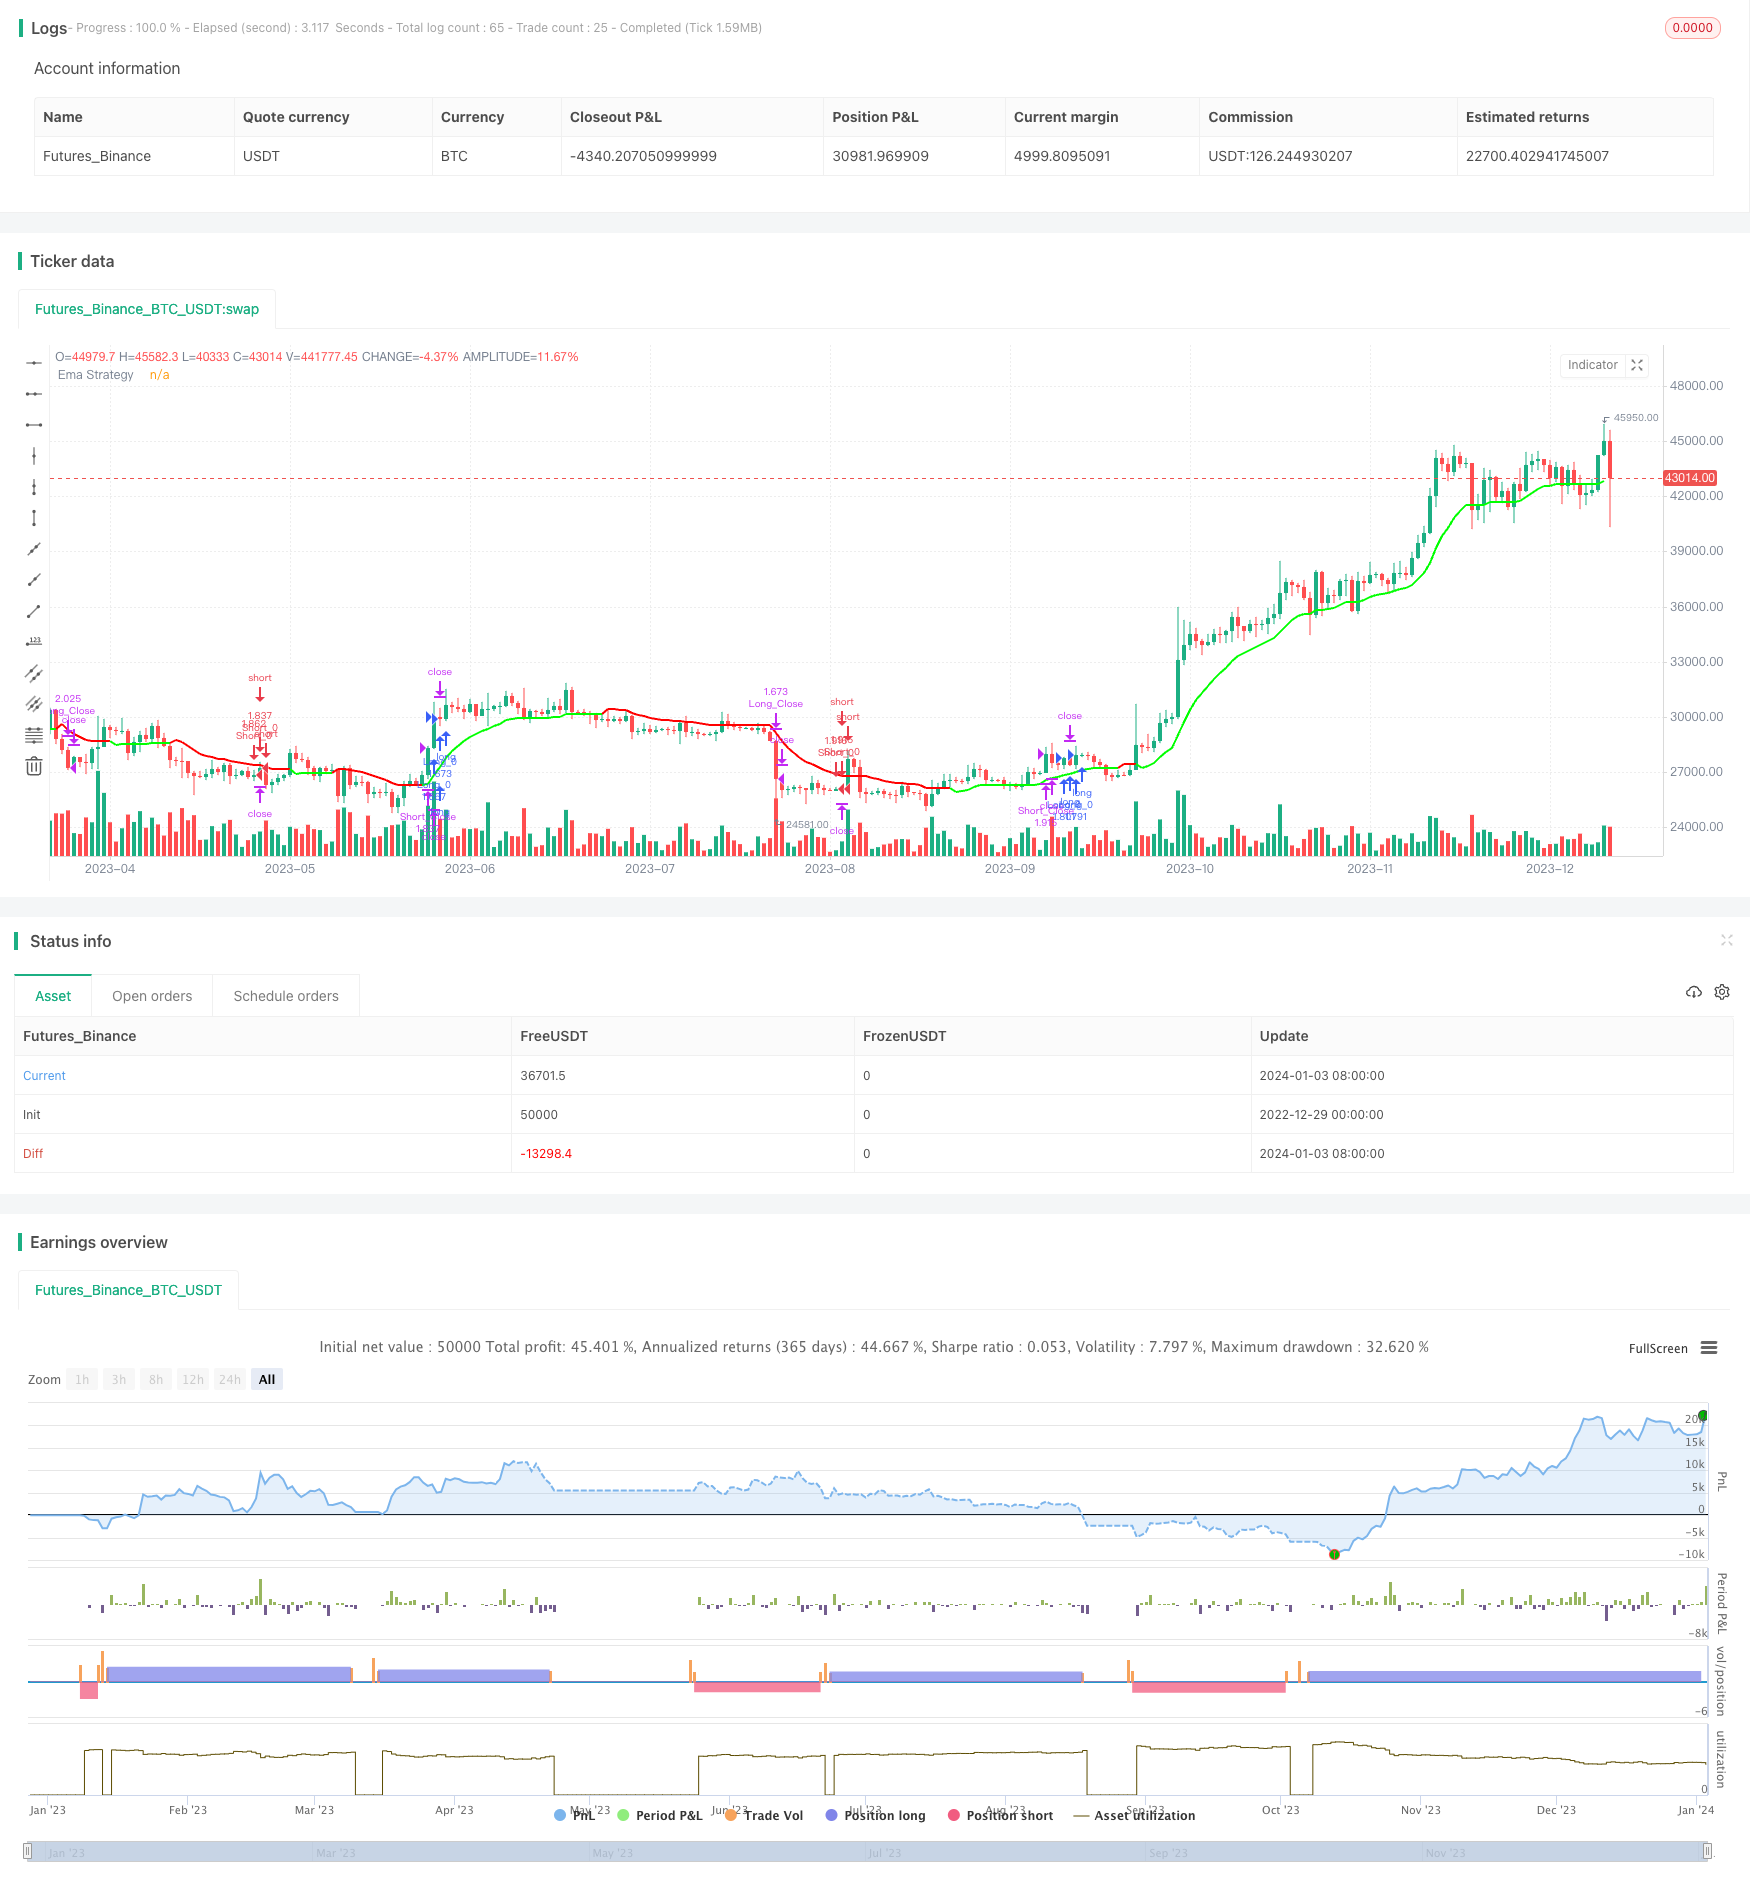
Overview
This strategy generates trading signals using a triple confirmation mechanism, i.e. the momentum indicator confirms strong market trend, the Supertrend indicator confirms trend direction, and the EMA indicator provides additional verification of trend direction. Only when all three indicators meet the criteria will the strategy generate long or short trading signals, thus ensuring only high probability trading opportunities are selected.
Strategy Principle
Momentum Indicator (Momentum RSI)
The Momentum RSI indicator is used to determine the strength of the market trend. Readings above 60 indicate a strong market trend.
Trading signals are only generated during intense bull or bear markets.
Supertrend Analysis
The Supertrend line represents market trend direction. Positions are only considered when the price breaks through the Supertrend line.
When the price breaks through the Supertrend line upwards, it is converted to an uptrend; when it breaks downwards it converts to a downtrend.
EMA Strategy
- The EMA and its auxiliary trend lines are used to confirm trend direction. Buy signals only appear when the EMA breaks upwards through the auxiliary trend line, and short signals are the opposite.
Only when all three indicators simultaneously meet the position opening conditions will genuine trading signals be issued. This greatly reduces the number of false signals and improves the stability of the strategy.
Advantage Analysis
The strategy has extremely high stability and profitability. The main advantages are:
Multiple confirmation mechanisms effectively filter noise and only select high probability trades.
The Supertrend line has a dynamic trailing stop loss to effectively control risk.
Combined with trend strength judgment, only trading in strong trends avoids additional risk.
EMA indicator provides additional verification to ensure trade direction is correct.
Fully parameterized so traders can customize as needed.
Risk Analysis
The main risks of this strategy come from abnormal breakouts causing erroneous trade signals. The main risks and solutions include:
False breakout risk: Increase breakout verification mechanisms.
Larger oscillation range risk: Appropriately adjust stop loss range.
Trend reversal risk: Shorten holding period, timely stop loss.
Optimization Directions
The main directions for optimizing this strategy include:
Parameter optimization: Adjust indicator parameters to suit more varieties.
Increased filtering: Combine more indicators to improve signal quality.
Composite strategies: Combine with other strategies to utilize complementary advantages.
Dynamic parameter adjustment: Automatically adjust parameters based on market conditions.
Machine learning: Use algorithms to automatically find optimal parameters.
Summary
This strategy achieves a high probability trading strategy with multiple confirmations by effectively combining momentum, Supertrend and EMA indicators. Its strict breakout verification mechanism also gives it extremely strong stability. At the same time, it has very high customizability and optimization potential. In summary, this strategy integrates the advantages of trend following and breakout trading, making it a very promising algorithmic trading strategy.
Parameters
| Name | Default | What it controls |
|---|---|---|
| v_input_int_1 | 10 | (?Rsi Of Momentum )Length Mom-Rsi |
| v_input_int_2 | 60 | Mom-Rsi Limit Val |
| v_input_1 | 10 | (?SuperTrend indicator)ATR Length SuperTrend |
| v_input_float_1 | 3 | Factor SuperTrend |
| v_input_2_close | 0 | (?Ema indicator)Source Ema Ind: close | high | low | open | hl2 | hlc3 | hlcc4 | ohlc4 |
| v_input_int_3 | 12 | Length Ema Ind |
| v_input_float_2 | true | Percent Ema Ind |
| v_input_3 | timestamp(01 January 2000 13:30 +0000) | (?Settings of Strategy)Start Time of BackTest |
| v_input_4 | timestamp(30 April 2030 19:30 +0000) | End Time of BackTest |
| v_input_float_3 | 50000 | Dollar Cost Per Position* |
| v_input_string_1 | 0 | Trade_direction: BOTH | SHORT | LONG |
| v_input_5 | true | Version 1 - Uses SL/TP Dynamically |
| v_input_6 | false | Version 2 - Uses SL/TP Statically |
| v_input_float_4 | 5 | Static Stop.Loss % Val |
| v_input_float_5 | 10 | Static Take.Prof % Val |
| v_input_bool_1 | true | (?Line Settings) Show StopLoss - TakeProf Lines |
| v_input_bool_2 | true | Show Trend Line |
| v_input_color_1 | #ffff00 | StopLoss Line Colour |
| v_input_color_2 | #00ff00 | Up Trend line Colour |
| v_input_color_3 | #ff0000 | Down Trend line Colour |
Source Pine Script
/*backtest
start: 2022-12-29 00:00:00
end: 2024-01-04 00:00:00
period: 1d
basePeriod: 1h
exchanges: [{"eid":"Futures_Binance","currency":"BTC_USDT"}]
*/

//@version=5
strategy('The Flash-Strategy (Momentum-RSI, EMA-crossover, ATR)', shorttitle='The Flash-Strategy (Momentum-RSI, EMA-crossover, ATR)', overlay=true,initial_capital = 1000)
//// author -  Baby_whale_to_moon

// MOM Rsi indicator
group_mom_rsi = "Rsi Of Momentum "
len = input.int(10, minval=1, title="Length Mom-Rsi", group =group_mom_rsi ,tooltip = 'This ind calculate Rsi value of Momentum we use this ind to determine power of trend')
src2 = close
mom = src2 - src2[len]
rsi_mom = ta.rsi(mom, len)
mom_rsi_val = input.int(60, minval=1, title="Mom-Rsi Limit Val", group =group_mom_rsi, tooltip = "When our Mom-Rsi value more then this we open LONG or Short, with help of this indicator we we determine the status of the trend")

// Super Trend Ind
group_supertrend = "SuperTrend indicator"
atrPeriod = input(10, "ATR Length SuperTrend", group = group_supertrend)
factor = input.float(3.0, "Factor SuperTrend", step = 0.01, group = group_supertrend)

[supertrend, direction] = ta.supertrend(factor, atrPeriod)

// Ema Indicator
group_most = "Ema indicator"
src = input(close, 'Source Ema Ind',group = group_most)
AP2 = input.int(defval=12, title='Length Ema Ind', minval=1,group = group_most)
Trail1 = ta.ema(src, AP2) //Ema func
AF2 = input.float(defval=1, title='Percent Ema Ind', minval=0.1,group = group_most) / 100
SL2 = Trail1 * AF2  // Stoploss Ema
Trail2 = 0.0
iff_1 = Trail1 > nz(Trail2[1], 0) ? Trail1 - SL2 : Trail1 + SL2
iff_2 = Trail1 < nz(Trail2[1], 0) and Trail1[1] < nz(Trail2[1], 0) ? math.min(nz(Trail2[1], 0), Trail1 + SL2) : iff_1
Trail2 := Trail1 > nz(Trail2[1], 0) and Trail1[1] > nz(Trail2[1], 0) ? math.max(nz(Trail2[1], 0), Trail1 - SL2) : iff_2

//Bull = ta.barssince(Trail1 > Trail2 and close > Trail2 and low > Trail2) < ta.barssince(Trail2 > Trail1 and close < Trail2 and high < Trail2)

//TS1 = plot(Trail1, 'ExMov', style=plot.style_line, color=Trail1 > Trail2 ? color.rgb(33, 149, 243, 100) : color.rgb(255, 235, 59, 100), linewidth=2)
//TS2 = plot(Trail2, 'ema', style=plot.style_line, color=Trail1 > Trail2 ? color.rgb(76, 175, 79, 30) : color.rgb(255, 82, 82, 30), linewidth=2)
//fill(TS1, TS2, Bull  ? color.green : color.red, transp=90)


// Strategy Sett
group_strategy = "Settings of Strategy"
Start_Time = input(defval=timestamp('01 January 2000 13:30 +0000'), title='Start Time of BackTest', group =group_strategy)
End_Time = input(defval=timestamp('30 April 2030 19:30 +0000'), title='End Time of BackTest', group =group_strategy)
dollar = input.float(title='Dollar Cost Per Position* ', defval=50000, group =group_strategy)
trade_direction = input.string(title='Trade_direction', group =group_strategy, options=['LONG', 'SHORT', 'BOTH'], defval='BOTH')
v1 = input(true, title="Version 1 - Uses SL/TP Dynamically ", group =group_strategy ,tooltip = 'With this settings our stoploss price increase or decrease with price to get better PNL score')

v2 = input(false, title="Version 2 -  Uses SL/TP Statically", group =group_strategy)
v2stoploss_input = input.float(5, title='Static Stop.Loss % Val', minval=0.01, group =group_strategy)/100
v2takeprofit_input = input.float(10, title='Static Take.Prof % Val', minval=0.01, group =group_strategy)/100

v2stoploss_level_long = strategy.position_avg_price * (1 - v2stoploss_input)
v2takeprofit_level_long = strategy.position_avg_price * (1 + v2takeprofit_input)

v2stoploss_level_short = strategy.position_avg_price * (1 + v2stoploss_input)
v2takeprofit_level_short = strategy.position_avg_price * (1 - v2takeprofit_input)

group_line = "Line Settings"
show_sl_tp = input.bool(title='  Show StopLoss - TakeProf Lines',inline = "1", defval=true, group =group_line)
show_trend_line = input.bool(title='  Show Trend Line',inline = '3' ,defval=true, group =group_line)
stoploss_colour = input.color(title='StopLoss Line Colour',inline = '2' ,defval=color.rgb(255, 255, 0), group =group_line)
up_trend_line_colour = input.color(title='Up Trend line Colour',inline = '4' ,defval=color.rgb(0, 255, 0, 30), group =group_line)
down_trend_line_colour = input.color(title='Down Trend line Colour',inline = '4' ,defval=color.rgb(255, 0, 0, 30), group =group_line)

//plot(supertrend ,color = strategy.position_size > 0 and show_sl_tp ? color.rgb(255, 0, 0) :show_sl_tp ? color.rgb(0, 255, 0) : na , style = plot.style_steplinebr,linewidth = 2)
// plot(supertrend ,color = show_sl_tp and v1 ? stoploss_colour : na , style = plot.style_steplinebr,linewidth = 2)

// plot(v2stoploss_level_long ,color = strategy.position_size > 0 and show_sl_tp and v2 ? stoploss_colour : na , style = plot.style_steplinebr,linewidth = 2)
// plot(v2stoploss_level_short ,color = strategy.position_size < 0 and show_sl_tp and v2 ? stoploss_colour : na , style = plot.style_steplinebr,linewidth = 2)
// plot(v2takeprofit_level_long  ,color = strategy.position_size > 0 and show_sl_tp and v2 ? up_trend_line_colour : na , style = plot.style_steplinebr,linewidth = 2)
// plot(v2takeprofit_level_short ,color = strategy.position_size < 0 and show_sl_tp and v2 ? up_trend_line_colour : na , style = plot.style_steplinebr,linewidth = 2)


TS2 = plot(Trail2, 'Ema Strategy', style=plot.style_line, color=show_trend_line and Trail1 < Trail2 ? down_trend_line_colour : show_trend_line ? up_trend_line_colour  : na, linewidth=2)

// bgcolor(buy_signal ? color.rgb(0, 230, 119, 80) : na)
// bgcolor(sell_signal ? color.rgb(255, 82, 82, 80) : na)

Time_interval = true
buy_signal = Trail1 > Trail2 and direction < 0 and rsi_mom > mom_rsi_val and Time_interval
sell_signal =Trail1 < Trail2 and direction > 0 and rsi_mom > mom_rsi_val and Time_interval


// Strategy entries
if strategy.opentrades == 0 and buy_signal and ( trade_direction == 'LONG' or trade_direction == 'BOTH')
    strategy.entry('Long_0', strategy.long, qty=dollar / close)

if strategy.opentrades == 0 and sell_signal and ( trade_direction == 'SHORT' or trade_direction == 'BOTH')
    strategy.entry('Short_0', strategy.short, qty=dollar / close)


if close < supertrend and v1
    strategy.exit('Long_Close',from_entry = "Long_0", stop=supertrend, qty_percent=100)
if  v2 and strategy.position_size > 0
    strategy.exit('Long_Close',from_entry = "Long_0", stop=v2stoploss_level_long,limit= v2takeprofit_level_long  , qty_percent=100)

if close > supertrend and v1
    strategy.exit('Short_Close',from_entry = "Short_0", stop=supertrend, qty_percent=100)
if  v2 and strategy.position_size < 0
    strategy.exit('Short_Close',from_entry = "Short_0", stop=v2stoploss_level_short,limit= v2takeprofit_level_short ,qty_percent=100)
Published by ChaoZhang on the FMZ strategy square · last modified 2024-01-05. Collected in the Quant Trading Vault. Unvalidated research: re-test with your own data and costs before trusting it.
Build this with AgenKit
A spec is not a trading system. Paste this into your coding agent and AgenKit runs a specialist team — architecture, test-first build, risk gates, review — with paper trading on by default.
/agenkit build a production-grade trading bot with a backtest engine, risk controls and paper trading by default from strategies/The-Momentum-Driven-Triple-Confirmation-Trend-Following-Strategy.md- npx agenkit install engineering-kit in your project
- Paste the command into your agent and approve each phase
- Get tests, backtest, risk controls and a paper-trading switch
Understand it first
Before you run this, read the lesson behind the idea and how to backtest it honestly. Specs like this one are the survivors of an unknown number of trials; deflate their results accordingly.
Related specs
- Advanced Multi Indicator Trend Following and Momentum Quantitative Trading StrategyPine Script · Momentum · 1h
- Multi Indicator Trend Momentum Crossover Quantitative StrategyPine Script · Momentum · 1d
- Hybrid EMA Momentum Trading System with Trend Persistence Analysis StrategyPine Script · Momentum · 2h
- Multi Technical Indicator Trend Following Strategy with RSI Momentum FilterPine Script · Momentum · 1h
- Multi Indicator Comprehensive Analysis Quantitative Trading Strategy Trend Momentum and Volatility Collaborative Prediction ModelPine Script · Momentum · 3m
- Oscillator Candles Momentum Trading StrategyPine Script · Momentum · 1h