The Triple Moving Average Channel Strategy for Patiently Mining Valuable Information from Candlestick Lines
The triple moving average channel strategy utilizes multiple moving average indicators to deeply analyze candlestick chart and unearth hidden rules behind price fluctuations, thus achieving low-risk arbitrage trading.
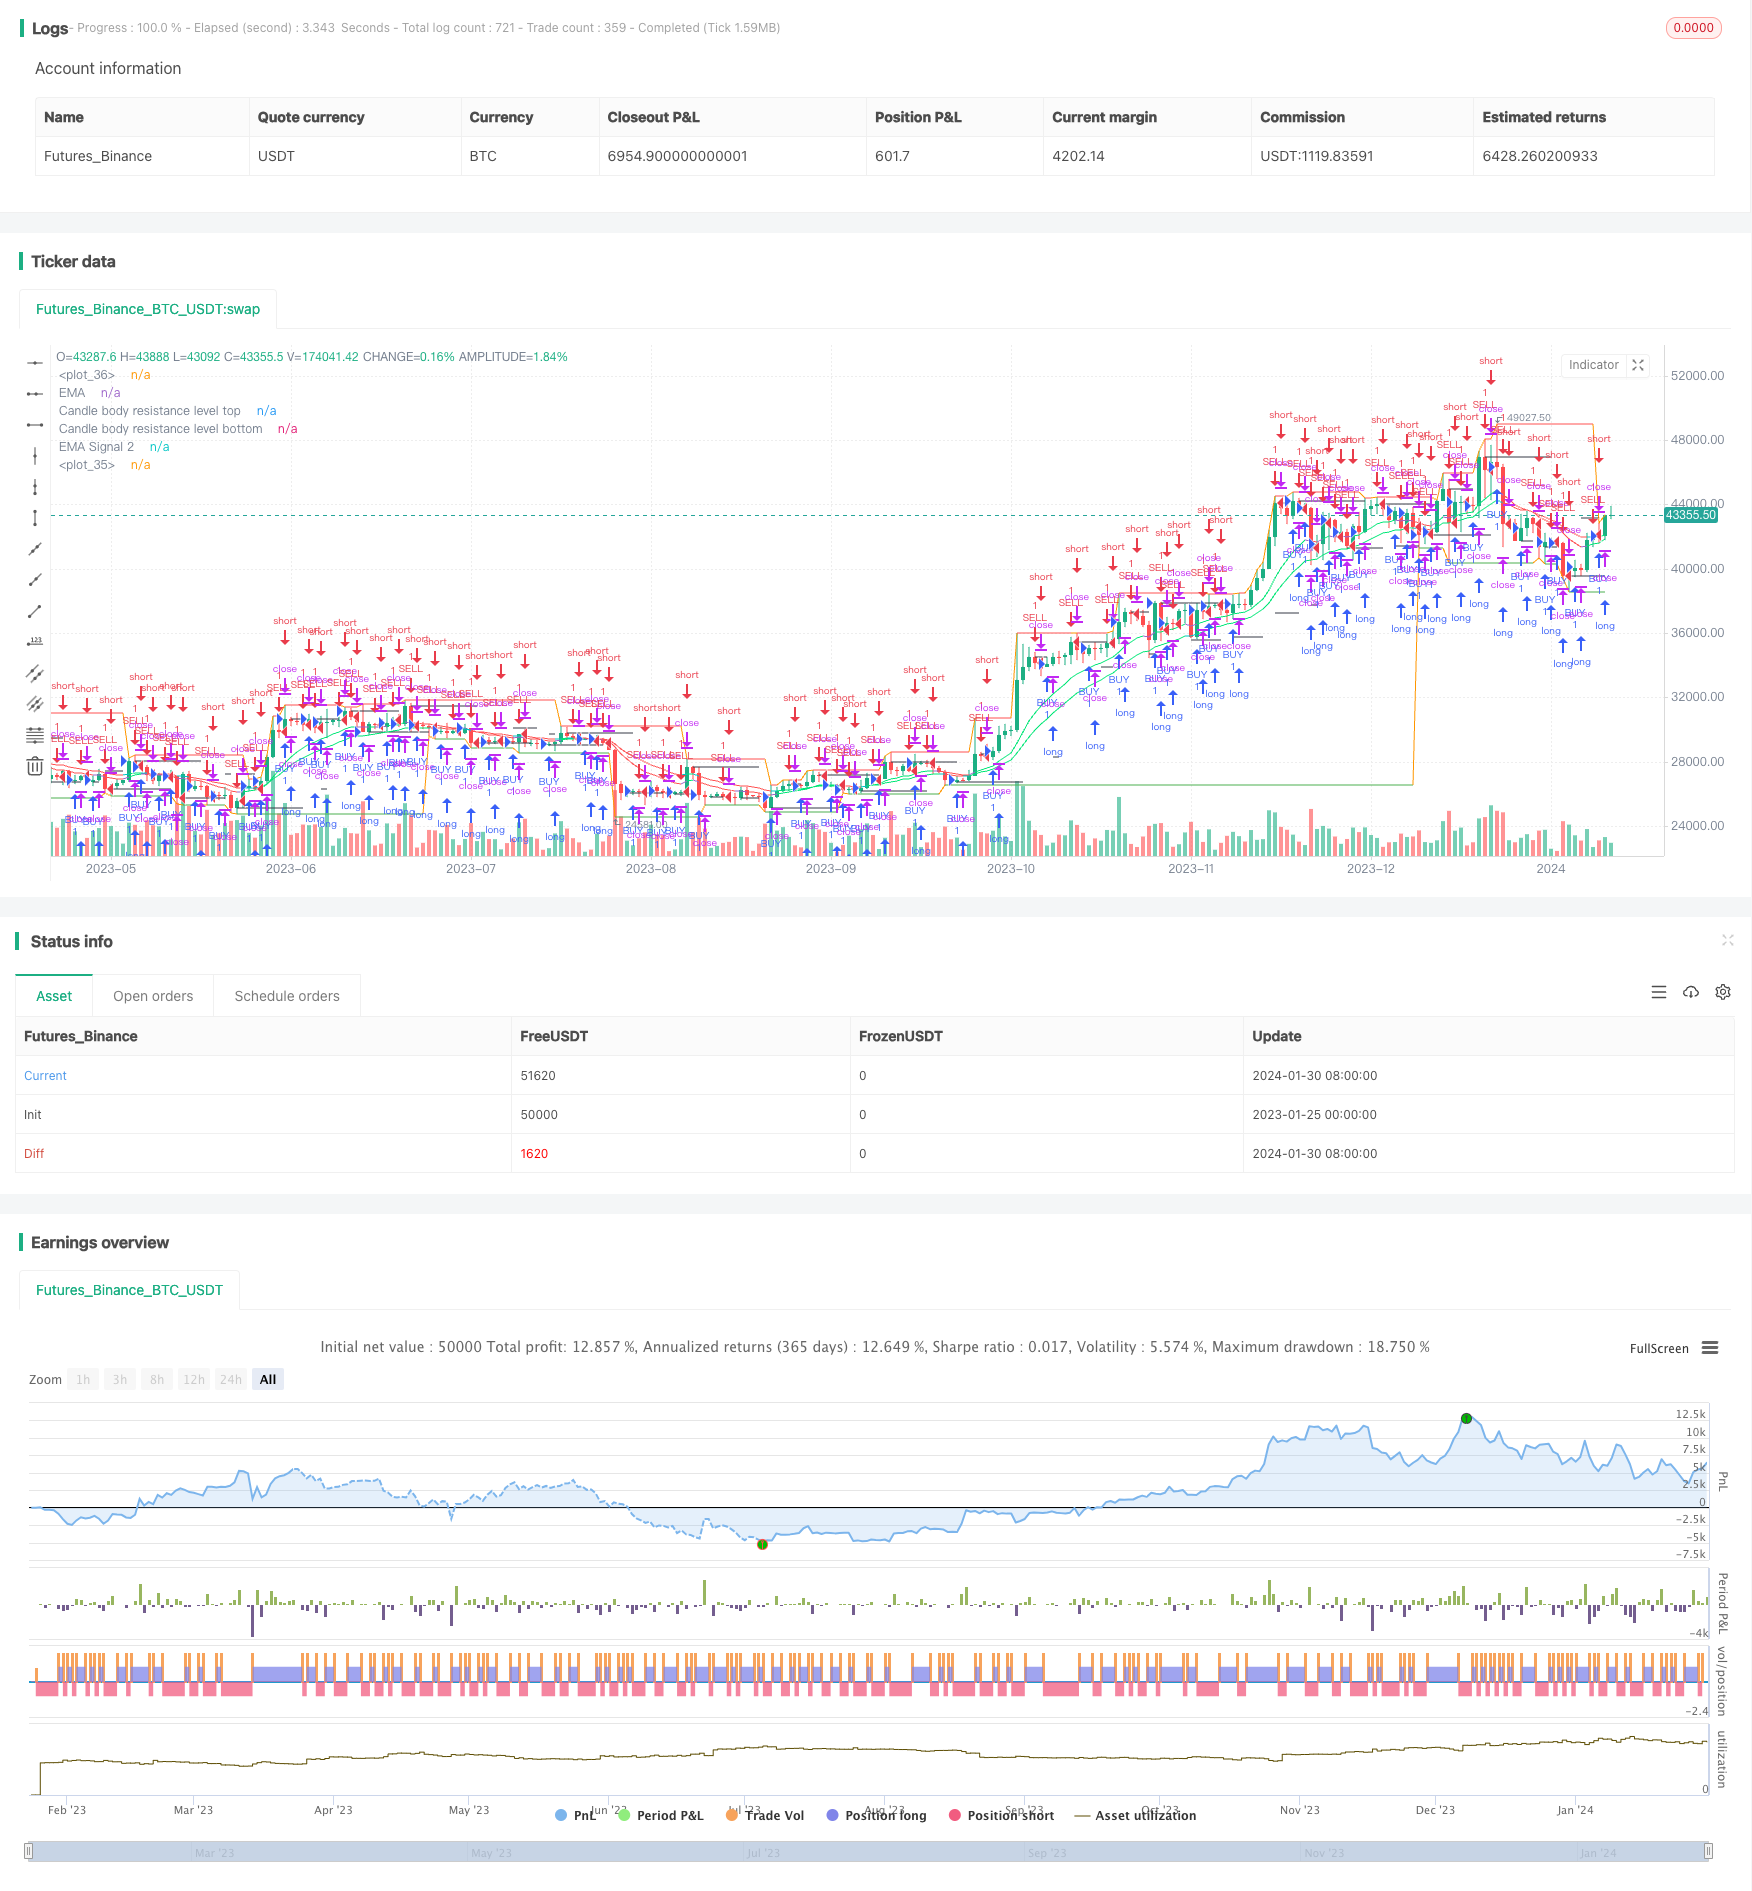
Overview
The triple moving average channel strategy utilizes multiple moving average indicators to deeply analyze candlestick chart and unearth hidden rules behind price fluctuations, thus achieving low-risk arbitrage trading.
Principles
This strategy stacks multiple EMA metrics on top of Bollinger Bands to build price channels and discover patterns in price volatility. Specifically:
- The BodyResistanceChannel indicator is used to plot resistance levels of candle body.
- The Support/Resistance indicator is leveraged to draw multi-day support and resistance levels.
- The dual EMA system helps determine the trend direction.
- The Hull MA indicator smoothes the price curve.
On this basis, reversal opportunities are identified through pattern recognition to formulate arbitrage strategies.
Advantages
The advantages of this strategy include:
- Building price channels with multiple EMAS helps clearly determine price trend.
- The Hull MA indicator effectively smoothes out price breakouts.
- Combining reversal patterns and channel indicators allows high-probability and low-risk trading.
- Constructing a multi-layer indicator system ensures stable and reliable trading signals.
Risk Analysis
Potential risks of this strategy also exist:
- The risk of huge losses when price channel is breached. The solution is to adopt moving stop loss to reduce per trade loss.
- The risk of wrong signals when reversal pattern recognition goes wrong. The solution is parameter optimization to improve pattern accuracy.
- The risk of deteriorating signal quality when indicator parameters mismatch. The solution is multi-parameter optimization testing.
Optimization Directions
The main optimization directions include:
- Optimize combinations of EMA period parameters to better suit market conditions.
- Adjust stop loss levels to maximize per trade return while minimizing per trade loss risk.
- Introduce dynamic position sizing module based on volatility to effectively manage risks.
- Utilize deep learning technologies to uncover more price patterns and improve signal quality.
Conclusion
The triple moving average channel strategy deeply mines price movement regularity with stability and efficiency, worthy of long-term application and continuous optimization. Investing requires rationality and patience, progressive position scaling is the key to success.
Parameters
| Name | Default | What it controls |
|---|---|---|
| v_input_1_close | 0 | Candle body resistance Channel: close | high | low | open | hl2 | hlc3 | hlcc4 | ohlc4 |
| v_input_2 | false | Bar Channel On/Off |
| v_input_3 | 10 | Support / Resistance length: |
| v_input_4 | 13 | EMA 1 |
| v_input_5 | 21 | EMA 2 |
| v_input_6 | false | Display Hull MA Set: |
| v_input_7_close | 0 | Hull MA's Source:: close | high | low | open | hl2 | hlc3 | hlcc4 | ohlc4 |
| v_input_8 | 8 | Hull MA's Base Length: |
| v_input_9 | 5 | Hull MA's Length Scalar: |
| v_input_10 | 720 | Piriod |
Source Pine Script
/*backtest
start: 2023-01-25 00:00:00
end: 2024-01-31 00:00:00
period: 1d
basePeriod: 1h
exchanges: [{"eid":"Futures_Binance","currency":"BTC_USDT"}]
*/

//@version=3
//╭╮╱╱╭╮╭╮╱╱╭╮
//┃╰╮╭╯┃┃┃╱╱┃┃
//╰╮┃┃╭┻╯┣╮╭┫╰━┳╮╭┳━━╮
//╱┃╰╯┃╭╮┃┃┃┃╭╮┃┃┃┃━━┫
//╱╰╮╭┫╰╯┃╰╯┃╰╯┃╰╯┣━━┃
//╱╱╰╯╰━━┻━━┻━━┻━━┻━━╯
//╭━━━┳╮╱╱╱╱╱╱╱╭╮
//┃╭━╮┃┃╱╱╱╱╱╱╱┃┃
//┃┃╱╰┫╰━┳━━┳━╮╭━╮╭━━┫┃
//┃┃╱╭┫╭╮┃╭╮┃╭╮┫╭╮┫┃━┫┃
//┃╰━╯┃┃┃┃╭╮┃┃┃┃┃┃┃┃━┫╰╮
//╰━━━┻╯╰┻╯╰┻╯╰┻╯╰┻━━┻━╯
//━╯
// http://www.vdubus.co.uk/
strategy(title='Vdub FX SniperVX3 / Strategy  v3', shorttitle='Vdub_FX_SniperVX3_Strategy', overlay=true, pyramiding=0, initial_capital=1000, currency=currency.USD)

//Candle body resistance Channel-----------------------------//
len = 34
src = input(close, title="Candle body resistance Channel")
out = sma(src, len)
last8h = highest(close, 13)
lastl8 = lowest(close, 13)
bearish = cross(close,out) == 1 and falling(close, 1)
bullish = cross(close,out) == 1 and rising(close, 1)
channel2=input(false, title="Bar Channel On/Off")
ul2=plot(channel2?last8h:last8h==nz(last8h[1])?last8h:na, color=black, linewidth=1, style=linebr, title="Candle body resistance level top", offset=0)
ll2=plot(channel2?lastl8:lastl8==nz(lastl8[1])?lastl8:na, color=black, linewidth=1, style=linebr, title="Candle body resistance level bottom", offset=0)
//fill(ul2, ll2, color=black, transp=95, title="Candle body resistance Channel")

//-----------------Support and Resistance
RST = input(title='Support / Resistance length:', defval=10)
RSTT = valuewhen(high >= highest(high, RST), high, 0)
RSTB = valuewhen(low <= lowest(low, RST), low, 0)
RT2 = plot(RSTT, color=RSTT != RSTT[1] ? na : red, linewidth=1, offset=+0)
RB2 = plot(RSTB, color=RSTB != RSTB[1] ? na : green, linewidth=1, offset=0)

//--------------------Trend colour ema------------------------------------------------//
src0 = close, len0 = input(13, minval=1, title="EMA 1")
ema0 = ema(src0, len0)
direction = rising(ema0, 2) ? +1 : falling(ema0, 2) ? -1 : 0
plot_color = direction > 0  ? lime: direction < 0 ? red : na
plot(ema0, title="EMA", style=line, linewidth=1, color = plot_color)

//-------------------- ema 2------------------------------------------------//
src02 = close, len02 = input(21, minval=1, title="EMA 2")
ema02 = ema(src02, len02)
direction2 = rising(ema02, 2) ? +1 : falling(ema02, 2) ? -1 : 0
plot_color2 = direction2 > 0  ? lime: direction2 < 0 ? red : na
plot(ema02, title="EMA Signal 2", style=line, linewidth=1, color = plot_color2)

//=============Hull MA//
show_hma = input(false, title="Display Hull MA Set:")
hma_src = input(close, title="Hull MA's Source:")
hma_base_length = input(8, minval=1, title="Hull MA's Base Length:")
hma_length_scalar = input(5, minval=0, title="Hull MA's Length Scalar:")
hullma(src, length)=>wma(2*wma(src, length/2)-wma(src, length), round(sqrt(length)))
plot(not show_hma ? na : hullma(hma_src, hma_base_length+hma_length_scalar*6), color=black, linewidth=2, title="Hull MA")

//============ signal Generator ==================================//
Piriod=input('720')
ch1 = request.security(syminfo.tickerid, Piriod, open)
ch2 = request.security(syminfo.tickerid, Piriod, close)
longCondition = crossover(request.security(syminfo.tickerid, Piriod, close),request.security(syminfo.tickerid, Piriod, open))
if (longCondition)
    strategy.entry("BUY", strategy.long)
shortCondition = crossunder(request.security(syminfo.tickerid, Piriod, close),request.security(syminfo.tickerid, Piriod, open))
if (shortCondition)
    strategy.entry("SELL", strategy.short)

///////////////////////////////////////////////////////////////////////////////////////////Published by ChaoZhang on the FMZ strategy square · last modified 2024-02-01. Collected in the Quant Trading Vault. Unvalidated research: re-test with your own data and costs before trusting it.
Build this with AgenKit
A spec is not a trading system. Paste this into your coding agent and AgenKit runs a specialist team — architecture, test-first build, risk gates, review — with paper trading on by default.
/agenkit build a spread arbitrage engine with WebSocket order routing and leg-risk controls from strategies/The-Triple-Moving-Average-Channel-Strategy-for-Patiently-Mining-Valuable-Information-from-Candlestick-Lines.md- npx agenkit install engineering-kit in your project
- Paste the command into your agent and approve each phase
- Get tests, backtest, risk controls and a paper-trading switch
Understand it first
Before you run this, read the lesson behind the idea and how to backtest it honestly. Specs like this one are the survivors of an unknown number of trials; deflate their results accordingly.
Related specs
- Triple Moving Average Quantitative Trading Strategy 433095Pine Script · Arbitrage · 1d
- Oscillating Market Long StrategyPine Script · Arbitrage · 1d
- Cross Cycle Arbitrage Strategy Based on Multiple IndicatorsPine Script · Arbitrage · 1h
- multiple auxiliary RSI indicator strategyPine Script · Arbitrage · 1d
- Dual Timeframe Volatility Spread Trading StrategyPine Script · Arbitrage · 2h
- Quadratic Fitting Trading Signals StrategyPine Script · Arbitrage · 1h