Strategy vault / Machine learning
Three Factors Model for Price Oscillation Detection
The Three Factors Model for Price Oscillation Detection is a short-term trading strategy that integrates multiple factors for judgment. This strategy takes into account factors like volume ratio, RSI, MACD, and…
Overview
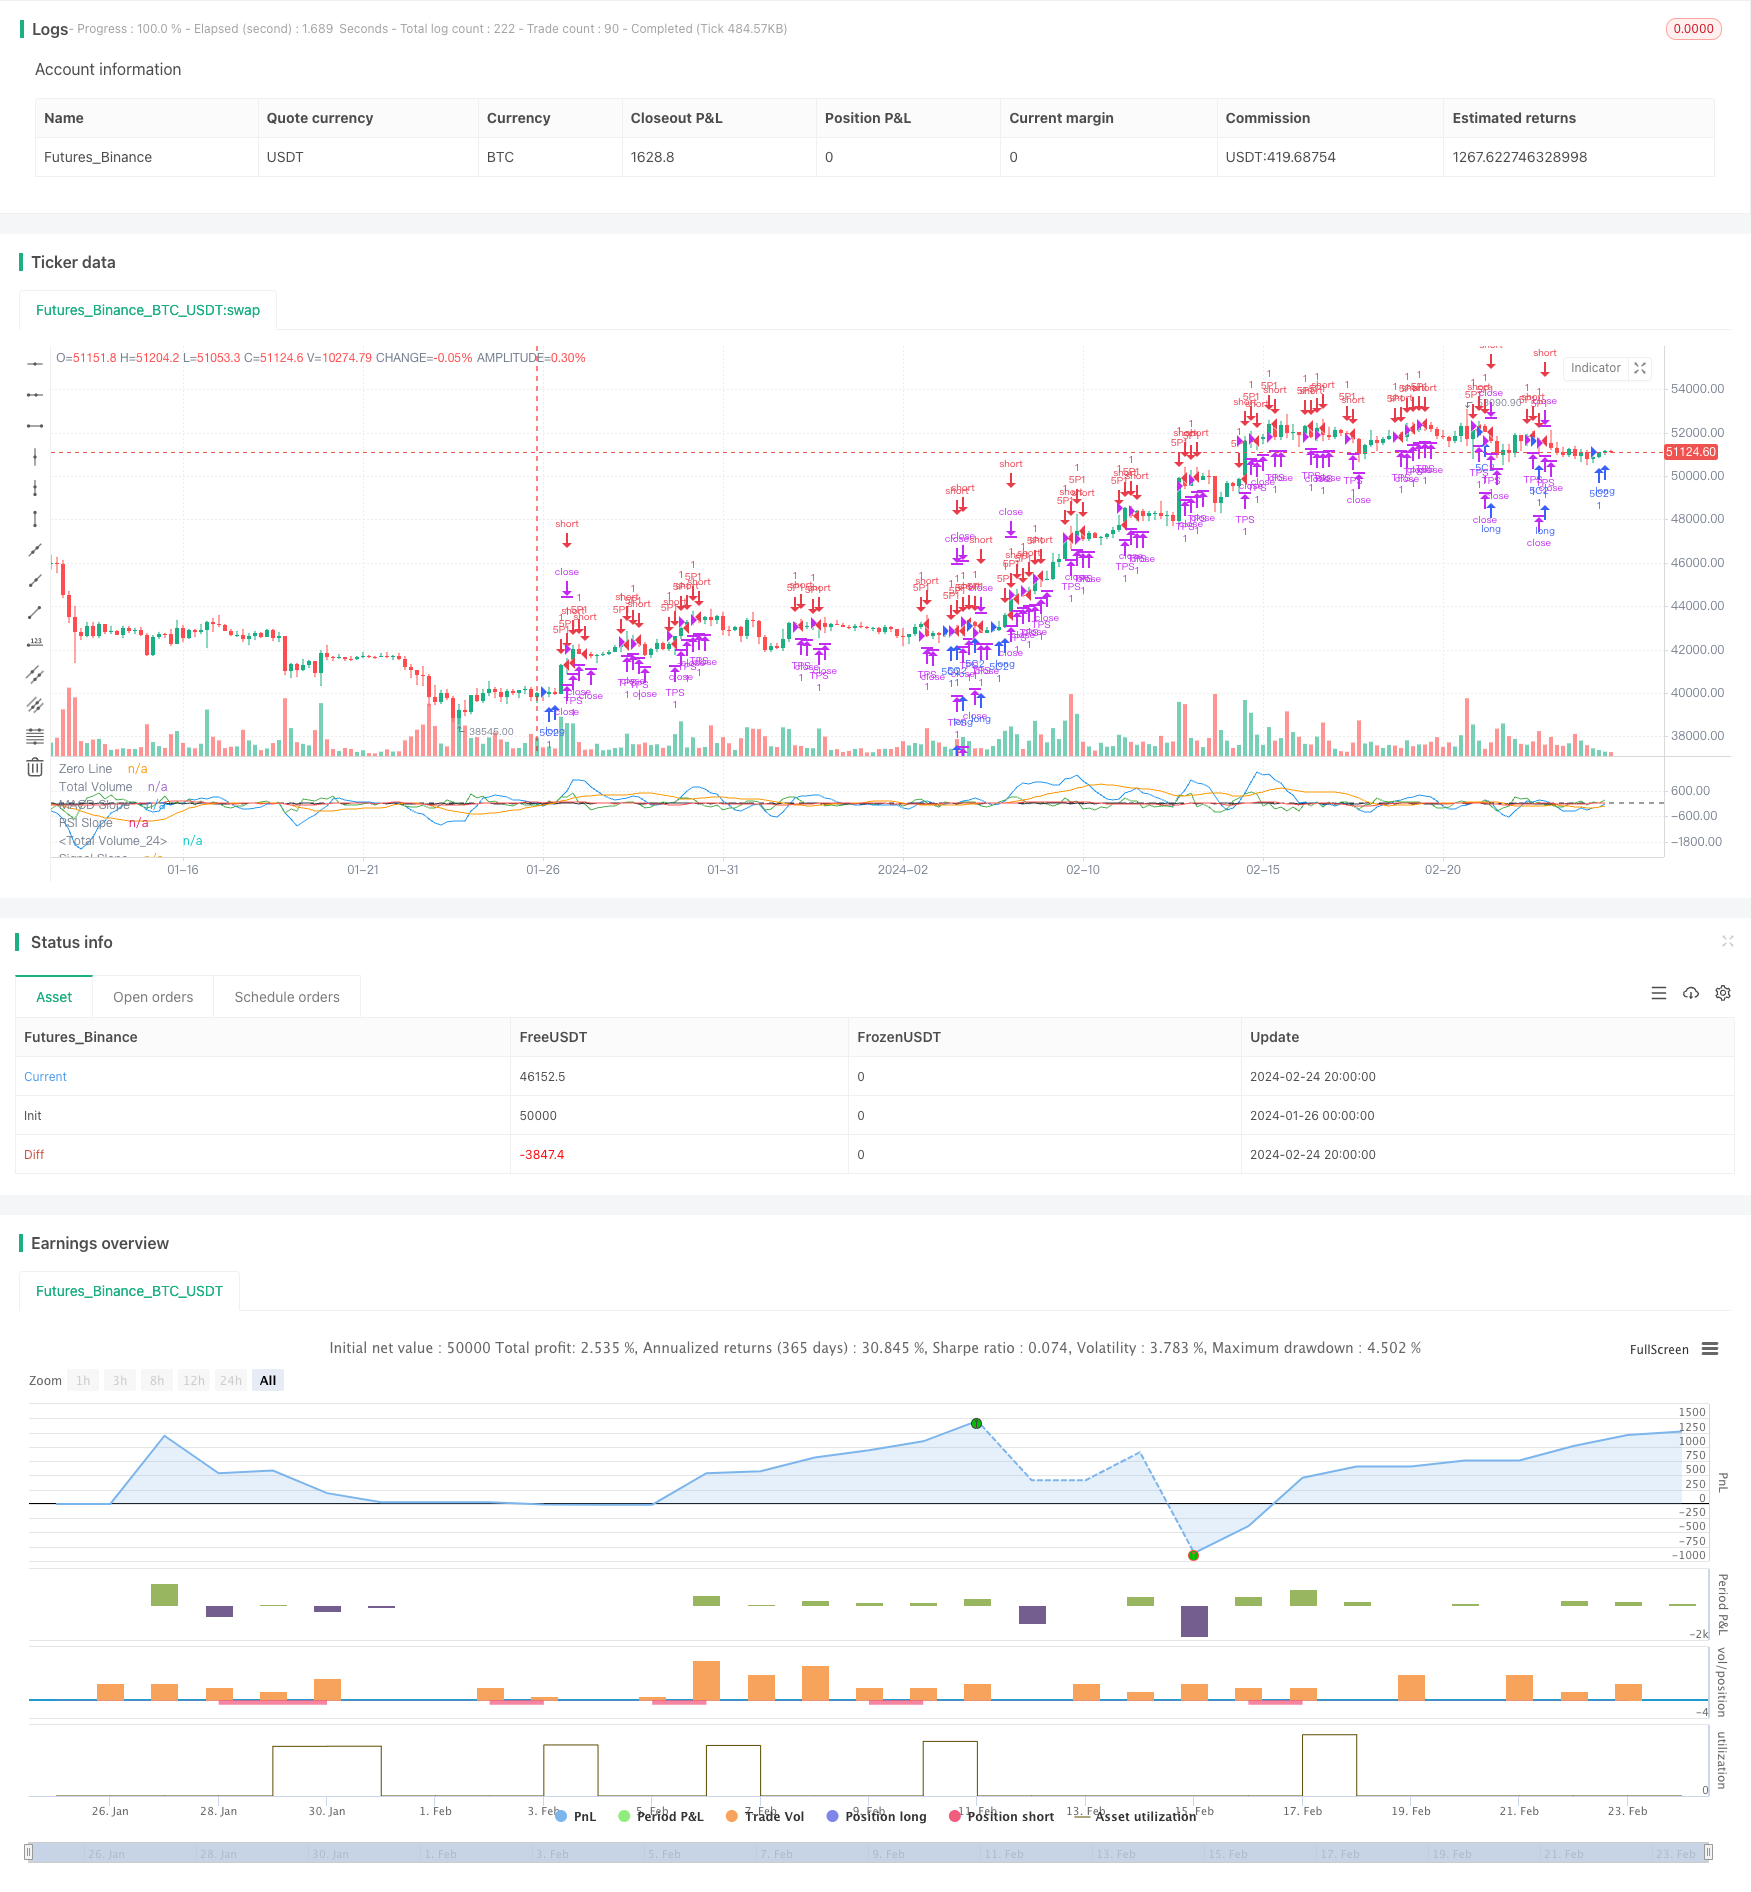
The Three Factors Model for Price Oscillation Detection is a short-term trading strategy that integrates multiple factors for judgment. This strategy takes into account factors like volume ratio, RSI, MACD, and signal line to detect price oscillations and discover short-term trading opportunities.
Strategy Logic
The core logic of this strategy is:
Calculate technical indicators like fast MA, slow MA, MACD, and signal line;
Judge multiple factor conditions including volume ratio, RSI, MACD and signal line;
Confirm the current price oscillation stage and buy/sell opportunities based on multiple factors analysis;
Take LONG or SHORT positions and set take profit and stop loss;
Close positions when price reaches take profit or stop loss.
This strategy flexibly uses factors like volume ratio, RSI, MACD and signal line to detect price oscillations and capture short-term opportunities. The combination of multiple factors helps avoid false signals from a single factor and improves accuracy.
Advantage Analysis
The advantages of this strategy:
- Multiple factors improve accuracy and avoid false signals;
- Capture short-term opportunities from price oscillations with large profit room;
- Automatically set take profit and stop loss to control risks;
- Simple and clear logic, easy to implement.
Risk Analysis
The risks of this strategy:
- Algorithm relies too much on historical data, sensitive to market changes;
- The combination approach of multiple factors may need further optimization, with possibility of misjudgment;
- The stop loss point directly affects the stability of the strategy.
To address the above risks, optimizations can be made in:
- Expand sample cycle to reduce impact from market data changes;
- Adjust weights between factors to achieve adaptive optimization;
- Test different stop loss points to find the optimal position.
Optimization Directions
The main optimization directions:
Optimize factor weights dynamically. Weights can be adjusted based on market conditions to improve adaptiveness;
Introduce machine learning algorithms to achieve adaptive optimization of factors. Algorithms like neural networks and genetic algorithms can be used to train the model and optimize parameters;
Optimize stop loss strategies. Different combinations of tracking stop loss and moving stop loss can be tested to find the best solution;
Incorporate advanced technical indicators. More indicators like volatility swing and momentum oscillation can enrich the factors.
Conclusion
The Three Factors Model for Price Oscillation Detection fully utilizes the characteristics of price oscillations to implement an efficient short-term trading strategy. It judges the best entry and exit points based on multiple factors like volume, RSI, MACD and signal line. The multiple factors enhance accuracy and lead to steady returns. Further optimizations can be done through machine learning for adaptive optimization, resulting in even better strategy performance.
Parameters
| Name | Default | What it controls |
|---|---|---|
| v_input_1 | 0.26 | Signal Bias |
| v_input_2 | 0.7 | MACD Bias |
| v_input_3 | 3 | Short LookBack |
| v_input_4 | 6 | Long LookBack |
| v_input_5 | 2 | Take Profit |
| v_input_6 | 0.7 | Stop Loss |
Source Pine Script
/*backtest
start: 2024-01-26 00:00:00
end: 2024-02-25 00:00:00
period: 4h
basePeriod: 15m
exchanges: [{"eid":"Futures_Binance","currency":"BTC_USDT"}]
*/

//@version=5
strategy("3 10.0 Oscillator Profile Flagging", shorttitle="3 10.0 Oscillator Profile Flagging", overlay=false)

signalBiasValue = input(title="Signal Bias", defval=0.26)
macdBiasValue = input(title="MACD Bias", defval=0.7)
shortLookBack = input( title="Short LookBack", defval=3)
longLookBack = input( title="Long LookBack", defval=6)
takeProfit = input( title="Take Profit", defval=2)
stopLoss = input( title="Stop Loss", defval=0.7)

fast_ma = ta.sma(close, 3)
slow_ma = ta.sma(close, 10)
macd = fast_ma - slow_ma
signal = ta.sma(macd, 16)
hline(0, "Zero Line", color = color.black)

buyVolume = volume*((close-low)/(high-low))
sellVolume = volume*((high-close)/(high-low))
buyVolSlope = buyVolume - buyVolume[1]
sellVolSlope = sellVolume - sellVolume[1]
signalSlope = ( signal - signal[1] )
macdSlope = ( macd - macd[1] )
plot(macd, color=color.blue, title="Total Volume")
plot(signal, color=color.orange, title="Total Volume")
plot(macdSlope, color=color.green, title="MACD Slope")
plot(signalSlope, color=color.red, title="Signal Slope")
intrabarRange = high - low
rsi = ta.rsi(close, 14)
rsiSlope = rsi - rsi[1]
plot(rsiSlope, color=color.black, title="RSI Slope")

getRSISlopeChange(lookBack) =>
    j = 0
    for i = 0 to lookBack
        if ( rsi[i] - rsi[ i + 1 ] ) > -5
            j += 1
    j

getBuyerVolBias(lookBack) =>
    j = 0
    for i = 1 to lookBack
        if buyVolume[i] > sellVolume[i]
            j += 1
    j

getSellerVolBias(lookBack) =>
    j = 0
    for i = 1 to lookBack
        if sellVolume[i] > buyVolume[i]
            j += 1
    j

getVolBias(lookBack) =>
    float b = 0.0
    float s = 0.0
    for i = 1 to lookBack
        b += buyVolume[i]
        s += sellVolume[i]
    b > s

getSignalBuyerBias(lookBack) =>
    j = 0
    for i = 1 to lookBack
        if signal[i] > signalBiasValue
            j += 1
    j

getSignalSellerBias(lookBack) =>
    j = 0
    for i = 1 to lookBack
        if signal[i] < ( 0.0 - signalBiasValue )
            j += 1
    j

getSignalNoBias(lookBack) =>
    j = 0
    for i = 1 to lookBack
        if signal[i] < signalBiasValue and signal[i] > ( 0.0 - signalBiasValue )
            j += 1
    j

getPriceRising(lookBack) =>
    j = 0
    for i = 1 to lookBack
        if close[i] > close[i + 1]
            j += 1
    j


getPriceFalling(lookBack) =>
    j = 0
    for i = 1 to lookBack
        if close[i] < close[i + 1]
            j += 1
    j

getRangeNarrowing(lookBack) =>
    j = 0
    for i = 1 to lookBack
        if intrabarRange[i] < intrabarRange[i + 1]
            j+= 1
    j

getRangeBroadening(lookBack) =>
    j = 0
    for i = 1 to lookBack
        if intrabarRange[i] > intrabarRange[i + 1]
            j+= 1
    j

bool isNegativeSignalReversal = signalSlope < 0.0 and signalSlope[1] > 0.0
bool isNegativeMacdReversal = macdSlope < 0.0 and macdSlope[1] > 0.0

bool isPositiveSignalReversal = signalSlope > 0.0 and signalSlope[1] < 0.0
bool isPositiveMacdReversal = macdSlope > 0.0 and macdSlope[1] < 0.0

bool hasBearInversion = signalSlope > 0.0 and macdSlope < 0.0
bool hasBullInversion = signalSlope < 0.0 and macdSlope > 0.0

bool hasSignalBias = math.abs(signal) >= signalBiasValue
bool hasNoSignalBias = signal < signalBiasValue and signal > ( 0.0 - signalBiasValue )

bool hasSignalBuyerBias = hasSignalBias and signal > 0.0
bool hasSignalSellerBias = hasSignalBias and signal < 0.0

bool hasPositiveMACDBias = macd > macdBiasValue
bool hasNegativeMACDBias = macd < ( 0.0 - macdBiasValue )

bool hasBullAntiPattern = ta.crossunder(macd, signal)
bool hasBearAntiPattern = ta.crossover(macd, signal)

bool hasSignificantBuyerVolBias = buyVolume > ( sellVolume * 1.5 )
bool hasSignificantSellerVolBias = sellVolume > ( buyVolume * 1.5 )


// 202.30 Profit 55.29% 5m
if ( ( getVolBias(longLookBack) == false ) and rsi <= 41 and math.abs(rsi - rsi[shortLookBack]) > 1 and hasNoSignalBias and rsiSlope > 1.5 and close > open)
    strategy.entry("5C1", strategy.long, qty=1.0)
strategy.exit("TPS", "5C1", limit=strategy.position_avg_price + takeProfit, stop=strategy.position_avg_price - stopLoss)

// 171.70 Profit 50.22% 5m
if ( getVolBias(longLookBack) == true and rsi > 45 and rsi < 55 and macdSlope > 0 and signalSlope > 0)
    strategy.entry("5C2", strategy.long, qty=1.0)
strategy.exit("TPS", "5C2", limit=strategy.position_avg_price + takeProfit, stop=strategy.position_avg_price - stopLoss)

// 309.50 Profit 30.8% 5m 2 tp .7 sl 289 trades
if ( macd > macdBiasValue and macdSlope > 0)
    strategy.entry("5P1", strategy.short, qty=1.0)
strategy.exit("TPS", "5P1", limit=strategy.position_avg_price - takeProfit, stop=strategy.position_avg_price + stopLoss)
Published by ChaoZhang on the FMZ strategy square · last modified 2024-02-26. Collected in the Quant Trading Vault. Unvalidated research: re-test with your own data and costs before trusting it.
Build this with AgenKit
A spec is not a trading system. Paste this into your coding agent and AgenKit runs a specialist team — architecture, test-first build, risk gates, review — with paper trading on by default.
/agenkit build a production-grade trading bot with a backtest engine, risk controls and paper trading by default from strategies/Three-Factors-Model-for-Price-Oscillation-Detection.md- npx agenkit install engineering-kit in your project
- Paste the command into your agent and approve each phase
- Get tests, backtest, risk controls and a paper-trading switch
Understand it first
Before you run this, read the lesson behind the idea and how to backtest it honestly. Specs like this one are the survivors of an unknown number of trials; deflate their results accordingly.
Related specs
- EMA and RSI Quantitative Trading StrategyPine Script · Machine learning · 1h
- MACD Robot Trading StrategyPine Script · Machine learning · 1d
- Multi Indicator Dynamic Adaptive Quantitative Trading StrategyPine Script · Machine learning · 1h
- Triple Moving Average Combined with MACD Quantitative StrategyPine Script · Machine learning · 1d
- Johns Bitcoin Intraday Trading Strategy Based on Multiple IndicatorsPine Script · Machine learning · 1m
- London MACD RSI Bitcoin Trading StrategyPine Script · Machine learning · 1m