Strategy vault / Machine learning
Trading Strategy Based on RSI and MACD Indicators
This strategy combines the Relative Strength Index (RSI) and Moving Average Convergence Divergence (MACD) indicators to identify trading opportunities for BTC. It goes long when RSI is below 30 and MACD line is below…
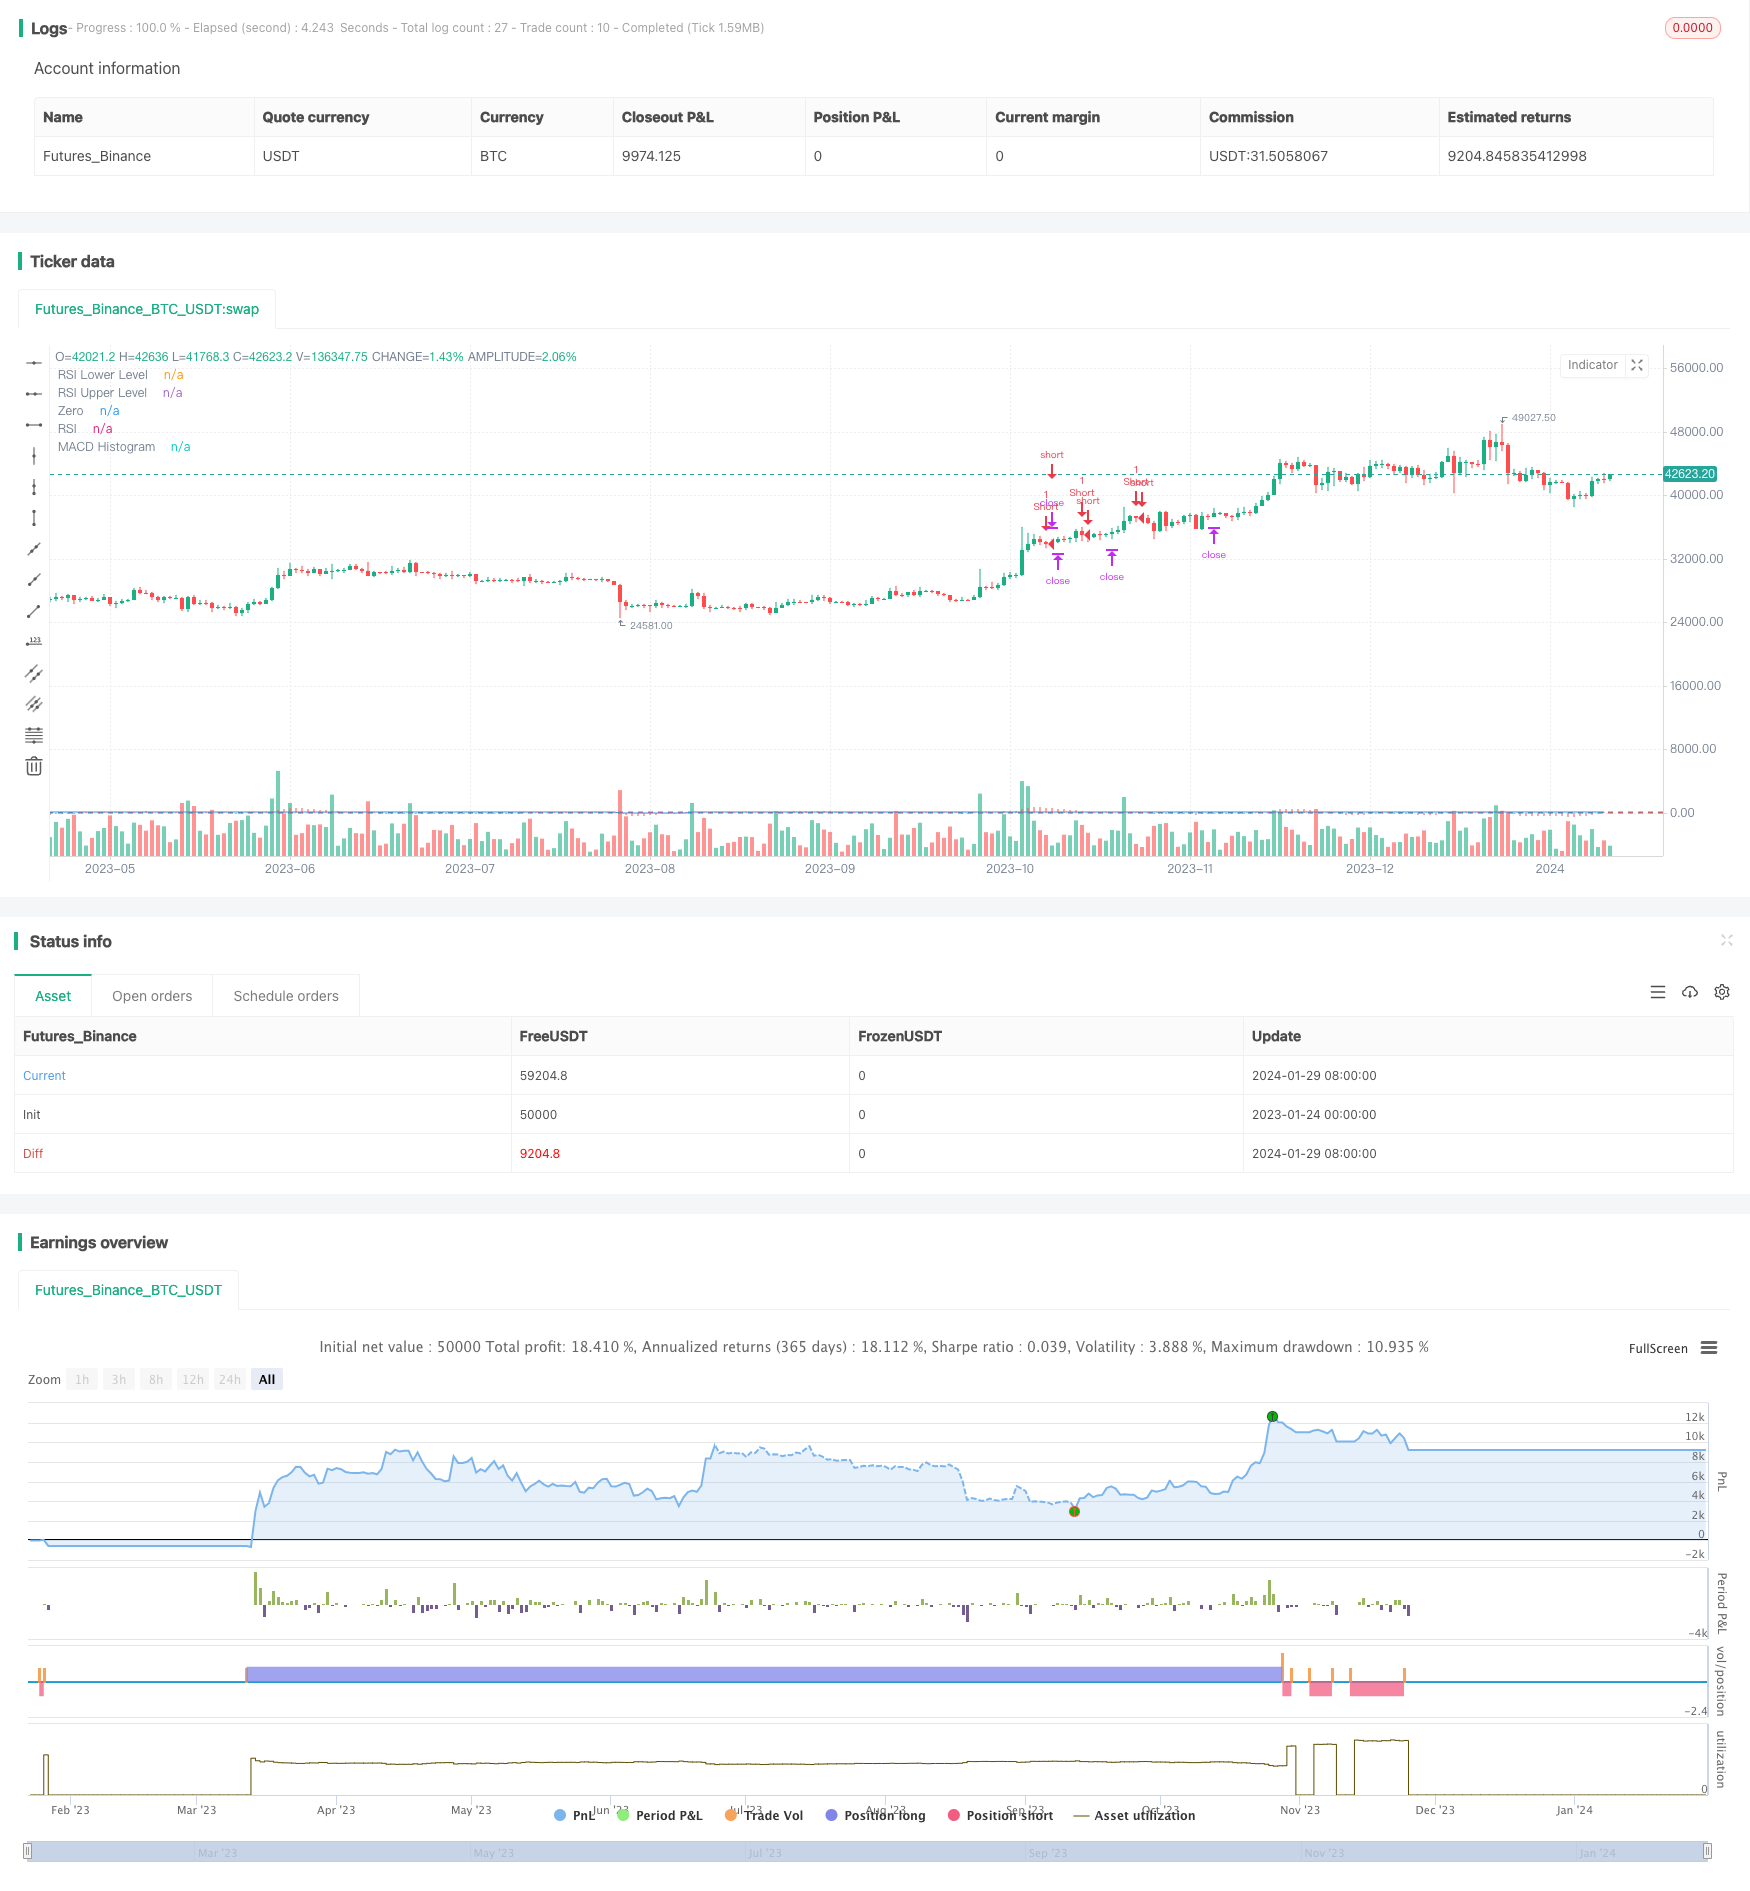
Overview
This strategy combines the Relative Strength Index (RSI) and Moving Average Convergence Divergence (MACD) indicators to identify trading opportunities for BTC. It goes long when RSI is below 30 and MACD line is below signal line and MACD Histogram is less than -100; it goes short when RSI is above 80 and MACD line is above signal line and MACD Histogram is greater than 250. The strategy also uses a trailing stop loss to lock in profits.
Strategy Logic
Use the RSI indicator to determine if the market is oversold or overbought. RSI below 30 is viewed as an oversold signal, while above 80 is viewed as an overbought signal.
Use the MACD indicator's MACD line and signal line crossovers to determine entries and exits. When the MACD line crosses above the signal line, it is a buy signal; when the MACD line crosses below the signal line, it is a sell signal.
Combine the signals from RSI and MACD indicators to form the entry rules for this strategy.
Use a trailing stop loss to lock in profits. The trailing stop loss updates dynamically based on profit/loss of an open position, allowing effective risk control.
Advantage Analysis
Combining RSI and MACD indicators helps filter out false signals effectively.
RSI is good at detecting overbought/oversold market conditions. MACD captures trend changes well. Using both creates a strong strategy.
Trailing stop loss locks in profits according to live market movements, controlling risk.
The strategy has few parameters and is easy to implement.
Risk Analysis
Single instrument risk from trading only BTC.
RSI may generate false signals during range-bound and bottom-reversal scenarios. MACD oscillators can also provide erroneous signals in choppy markets.
Trailing stop loss could be hit hard during huge market swings, failing to control risk.
Poor parameter tuning may lead to overtrading or missed trades.
Enhancement Opportunities
Consider adding other indicators like Bollinger Bands, KD etc. to supplement trade signals.
Study inter-market correlation between different instruments, build multi-pair mean reversion strategies.
Optimize stop loss mechanisms e.g. timely stop loss, average stop loss etc.
Incorporate machine learning for smart parameter optimization.
Summary
This is a trend-following strategy based on RSI and MACD indicators to determine overbought/oversold scenarios. It combines the strengths of technical indicators well to capture trend changes in the market. Meanwhile, the strategy logic is simple and easy to implement. Further optimizations can expand its applications.
Parameters
| Name | Default | What it controls |
|---|---|---|
| v_input_1 | 14 | RSI Period |
| v_input_2 | 12 | MACD Short Period |
| v_input_3 | 26 | MACD Long Period |
| v_input_4 | 9 | MACD Signal Period |
| v_input_float_1 | 2.5 | Trailing Stop Loss Factor |
Source Pine Script
/*backtest
start: 2023-01-24 00:00:00
end: 2024-01-30 00:00:00
period: 1d
basePeriod: 1h
exchanges: [{"eid":"Futures_Binance","currency":"BTC_USDT"}]
*/

//@version=5
strategy("BTC/USDT RSI and MACD Strategy", overlay = true)

// Define the RSI period
rsiPeriod = input(14, "RSI Period")

// Calculate the RSI
rsi = ta.rsi(close, rsiPeriod)

// Define the MACD parameters
macdShort = input(12, "MACD Short Period")
macdLong = input(26, "MACD Long Period")
macdSignal = input(9, "MACD Signal Period")

// Calculate the MACD
[macdLine, signalLine, _] = ta.macd(close, macdShort, macdLong, macdSignal)

// Define the trailing stop level
trailing_stop_loss_factor = input.float(2.50, "Trailing Stop Loss Factor", step = 0.01)

// Define the entry and exit conditions
enterLong = ta.crossover(rsi, 30) and macdLine < signalLine and macdLine < -100
enterShort = ta.crossunder(rsi, 83) and macdLine > signalLine and macdLine > 250

// Submit the orders
if (enterLong)
    strategy.entry("Long", strategy.long)
if (enterShort)
    strategy.entry("Short", strategy.short)

// Trailing Stop Loss
longTrailingStopLoss = strategy.position_avg_price * (1 - trailing_stop_loss_factor / 100)
shortTrailingStopLoss = strategy.position_avg_price * (1 + trailing_stop_loss_factor / 100)
if strategy.position_size > 0
    strategy.exit("Exit Long", "Long", stop  = longTrailingStopLoss)
if strategy.position_size < 0
    strategy.exit("Exit Short", "Short", stop = shortTrailingStopLoss)

// Plot the indicators
plot(rsi, "RSI", color=color.blue)
hline(20, "RSI Lower Level", color=color.green)
hline(80, "RSI Upper Level", color=color.red)
plot(macdLine - signalLine, "MACD Histogram", color=color.red, style=plot.style_histogram)
hline(0, "Zero", color=color.gray)
Published by ChaoZhang on the FMZ strategy square · last modified 2024-01-31. Collected in the Quant Trading Vault. Unvalidated research: re-test with your own data and costs before trusting it.
Build this with AgenKit
A spec is not a trading system. Paste this into your coding agent and AgenKit runs a specialist team — architecture, test-first build, risk gates, review — with paper trading on by default.
/agenkit build a production-grade trading bot with a backtest engine, risk controls and paper trading by default from strategies/Trading-Strategy-Based-on-RSI-and-MACD-Indicators.md- npx agenkit install engineering-kit in your project
- Paste the command into your agent and approve each phase
- Get tests, backtest, risk controls and a paper-trading switch
Understand it first
Before you run this, read the lesson behind the idea and how to backtest it honestly. Specs like this one are the survivors of an unknown number of trials; deflate their results accordingly.
Related specs
- EMA and RSI Quantitative Trading StrategyPine Script · Machine learning · 1h
- Triple Moving Average Combined with MACD Quantitative StrategyPine Script · Machine learning · 1d
- London MACD RSI Bitcoin Trading StrategyPine Script · Machine learning · 1m
- Multi indicator Assisted StrategyPine Script · Machine learning · 1d
- SMA and RSI Combination Trading StrategyPine Script · Machine learning · 2d
- Market Structure Swing Trading StrategyPine Script · Machine learning · 1d