Transient Zones Strategy
The Transient Zones strategy is a short-term trading strategy based on price fluctuation zones. It uses the fluctuation zones formed by prices within a certain time period to judge market trends and take positions…
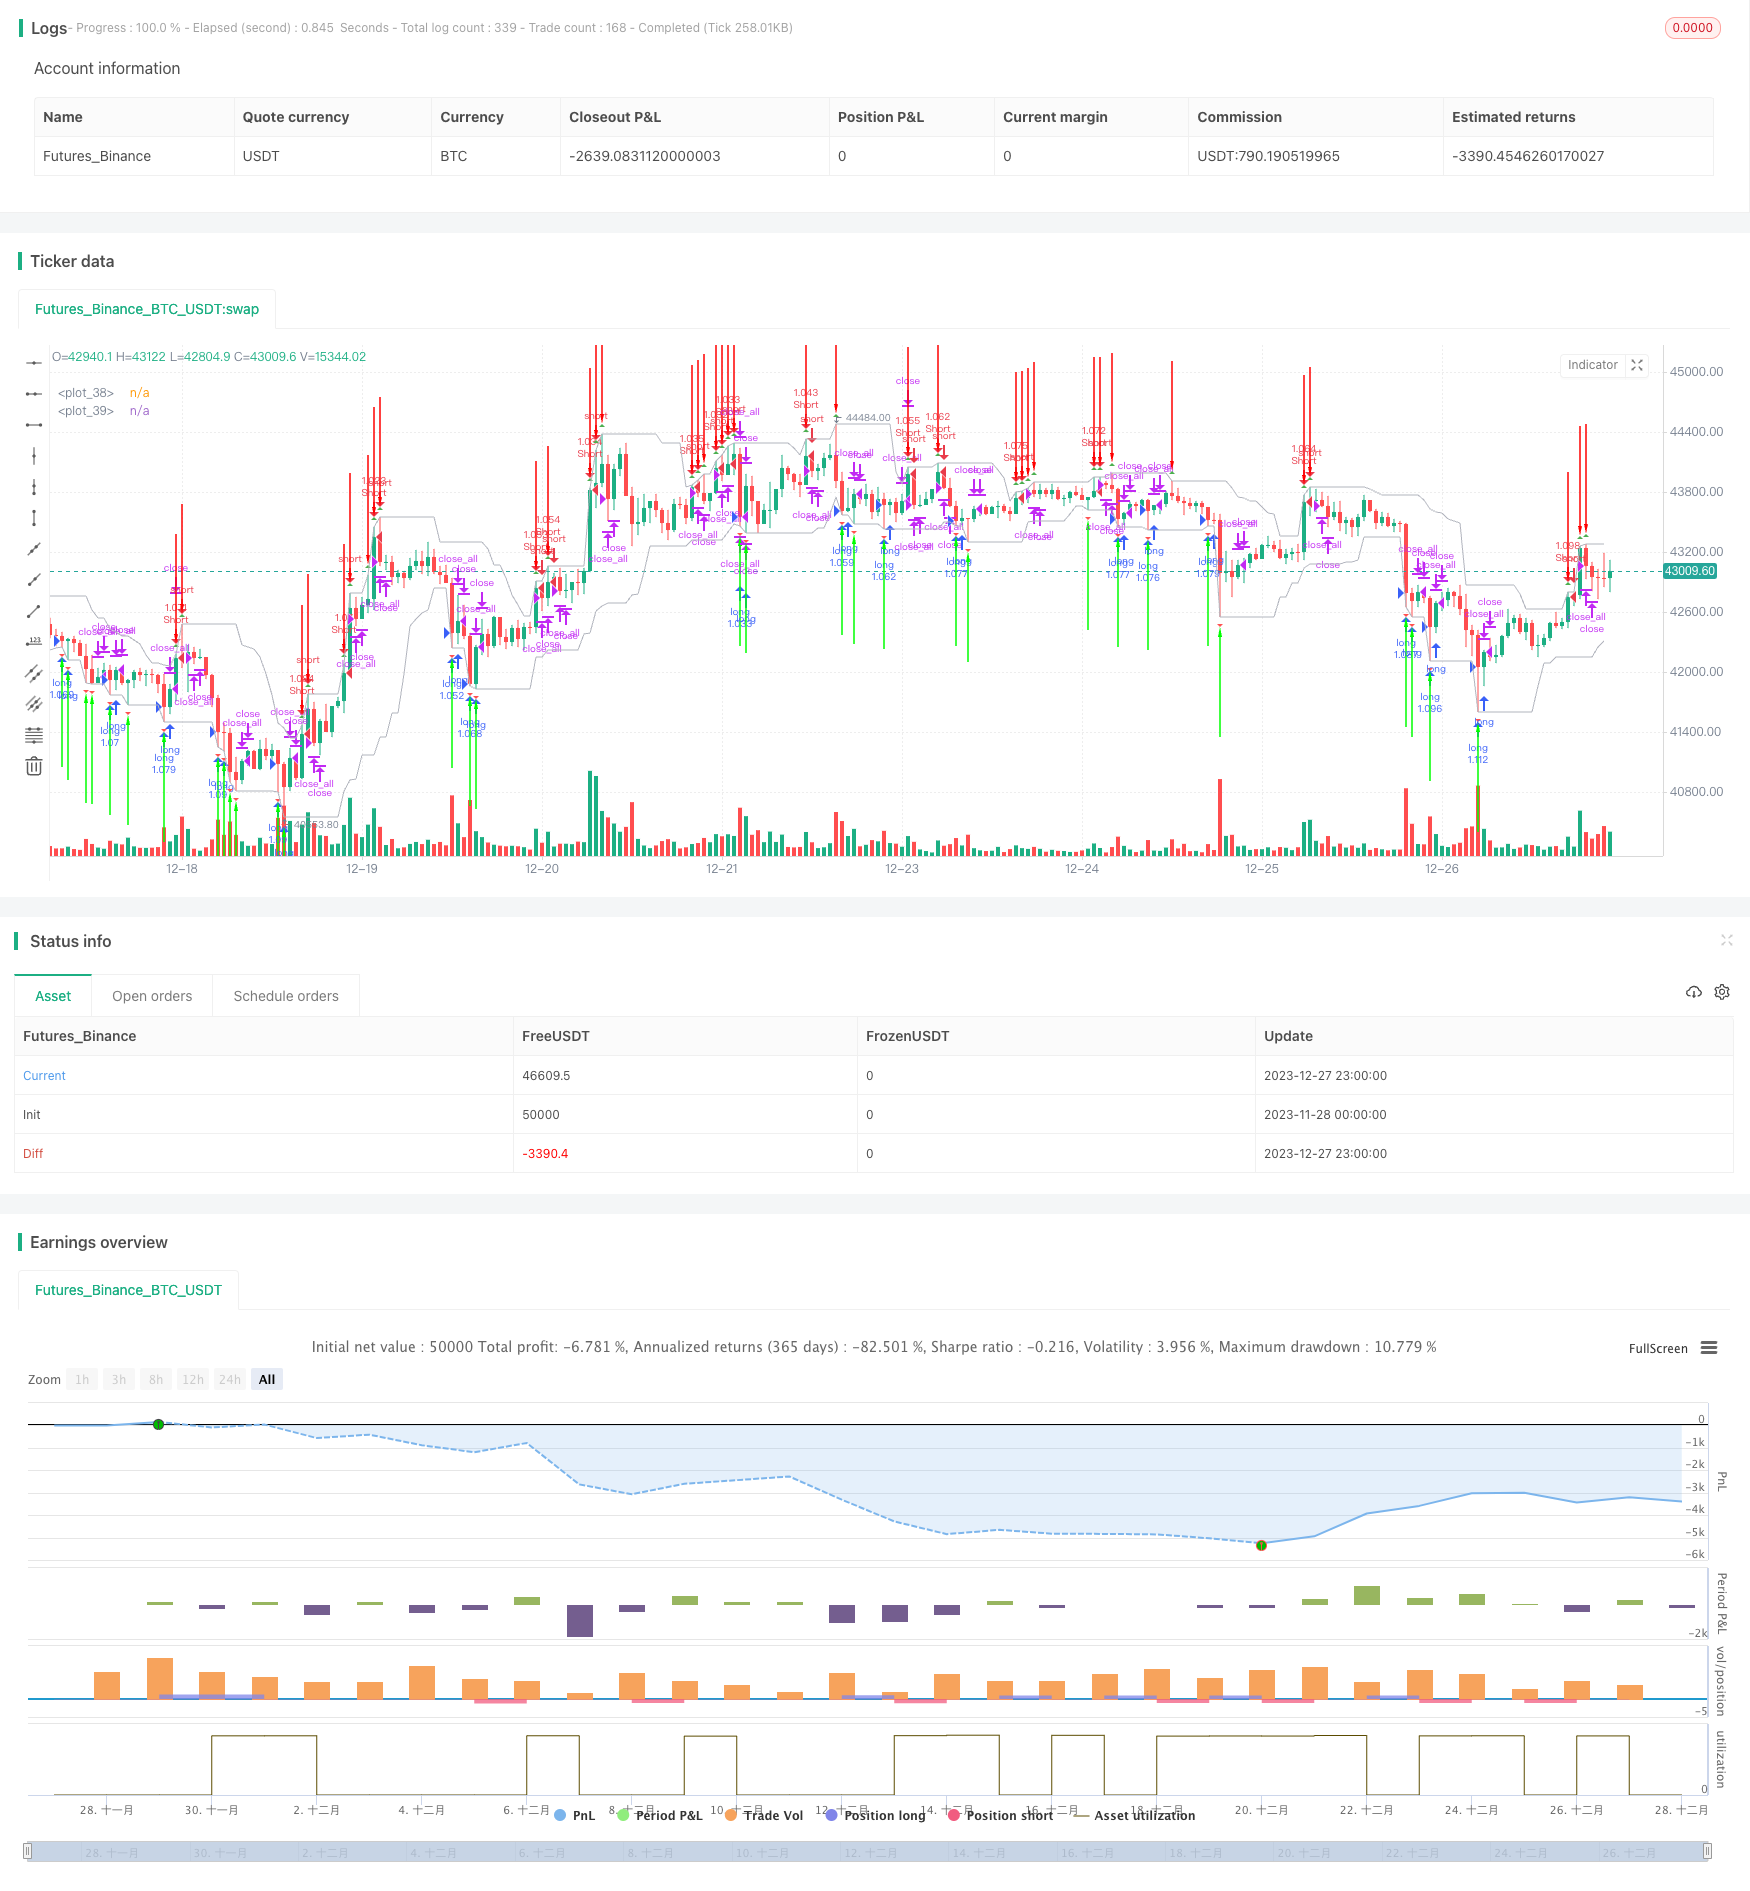
Overview
The Transient Zones strategy is a short-term trading strategy based on price fluctuation zones. It uses the fluctuation zones formed by prices within a certain time period to judge market trends and take positions when the zones are penetrated.
Strategy Logic
The strategy calculates the highest and lowest prices of the past N candlesticks to construct a price fluctuation zone. When the latest candlestick penetrates this zone, it judges that a trend reversal has occurred and generates trading signals.
Specifically, the strategy continuously tracks the highest and lowest prices of the last N candlesticks (adjustable parameter N), where:
- Lowest price = lowest point in past N candlesticks
- Highest price = highest point in past N candlesticks
This constructs the price fluctuation zone.
When the close price of the latest candlestick is higher than the highest price of the zone, it signals that the zone has been penetrated, generating a long signal; when the close price is lower than the lowest price of the zone, it signals that the zone has been penetrated, generating a short signal.
In addition, the strategy also incorporates color and body filters. The color filter filters signals based on the color of the candlestick; the body filter filters signals based on the size of the candlestick body. This helps filter out some false signals.
Advantages
The strategy has the following advantages:
- Captures price zones and determines trend reversal points for accurate long/short entries
- Color and body filters help filter out false signals
- Simple and clear strategy logic, easy to understand and adjust parameters
- Many adjustable parameters allow optimizing the strategy
Risks
The strategy also has some risks:
- Inappropriate parameter settings may cause over-trading and high fees
- Incorrect zone range settings may generate too many false breakout signals
- Poor price zone prediction power during violent market swings
- Unable to handle price gaps
These risks can be reduced by adjusting zone parameters, optimizing signal filters etc.
Optimization Directions
The strategy can be optimized in several directions:
- Dynamically adjust the price zone range instead of fixed N candlesticks
- Incorporate stop loss logic to limit losses
- Optimize filter parameters to improve signal quality
- Add logic to handle price gaps
- Combine multiple timeframes to judge signals and avoid traps
Conclusion
The Transient Zones strategy is an easy-to-use short-term trading strategy overall. It determines trend reversal points through price zones and can quickly capitalize on market opportunities. It also has some risks to note. Further improvements can be made through parameter adjustment and optimization to enhance profitability.
Parameters
| Name | Default | What it controls |
|---|---|---|
| v_input_1 | true | Long |
| v_input_2 | true | Short |
| v_input_3 | 100 | Capital, % |
| v_input_4 | true | Use Color-Filter |
| v_input_5 | true | Use Body-Filter |
| v_input_6 | 10 | H left |
| v_input_7 | 5000 | Sample bars for % TZ |
| v_input_8 | true | Show PTZ |
| v_input_9 | true | Show channel |
| v_input_10 | 2018 | From Year |
| v_input_11 | 2100 | To Year |
| v_input_12 | true | From Month |
| v_input_13 | 12 | To Month |
| v_input_14 | true | From day |
| v_input_15 | 31 | To day |
Source Pine Script
/*backtest
start: 2023-11-28 00:00:00
end: 2023-12-28 00:00:00
period: 1h
basePeriod: 15m
exchanges: [{"eid":"Futures_Binance","currency":"BTC_USDT"}]
*/

//Noro
//2018

//@version=2
strategy("Noro's Transient Zones Strategy v1.0", shorttitle = "TZ str 1.0", overlay=true, default_qty_type = strategy.percent_of_equity, default_qty_value = 100, pyramiding = 0)

//Settings
needlong = input(true, defval = true, title = "Long")
needshort = input(true, defval = true, title = "Short")
capital = input(100, defval = 100, minval = 1, maxval = 10000, title = "Capital, %")

usecol = input(true, defval = true, title = "Use Color-Filter")
usebod = input(true, defval = true, title = "Use Body-Filter")

h_left = input(title = "H left", defval = 10)
h_right = -1
sample_period = input(title = "Sample bars for % TZ",  defval = 5000)
show_ptz = input(title = "Show PTZ", type = bool, defval = true)
show_channel = input(title = "Show channel", type = bool, defval = true)

fromyear = input(2018, defval = 2018, minval = 1900, maxval = 2100, title = "From Year")
toyear = input(2100, defval = 2100, minval = 1900, maxval = 2100, title = "To Year")
frommonth = input(01, defval = 01, minval = 01, maxval = 12, title = "From Month")
tomonth = input(12, defval = 12, minval = 01, maxval = 12, title = "To Month")
fromday = input(01, defval = 01, minval = 01, maxval = 31, title = "From day")
today = input(31, defval = 31, minval = 01, maxval = 31, title = "To day")

//By Jurij w/ TZ percent occurrence by SPYderCrusher

//barCount = nz(barCount[1]) + 1
//check history and realtime PTZ
h_left_low = lowest(h_left)
h_left_high = highest(h_left)
newlow = low <= h_left_low
newhigh = high >= h_left_high
plotshape(newlow and show_ptz, style=shape.triangledown, location=location.belowbar, color=red)
plotshape(newhigh and show_ptz, style=shape.triangleup, location=location.abovebar, color=green)
channel_high = plot(show_channel ? h_left_low : 0, color=silver)
channel_low = plot (show_channel ? h_left_high : 0, color=silver)

//check true TZ back in history
central_bar_low = low[h_right + 1]
central_bar_high = high[h_right + 1]
full_zone_low = lowest(h_left + h_right + 1)
full_zone_high = highest(h_left + h_right + 1)
central_bar_is_highest = central_bar_high >= full_zone_high
central_bar_is_lowest = central_bar_low <= full_zone_low
plotarrow(central_bar_is_highest ? -1 : 0, offset=-h_right-1)
plotarrow(central_bar_is_lowest ? 1 : 0, offset=-h_right-1)

//Color Filter
bar = close > open ? 1 : close < open ? -1 : 0

//Body Filter
nbody = abs(close - open)
abody = sma(nbody, 10)
body = nbody > abody / 3 or usebod == false

//Signals
up1 = central_bar_is_lowest and body and (bar == -1 or usecol == false)
dn1 = central_bar_is_highest and body and (bar == 1 or usecol == false)
exit = ((strategy.position_size > 0 and close > open) or (strategy.position_size < 0 and close < open)) and body

//Trading
lot = strategy.position_size == 0 ? strategy.equity / close * capital / 100 : lot[1]

if up1
    if strategy.position_size < 0
        strategy.close_all()

    strategy.entry("long", strategy.long, needlong == false ? 0 : lot, when=(time > timestamp(fromyear, frommonth, fromday, 00, 00) and time < timestamp(toyear, tomonth, today, 23, 59)))

if dn1
    if strategy.position_size > 0
        strategy.close_all()

    strategy.entry("Short", strategy.short, needshort == false ? 0 : lot, when=(time > timestamp(fromyear, frommonth, fromday, 00, 00) and time < timestamp(toyear, tomonth, today, 23, 59)))

if time > timestamp(toyear, tomonth, today, 23, 59) or exit
strategy.close_all()Published by ChaoZhang on the FMZ strategy square · last modified 2023-12-29. Collected in the Quant Trading Vault. Unvalidated research: re-test with your own data and costs before trusting it.
Build this with AgenKit
A spec is not a trading system. Paste this into your coding agent and AgenKit runs a specialist team — architecture, test-first build, risk gates, review — with paper trading on by default.
/agenkit build a production-grade trading bot with a backtest engine, risk controls and paper trading by default from strategies/Transient-Zones-Strategy.md- npx agenkit install engineering-kit in your project
- Paste the command into your agent and approve each phase
- Get tests, backtest, risk controls and a paper-trading switch
Understand it first
Before you run this, read the lesson behind the idea and how to backtest it honestly. Specs like this one are the survivors of an unknown number of trials; deflate their results accordingly.
Related specs
- 5 Day Moving Average Channel Breakout Strategy Combined With Mileage ConceptPine Script · Breakout · 1d
- Adaptive Bollinger Breakout with Moving Average Quantitative Strategy SystemPine Script · Breakout · 1h
- Adaptive Multi Period Trading Strategy Based on Wave Trend Momentum BreakoutPine Script · Breakout · 2h
- Adaptive Trading Strategy Based on ADX IndicatorPine Script · Breakout · 1d
- Average Line Breakthrough StrategyPine Script · Breakout · 1d
- BB Breakout StrategyPine Script · Breakout · 1d