Strategy vault / Trend following
Trend Angle Moving Average Crossover Strategy
This strategy determines the trend direction by calculating the slope angle of moving averages, combined with price change rate indicator for long and short trading. Essentially it is a trend following strategy that…
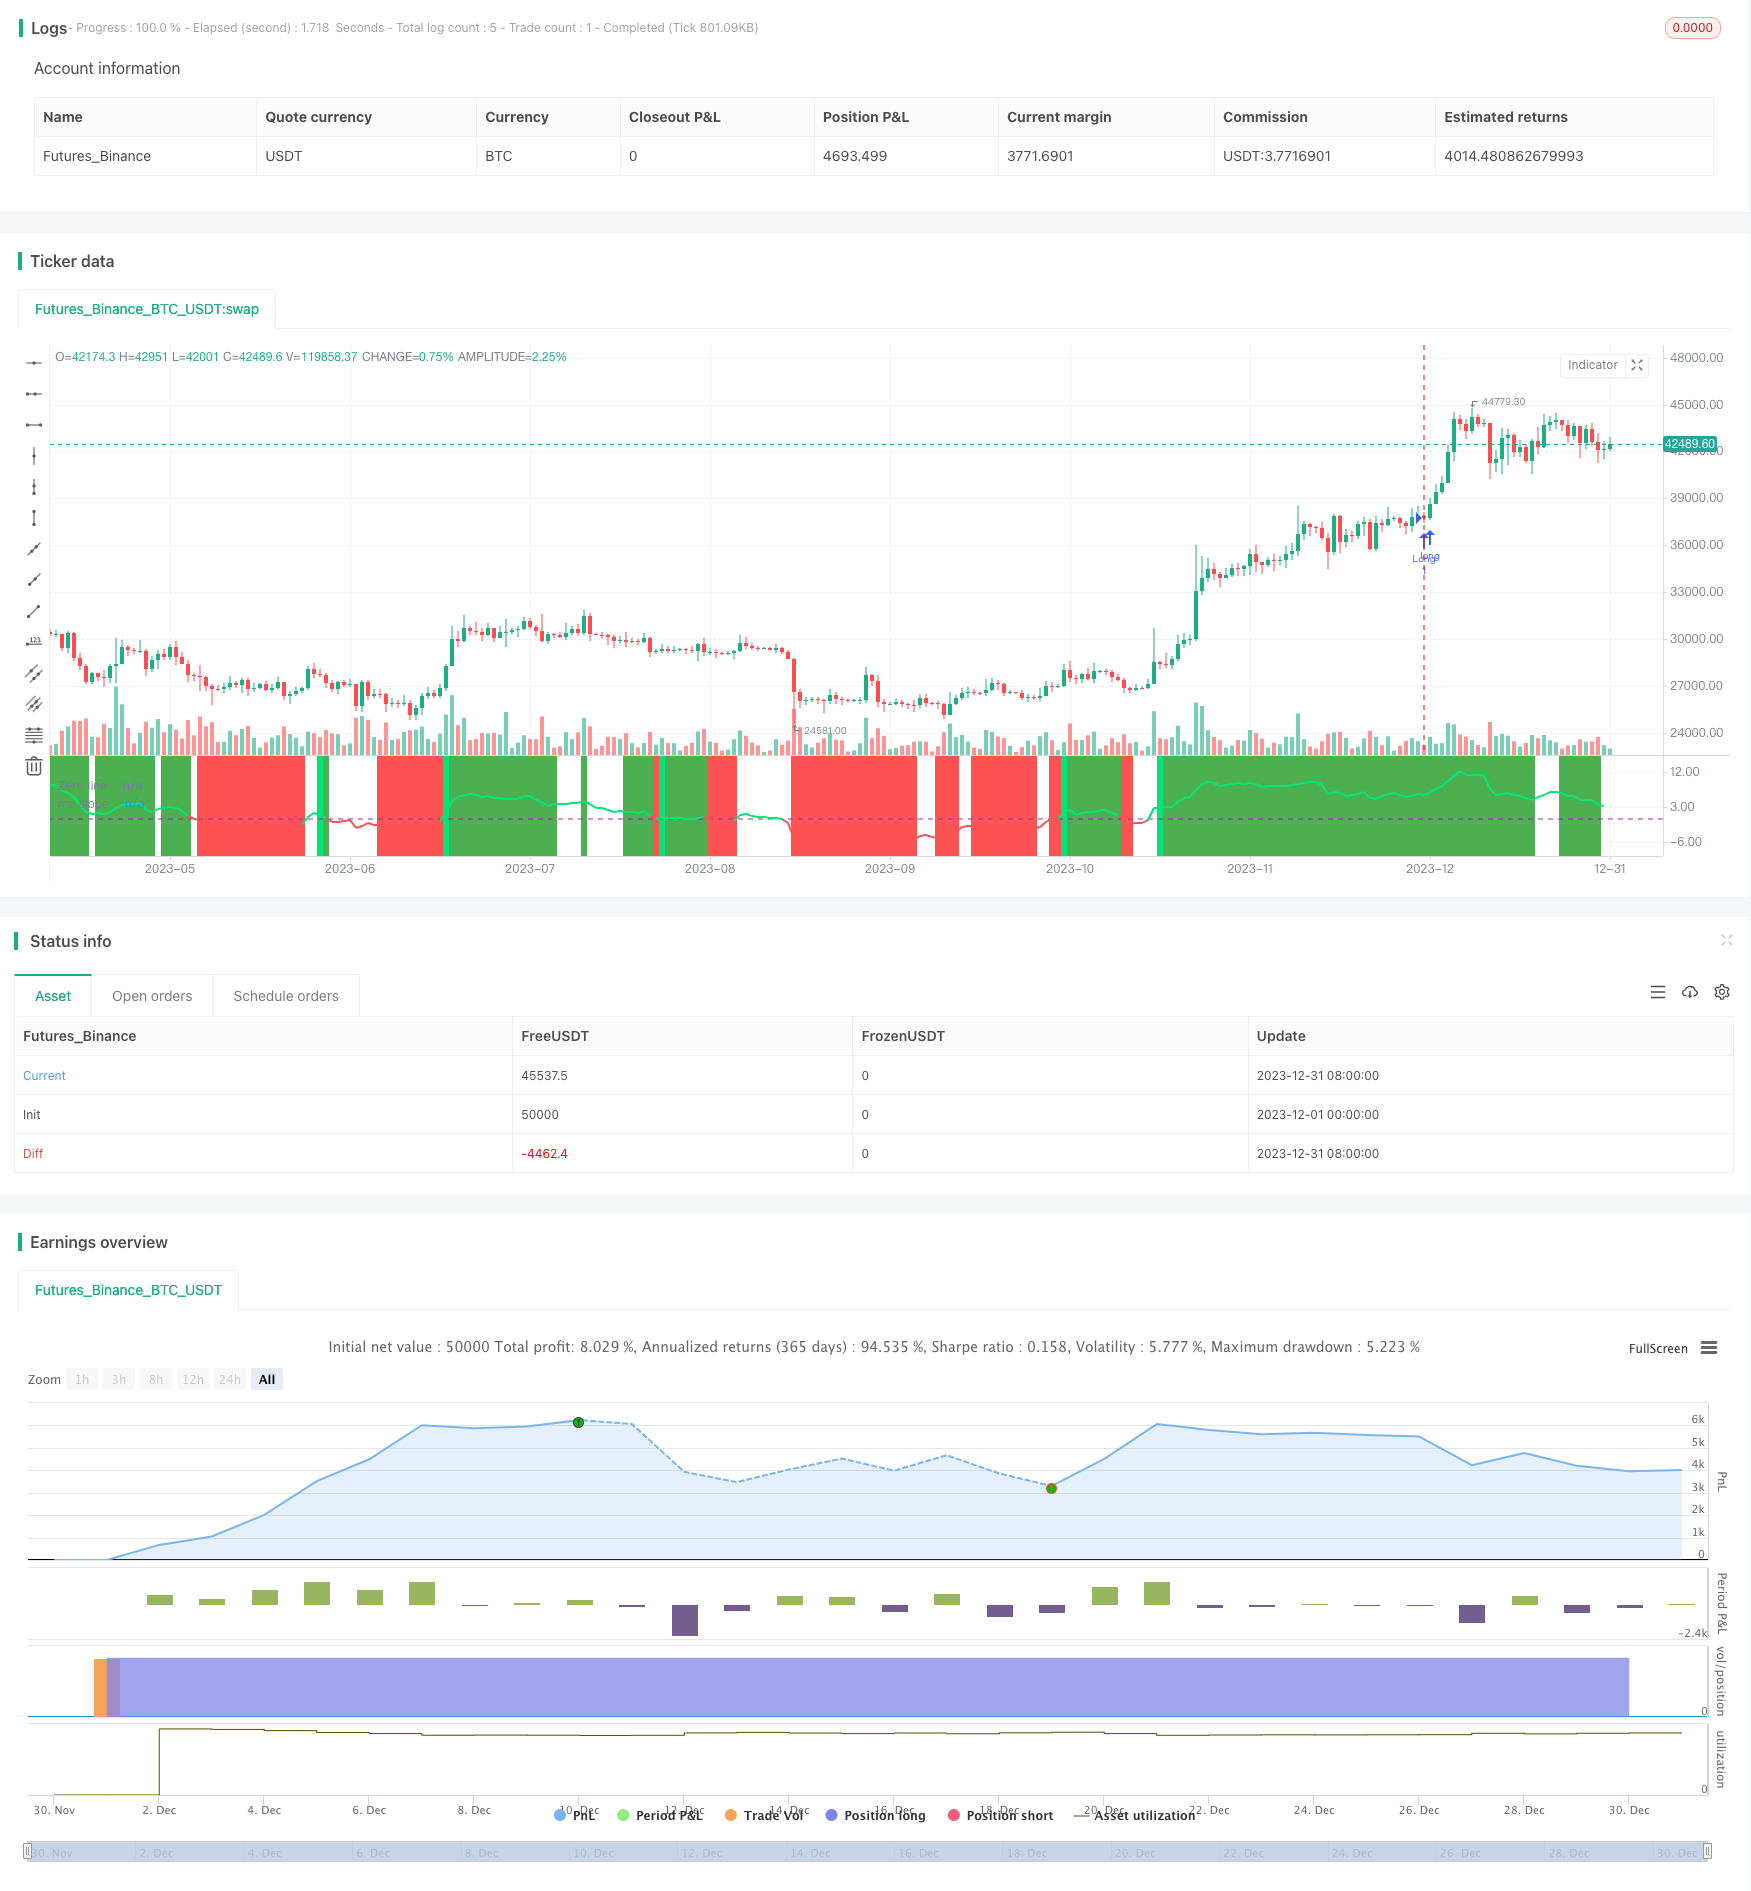
Overview
This strategy determines the trend direction by calculating the slope angle of moving averages, combined with price change rate indicator for long and short trading. Essentially it is a trend following strategy that uses the slope angle of moving averages to determine price trends, and the price change rate indicator to filter out range-bound market.
Strategy Logic
The strategy is mainly based on the following indicators for judgement:
Moving Average Slope Angle: Calculate the slope angles of Jurik Moving Average and Exponential Moving Average to determine price trend direction. Angle greater than 0 indicates uptrend, less than 0 means downtrend.
Price Change Rate: Calculate the rate of change of closing price over last 12 bars to filter signals by volatility.
When moving average slope goes up (greater than 0) and price change rate meets criteria, go long. When slope goes down (less than 0) and price change rate meets criteria, go short.
Specifically, the strategy first calculates the slope angles of Jurik MA and EMA. Then the price change rate indicator is calculated for filtering range-bound period. When both moving average slope signals trend and price change rate meets criteria, trading signal is generated.
Advantage Analysis
The advantages of this strategy:
Using MA slope to determine trend is very reliable with good win rate.
Price change rate indicator effectively filters ranging fluctuation to avoid invalid trades.
Jurik MA gives quick response to breakout while EMA offers stable trend judgement, both complementary.
Going both long and short in trending market could capture greater profit.
Risk Analysis
Some risks of this strategy:
In extreme price whipsaw, MA may generate wrong signals. This can be reduced by parameter optimization.
Signals may switch frequently during ranging causing unnecessary trades. Additional filter can be added.
Stop loss could be broken in sudden price gap events. Wider stop loss can be used.
Optimization Directions
The strategy can be optimized in following aspects:
Optimize MA parameters to find best parameter combination improving stability.
Add volatility, volume filters etc. for further reducing invalid trades.
Incorporate other indicators for smarter stop loss positioning.
Develop adaptive position sizing algorithms for steadier profitability.
Conclusion
Overall this is a very practical trend following strategy. It reliably determines trend using MA slope angle, and effectively filters noise signals using price change rate indicator. Taking both long and short positions could gain nice profit. With continuous optimizations, this strategy can become a very stable and reliable quantitative strategy.
Parameters
| Name | Default | What it controls |
|---|---|---|
| v_input_1 | 2017 | Backtest Start Year |
| v_input_2 | true | Backtest Start Month |
| v_input_3 | true | Backtest Start Day |
| v_input_4 | 2019 | Backtest Stop Year |
| v_input_5 | 12 | Backtest Stop Month |
| v_input_6 | 31 | Backtest Stop Day |
| v_input_7_ohlc4 | 0 | source: ohlc4 | high | low | open | hl2 | hlc3 | hlcc4 | close |
| v_input_8 | 56 | v_input_8 |
| v_input_9 | 12 | roclength |
| v_input_10 | 2 | pcntChange |
| v_input_11 | 2 | Stop Loss % |
| v_input_12 | 900 | Take Profit % |
Source Pine Script
/*backtest
start: 2023-12-01 00:00:00
end: 2023-12-31 23:59:59
period: 1d
basePeriod: 1h
exchanges: [{"eid":"Futures_Binance","currency":"BTC_USDT"}]
*/

//@version=4
// Based on ma angles code by Duyck which also uses Everget Jurik MA calulation and angle calculation by KyJ
strategy("Trend Angle BF", overlay=false)

/////////////// Time Frame ///////////////
testStartYear = input(2017, "Backtest Start Year")
testStartMonth = input(1, "Backtest Start Month")
testStartDay = input(1, "Backtest Start Day")
testPeriodStart = timestamp(testStartYear,testStartMonth,testStartDay, 0, 0)

testStopYear = input(2019, "Backtest Stop Year")
testStopMonth = input(12, "Backtest Stop Month")
testStopDay = input(31, "Backtest Stop Day")
testPeriodStop = timestamp(testStopYear,testStopMonth,testStopDay, 0, 0)

testPeriod() => true

src=input(ohlc4,title="source")

// definition of "Jurik Moving Average", by Everget
jma(_src,_length,_phase,_power) =>
    phaseRatio = _phase < -100 ? 0.5 : _phase > 100 ? 2.5 : _phase / 100 + 1.5
    beta = 0.45 * (_length - 1) / (0.45 * (_length - 1) + 2)
    alpha = pow(beta, _power)
    jma = 0.0
    e0 = 0.0
    e0 := (1 - alpha) * _src + alpha * nz(e0[1])
    e1 = 0.0
    e1 := (_src - e0) * (1 - beta) + beta * nz(e1[1])
    e2 = 0.0
    e2 := (e0 + phaseRatio * e1 - nz(jma[1])) * pow(1 - alpha, 2) + pow(alpha, 2) * nz(e2[1])
    jma := e2 + nz(jma[1])

//// //// Determine Angle by KyJ //// ////
angle(_src) =>
    rad2degree=180/3.14159265359  //pi
    ang=rad2degree*atan((_src[0] - _src[1])/atr(14))

jma_line=jma(src,10,50,1)
ma=ema(src,input(56))
jma_slope=angle(jma_line)
ma_slope=angle(ma)

///////////// Rate Of Change /////////////
source = close
roclength = input(12, minval=1)
pcntChange = input(2, minval=1)
roc = 100 * (source - source[roclength]) / source[roclength]
emaroc = ema(roc, roclength / 2)
isMoving() => emaroc > (pcntChange / 2) or emaroc < (0 - (pcntChange / 2))

/////////////// Strategy ///////////////
long = ma_slope>=0 and isMoving()
short = ma_slope<=0 and isMoving()

last_long = 0.0
last_short = 0.0
last_long := long ? time : nz(last_long[1])
last_short := short ? time : nz(last_short[1])

long_signal = crossover(last_long, last_short)
short_signal = crossover(last_short, last_long)

last_open_long_signal = 0.0
last_open_short_signal = 0.0
last_open_long_signal := long_signal ? open : nz(last_open_long_signal[1])
last_open_short_signal := short_signal ? open : nz(last_open_short_signal[1])

last_long_signal = 0.0
last_short_signal = 0.0
last_long_signal := long_signal ? time : nz(last_long_signal[1])
last_short_signal := short_signal ? time : nz(last_short_signal[1])

in_long_signal = last_long_signal > last_short_signal
in_short_signal = last_short_signal > last_long_signal

last_high = 0.0
last_low = 0.0
last_high := not in_long_signal ? na : in_long_signal and (na(last_high[1]) or high > nz(last_high[1])) ? high : nz(last_high[1])
last_low := not in_short_signal ? na : in_short_signal and (na(last_low[1]) or low < nz(last_low[1])) ? low : nz(last_low[1])
sl_inp = input(2.0, title='Stop Loss %') / 100
tp_inp = input(900.0, title='Take Profit %') / 100

take_level_l = strategy.position_avg_price * (1 + tp_inp)
take_level_s = strategy.position_avg_price * (1 - tp_inp)

since_longEntry = barssince(last_open_long_signal != last_open_long_signal[1])
since_shortEntry = barssince(last_open_short_signal != last_open_short_signal[1])

slLong = in_long_signal ? strategy.position_avg_price * (1 - sl_inp) : na
slShort = strategy.position_avg_price * (1 + sl_inp)
long_sl = in_long_signal ? slLong : na
short_sl = in_short_signal ? slShort : na

/////////////// Execution ///////////////
if testPeriod()
    strategy.entry("Long",  strategy.long, when=long)
    strategy.entry("Short", strategy.short, when=short)
    strategy.exit("Long Ex", "Long", stop=long_sl, limit=take_level_l, when=since_longEntry > 0)
    strategy.exit("Short Ex", "Short", stop=short_sl, limit=take_level_s, when=since_shortEntry > 0)

///////////// Plotting /////////////
hline(0, title='Zero line', color=color.purple, linewidth=1)
plot(ma_slope,title="ma slope", linewidth=2,color=ma_slope>=0?color.lime:color.red)
bgcolor(isMoving() ? long ? color.green : short ? color.red : na : color.white, transp=80)
bgcolor(long_signal ? color.lime : short_signal ? color.red : na, transp=30)
Published by ChaoZhang on the FMZ strategy square · last modified 2024-01-25. Collected in the Quant Trading Vault. Unvalidated research: re-test with your own data and costs before trusting it.
Build this with AgenKit
A spec is not a trading system. Paste this into your coding agent and AgenKit runs a specialist team — architecture, test-first build, risk gates, review — with paper trading on by default.
/agenkit build a production-grade trading bot with a backtest engine, risk controls and paper trading by default from strategies/Trend-Angle-Moving-Average-Crossover-Strategy.md- npx agenkit install engineering-kit in your project
- Paste the command into your agent and approve each phase
- Get tests, backtest, risk controls and a paper-trading switch
Understand it first
Before you run this, read the lesson behind the idea and how to backtest it honestly. Specs like this one are the survivors of an unknown number of trials; deflate their results accordingly.
Related specs
- Dynamic Dual EMA Trend Following StrategyPine Script · Trend following · 1d
- Fixed Range Volume Profile And Anchored VWAP Trend Identification Strategy With Dynamic Stop LossPine Script · Trend following · 1h
- Multi Exponential Moving Average Crossover Strategy with Volume Based ATR Dynamic Stop Loss OptimizationPine Script · Trend following · 2d
- Multi Factor Trend Price Action Strategy with Dynamic Risk Management SystemPine Script · Trend following · 2h
- Multi Period Moving Average Ribbon and MACD Crossover Strategy SystemPine Script · Trend following · 1h
- Multi Period Trend Following with Volume Confirmation StrategyPine Script · Trend following · 5d