Trend Breakout Strategy
The trend breakout strategy is a quantitative strategy that judges market trends and trades by calculating price volatility. The strategy uses the formula (high-low)/close to calculate price volatility of…
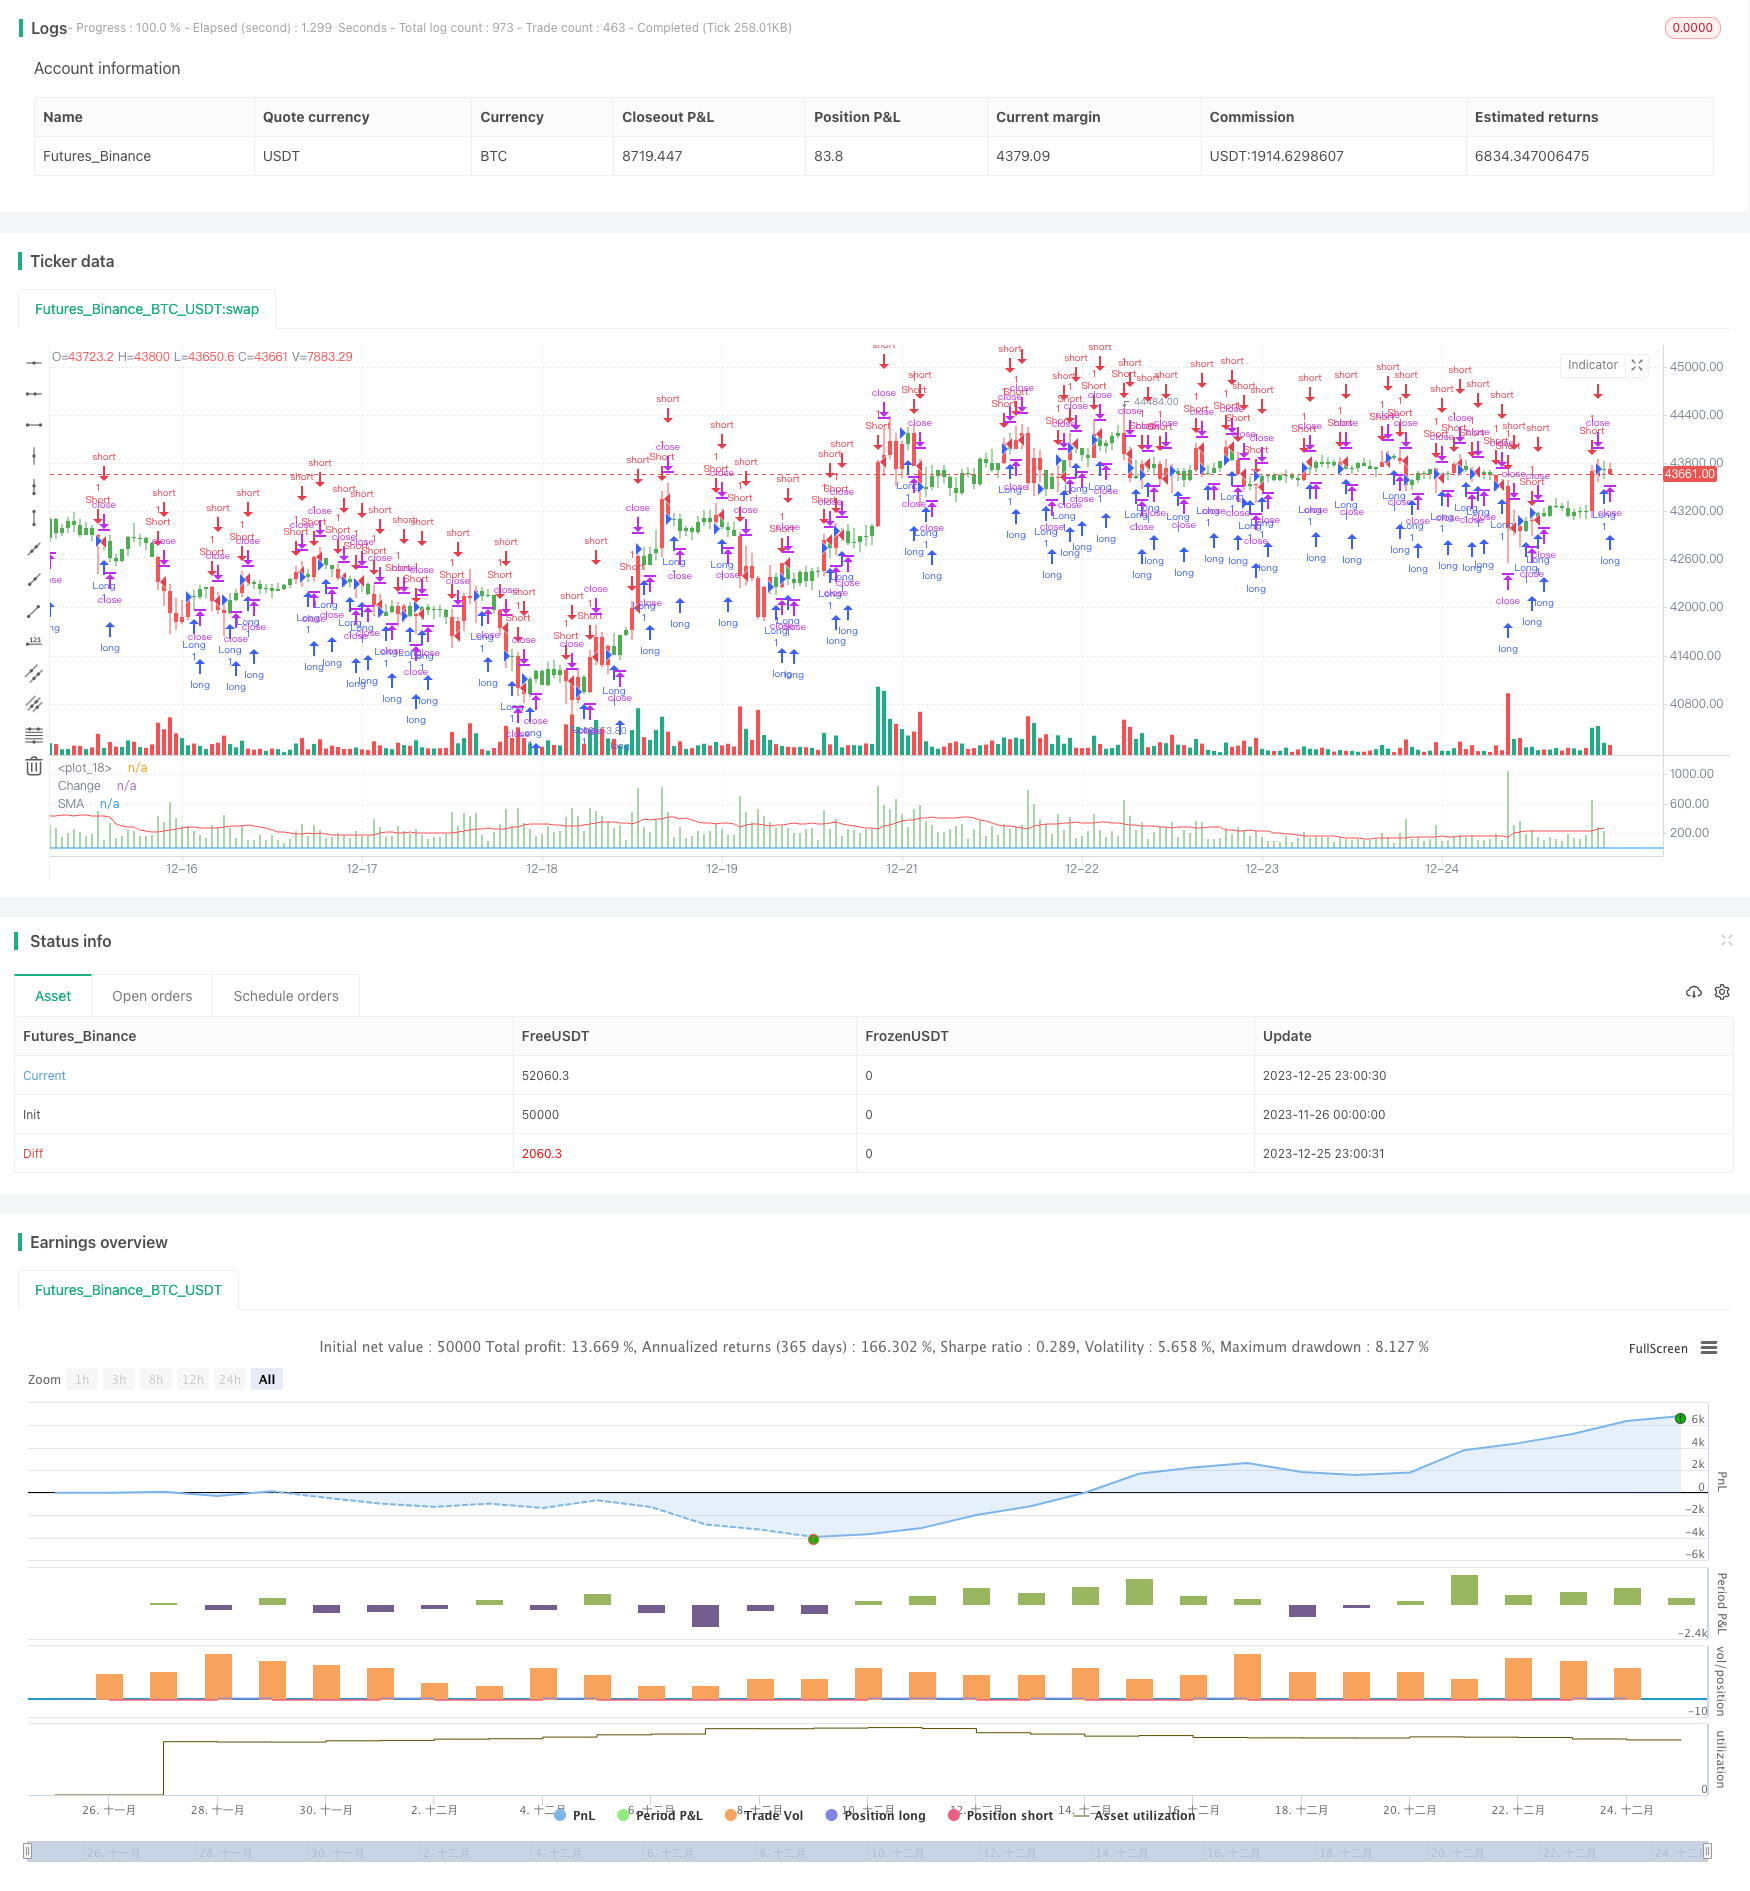
Overview
The trend breakout strategy is a quantitative strategy that judges market trends and trades by calculating price volatility. The strategy uses the formula (high-low)/close to calculate price volatility of candlestick, and further processes it through moving average to judge whether a trend reversal occurs. When volatility is higher than the average level over a recent period, a new trend may be emerging. Then the strategy will issue trading signals.
Strategy Logic
The core indicator of this strategy is (high-low)/close, which reflects the amplitude of candlestick. The strategy first calculates this indicator, then takes its absolute value and calculates simple moving average. If the current candlestick's volatility indicator absolute value is higher than moving average value over a period, it means a new trend may be forming.
Specifically, the strategy includes following steps:
- Calculate (high-low)/close as volatility indicator
- Take absolute value of volatility indicator and calculate simple moving average
- Compare current candlestick volatility with moving average over a period (user input)
- If current volatility is greater than moving average, form long signal; if lower, form short signal
- Make long or short positions based on signal directions
The strategy also contains indictor plotting, candlestick color change and other visualizations for intuitive trend judgment. In summary, the idea of using price volatility to judge potential trend change is simple and effective.
Advantages
The main advantages of this strategy are:
- Simple and direct principle, easy to understand and implement
- Use price volatility to judge market trend change, no fixed indicator framework
- Customizable parameters to adjust judgment sensitivity
- Good intuitive effect combined with indicator plotting and color change
- Can smooth out noise and catch mid-long term trends
In general, this strategy breaks through the thinking pattern of traditional indicator judgment, and only focuses on price volatility itself to flexibly capture potential trend changes. The strategy is adjustable, easy to use, and worth recommending.
Risks
The main risks of this strategy include:
- Too sensitive to market volatility, may generate multiple invalid signals
- Only consider price volatility, ignore other factors
- Improper parameter settings may miss trends or cause wrong judgements
- Unable to distinguish mid-long term trends and short-term adjustments
These risks are mainly related to over reliance of the strategy on price volatility to determine market trends. To reduce risks, we can consider combining other judgment indicators to verify the validity of trend signals, and properly adjust parameters to smooth volatility indicators, filtering out short-term noises.
Optimization Directions
The main directions for optimizing this strategy include:
- Combine trading volume and other indicators to determine trend validity
- Add machine learning models to judge signal quality
- Optimize parameter settings for better smoothing effects
- Distinguish mid-long term trends and short-term adjustments
- Combine with stop loss strategies to control per trade loss
These optimization measures can reduce the probability of wrong trades and improve the profitability of the strategy. In particular, adding indicators and models to determine signal validity can greatly reduce invalid signals. In addition, stop loss strategies are also necessary to control single trade loss and ensure overall returns.
Summary
This trend breakout strategy judges market trend changes by calculating price volatility. The principle is simple and direct, and the usage is flexible with customizable parameters for sensitivity adjustment. The strategy has the advantage of capturing trend changes, but also has some risks. We can improve it by optimizing judgment indicators, establishing filtering models, adjusting parameter settings and so on, to make the strategy more stable and reliable. In general, this strategy provides a new idea for determining market trend changes and is worth further research and optimization.
Parameters
| Name | Default | What it controls |
|---|---|---|
| v_input_1 | 4 | Bar Width |
| v_input_2 | true | Look Back |
| v_input_3 | false | % change |
| v_input_4 | 16 | SMA Length |
| v_input_5 | false | Trade reverse |
Source Pine Script
/*backtest
start: 2023-11-26 00:00:00
end: 2023-12-26 00:00:00
period: 1h
basePeriod: 15m
exchanges: [{"eid":"Futures_Binance","currency":"BTC_USDT"}]
*/

//@version=3
////////////////////////////////////////////////////////////
//  Copyright by HPotter v2.0 25/10/2017
//
//  This histogram displays (high-low)/close
//  Can be applied to any time frame.
//
// WARNING:
// - For purpose educate only
// - This script to change bars colors.
////////////////////////////////////////////////////////////
strategy(title="(H-L)/C Histogram Backtest", precision = 2)
input_barwidth = input(4, title="Bar Width")
input_barsback = input(1, title="Look Back")
input_percentorprice = input(false, title="% change")
input_smalength = input(16, title="SMA Length")
reverse = input(false, title="Trade reverse")
hline(0, color=blue, linestyle=line)
xPrice = (high-low)/close
xPriceHL = (high-low)
xPrice1 = iff(input_percentorprice, xPrice * 100, xPriceHL)
xPrice1SMA = sma(abs(xPrice1), input_smalength)
pos = 0.0
pos := iff(xPrice1SMA[input_barsback] > abs(xPrice1), 1,
	   iff(xPrice1SMA[input_barsback] < abs(xPrice1), -1, nz(pos[1], 0)))
possig = iff(reverse and pos == 1, -1,
          iff(reverse and pos == -1, 1, pos))
if (possig == 1)
    strategy.entry("Long", strategy.long)
if (possig == -1)
    strategy.entry("Short", strategy.short)
barcolor(possig == -1 ? red: possig == 1 ? green : blue )
plot(abs(xPrice1), color=green, style = histogram, linewidth = input_barwidth, title="Change")
plot(xPrice1SMA[input_barsback], color=red, title="SMA")
Published by ChaoZhang on the FMZ strategy square · last modified 2023-12-27. Collected in the Quant Trading Vault. Unvalidated research: re-test with your own data and costs before trusting it.
Build this with AgenKit
A spec is not a trading system. Paste this into your coding agent and AgenKit runs a specialist team — architecture, test-first build, risk gates, review — with paper trading on by default.
/agenkit build a production-grade trading bot with a backtest engine, risk controls and paper trading by default from strategies/Trend-Breakout-Strategy.md- npx agenkit install engineering-kit in your project
- Paste the command into your agent and approve each phase
- Get tests, backtest, risk controls and a paper-trading switch
Understand it first
Before you run this, read the lesson behind the idea and how to backtest it honestly. Specs like this one are the survivors of an unknown number of trials; deflate their results accordingly.
Related specs
- 5 Day Moving Average Channel Breakout Strategy Combined With Mileage ConceptPine Script · Breakout · 1d
- Adaptive Bollinger Breakout with Moving Average Quantitative Strategy SystemPine Script · Breakout · 1h
- Adaptive Multi Period Trading Strategy Based on Wave Trend Momentum BreakoutPine Script · Breakout · 2h
- Adaptive Trading Strategy Based on ADX IndicatorPine Script · Breakout · 1d
- Average Line Breakthrough StrategyPine Script · Breakout · 1d
- BB Breakout StrategyPine Script · Breakout · 1d