Trend Following Grid Strategy
This strategy is a trend following grid strategy that only goes long and does not go short, choosing time periods when the major trend is up. The default grid size is 1xATR, building 1, 2, 3 grid levels downward for…
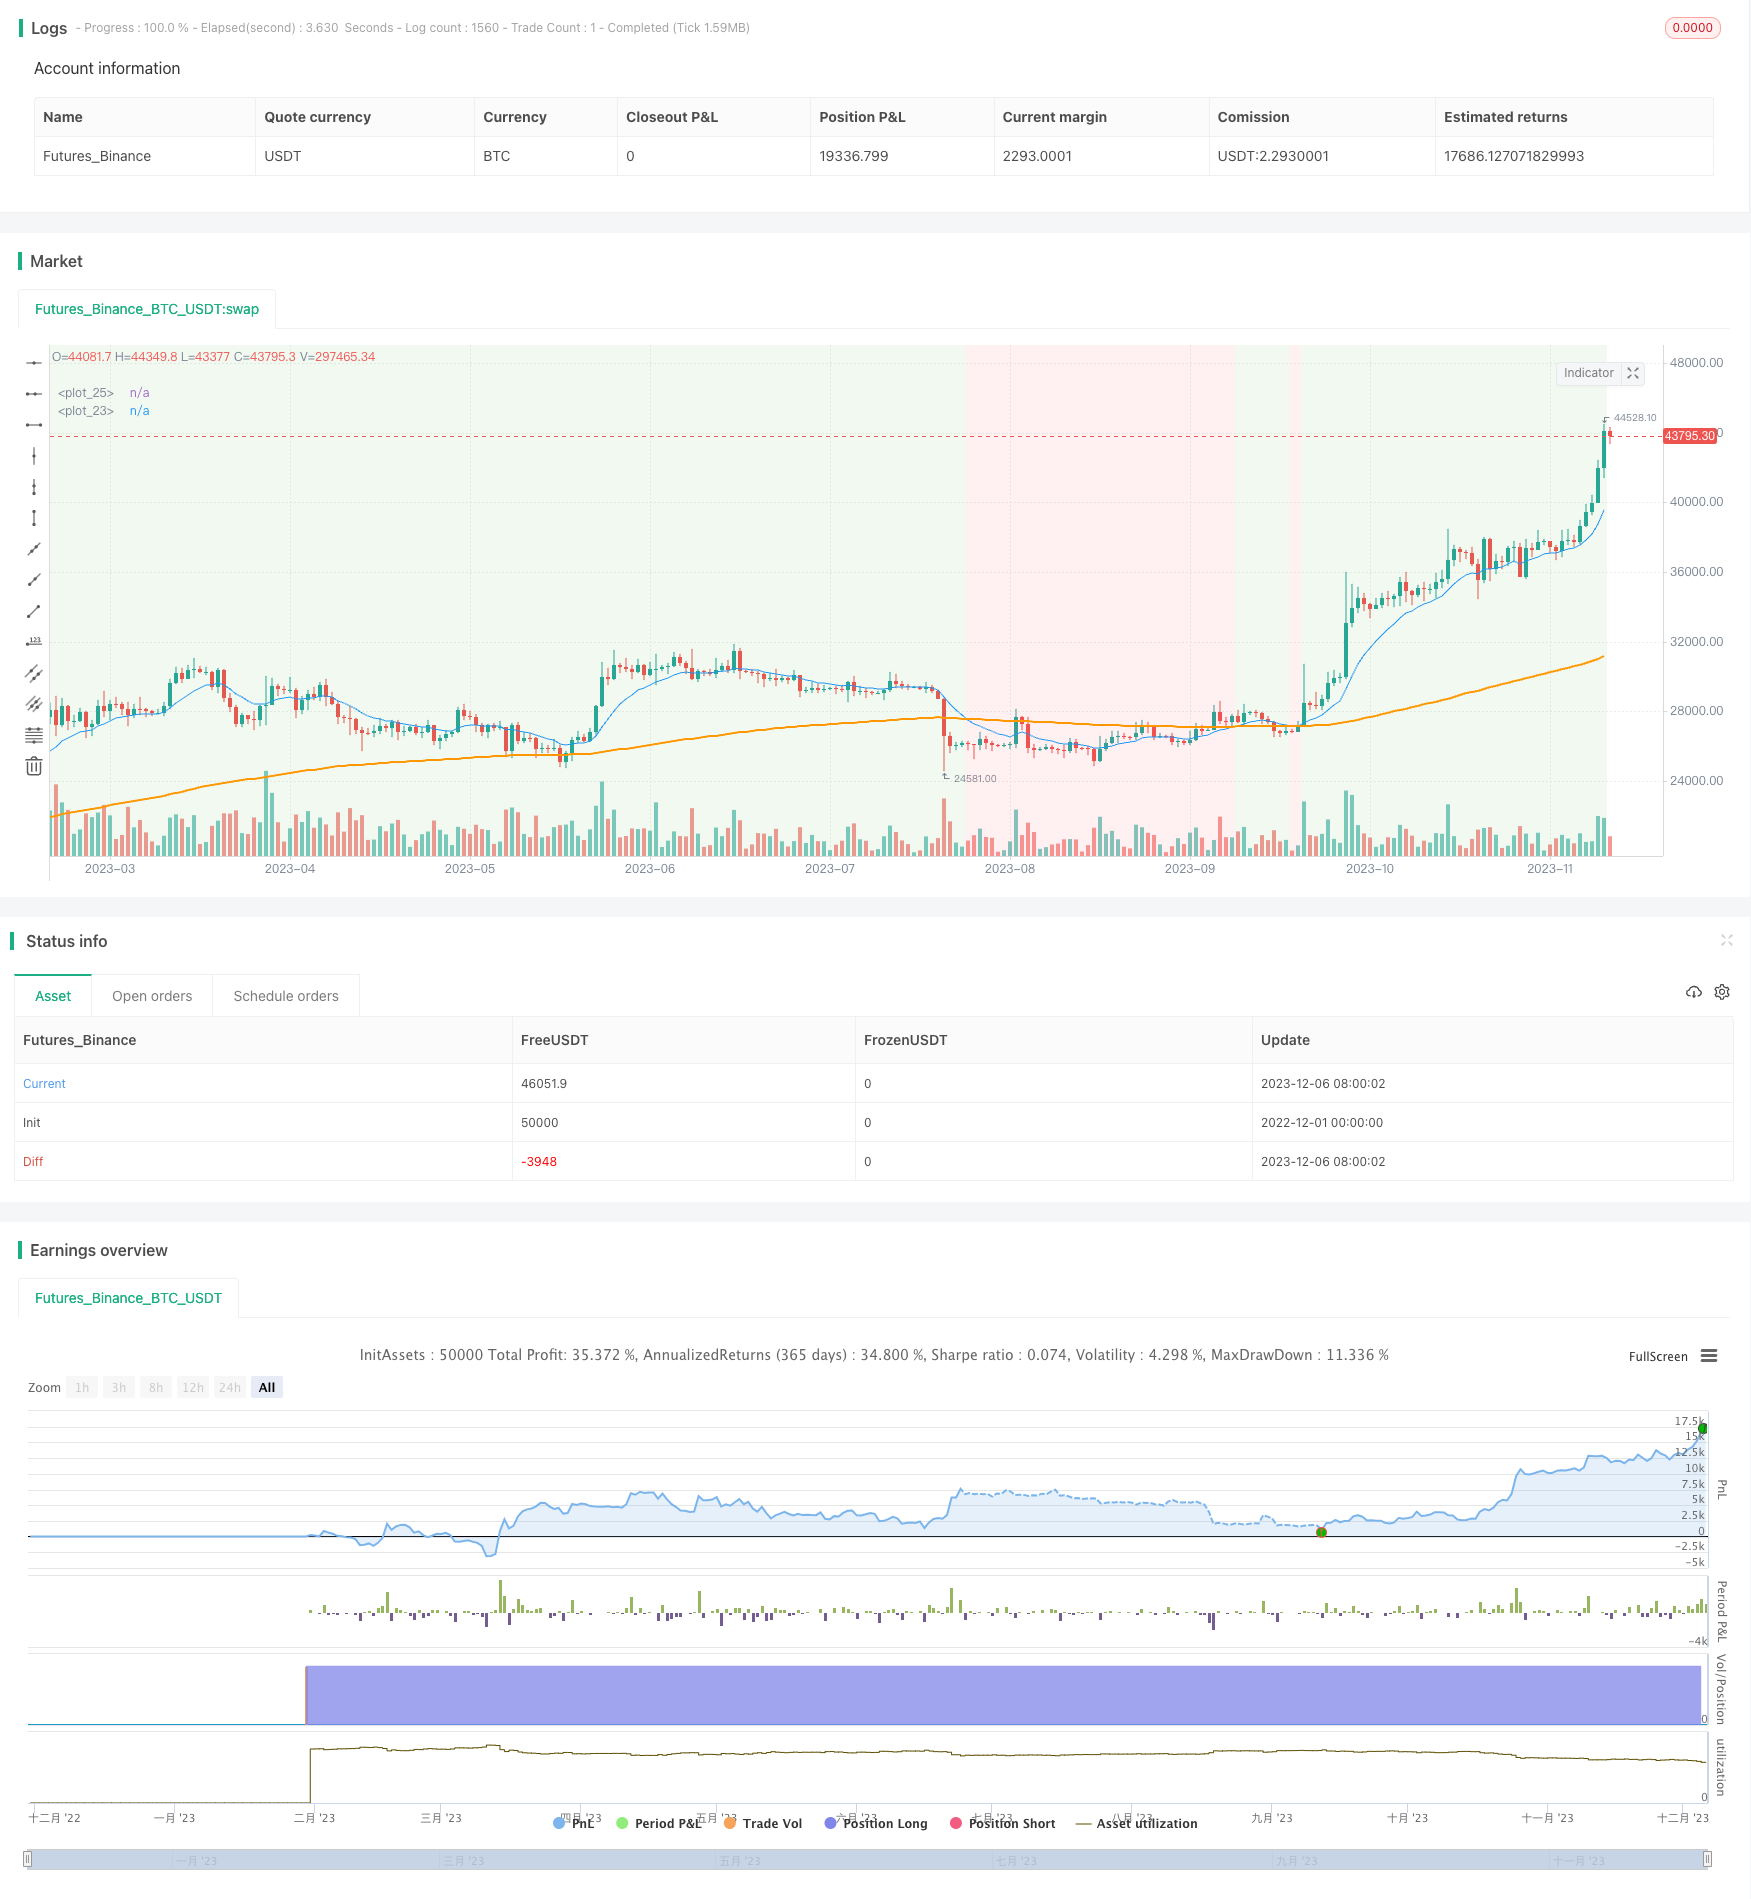
Overview
This strategy is a trend following grid strategy that only goes long and does not go short, choosing time periods when the major trend is up. The default grid size is 1xATR, building 1, 2, 3 grid levels downward for chasing orders, and the 5th grid stops loss. When the empty position reaches the previous grid, the entire grid moves up to track the price.
Strategy Logic
- Use EMA lines to judge the major trend direction, EMA12 greater than EMA144 means the major trend is up
- Only open long positions when the major trend is up
- The default grid size is 1xATR, the multiplier can be adjusted
- Build 1, 2, 3 grid levels downward to track the price and open long positions separately
- Set the stop loss point at the 5th grid
- After opening positions, set stop loss points and take profit points
- Close positions when the price breaks through the take profit point on rise
- Close positions when the price hits the stop loss point on fall
- After all positions are closed, if the price breaks through the last grid again, recalculate the grid location and quantity to track upwards
This strategy combines EMA to determine the major trend direction and grid trading to track the price. It can obtain greater returns in an uptrend. The grid sets multiple price points to open positions separately, which reduces the risk per position. The stop loss and take profit settings lock in profits and also limit maximum losses. After all positions are closed, the strategy can recalculate new high levels of grids to open positions again, maximizing profits.
Advantage Analysis
- Use EMA to determine major trend direction, avoid opening positions against the trend
- Grid trading can open positions separately to reduce single position risk
- Stop loss and take profit lock in profits, control maximum losses
- After closing all positions, recalculating grids to continue chasing can expand profit space
The main advantage is combining trend trading and grid trading, which ensures the correctness of trend direction and also achieves risk dispersion of grid trading. In addition, recalculating grids after closing positions allows unlimited chasing, obtaining huge profits when there is a big rally.
Risk Analysis
- Major trend judgment may be wrong, entering in the wrong direction
- Significant sideways volatility that causes heavy losses in grids
- Stop loss triggered too fast, closing all positions
- Unable to re-enter optimal entry point after pullback
The main risk is the wrong judgment of major trend direction, which will lead to opening positions against the trend and huge losses. Also, if there is high sideways volatility with multiple grids being trapped, losses would be exacerbated. In addition, fast price drops may trigger stop loss and close all positions, losing subsequent profit opportunities. It would be hard to re-enter initial optimal grid levels after pullbacks.
Accuracy of major trend judgment can be improved by optimizing EMA parameters. Adjusting grid interval and size of first entry can also control overall losses. Stop loss position needs to consider market volatility frequency. Also, profit taking can be considered for partial positions instead of closing all positions.
Optimization Directions
This strategy can also be optimized in the following aspects:
- Optimize EMA parameters to improve accuracy of major trend judgment
- Adjust grid intervals and quantities to optimize risk-reward ratio
- Improve stop loss and take profit logic, e.g. partial take profit, trailing stop loss etc
- Add more restrictions on re-entry conditions to avoid premature re-entry during pullbacks
- Incorporate more indicators to determine optimal entry timing, e.g. candlestick patterns, indicator sensitivity etc
- Add outlier detection to avoid huge losses in anomalous market conditions
With these optimization measures, the strategy can obtain greater profits during significant trends, while also controlling risks and reducing losses in normal sideways volatility.
Summary
This strategy combines trend trading and grid trading organically. It uses EMA to determine major direction and uses grid trading to open positions separately for chasing trends. With proper risk management including stop loss, take profit and grid recalculation mechanisms, this strategy can produce decent profits during major trends, while also controlling risks. Further optimizations on parameters and judgment accuracy can lead to higher profits. It is worth detailed testing and optimization for live trading.
Parameters
| Name | Default | What it controls |
|---|---|---|
| v_input_float_1 | true | What is the grid size multipleATR? |
Source Pine Script
/*backtest
start: 2022-12-01 00:00:00
end: 2023-12-07 00:00:00
period: 1d
basePeriod: 1h
exchanges: [{"eid":"Futures_Binance","currency":"BTC_USDT"}]
*/

// This source code is subject to the terms of the Mozilla Public License 2.0 at https://mozilla.org/MPL/2.0/
// © zxcvbnm3260

//@version=5
strategy("grid strategy long", overlay=true)


// Version update records:
// v1.0 2021/11/09 Only go long, not short, and choose a time period when the general trend is upward. The grid size defaults to1timesATR,Downward1,2,3Each grid taking orders, number5individual grid stop-loss. When no position, reaching the upper previous grid will lift the entire grid.(Only go long, not short, choose a time period when the general trend is up. The default grid size is 1x ATR, the next one, two, and three grids will take orders, and the fifth grid will stop loss. When the empty position reaches the upper grid, the grid as a whole rises.)


X_ATR = input.float(title='What is the grid size multipleATR?', defval = 1)


// 1.Basic variables
ema169 = ta.ema(close, 169)
ema144 = ta.ema(close, 144)
ema12 = ta.ema(close, 12)

ema576 = ta.ema(close, 576)
ema676 = ta.ema(close, 676)

plot(ema169, color=color.new(color.orange, 0), linewidth=2)
// plot(ema144, color=color.orange)
plot(ema12,  color=color.blue)
// plot(ema676, color=color.orange, linewidth=1)

mtr = math.max(high - low, math.abs(close[1] - high), math.abs(close[1] - low))
atr = ta.ema(mtr, 30)

is_0930 = hour(time, 'GMT-4') == 9  and minute(time, 'GMT-4') == 30
is_1500 = hour(time, 'GMT-4') == 15 and minute(time, 'GMT-4') == 00
is_1530 = hour(time, 'GMT-4') == 15 and minute(time, 'GMT-4') == 30

is_yangxian = close>open
is_yinxian = close<open

// 2.Basic trend markers

big_trend  = ema12 >= ema169 ? 1 : 0
big_trend2 = ema12 <= ema169 ? 1 : 0

// Background color change handling:
bgcolor(big_trend == 1 ? color.new(color.green, 90) : color.new(color.red, 90) )

// 3.Grid point initialization

grid_size = atr * X_ATR // Grid size

price_entry1 = open - grid_size*1
price_entry2 = open - grid_size*2
price_entry3 = open - grid_size*3
price_stop_loss = open - grid_size*5

price_exit1 = price_entry1 + grid_size*1
price_exit2 = price_entry2 + grid_size*1
price_exit3 = price_entry3 + grid_size*1

qty1 = int(1000/price_entry1)
qty2 = int(1000/price_entry2)
qty3 = int(1000/price_entry3)


// Mark various points
slm_lines_time(time, price_entry1, price_entry2, price_entry3, price_stop_loss, price_exit1)=>
    time2 = time + 1000*3600*24*5
    line.new(time, price_stop_loss, time2, price_stop_loss, color=color.red, xloc = xloc.bar_time, width=2)  // Stop-loss point
    line.new(time, price_entry1, time2, price_entry1, color=color.green, xloc = xloc.bar_time)  //
    line.new(time, price_entry2, time2, price_entry2, color=color.green, xloc = xloc.bar_time)  //
    line.new(time, price_entry3, time2, price_entry3, color=color.green, xloc = xloc.bar_time)  //
    line.new(time, price_exit1,  time2, price_exit1,  color=color.green, xloc = xloc.bar_time, width=2)  //

slm_lines(time, price_entry1, price_entry2, price_entry3, price_stop_loss, price_exit1)=>
    line.new(bar_index, price_stop_loss, bar_index[5], price_stop_loss, color=color.red, xloc = xloc.bar_index, width=2)  // Stop-loss point
    line.new(bar_index, price_entry1, bar_index[5], price_entry1, color=color.green, xloc = xloc.bar_index)  //
    line.new(bar_index, price_entry2, bar_index[5], price_entry2, color=color.green, xloc = xloc.bar_index)  //
    line.new(bar_index, price_entry3, bar_index[5], price_entry3, color=color.green, xloc = xloc.bar_index)  //
    line.new(bar_index, price_exit1,  bar_index[5], price_exit1,  color=color.green, xloc = xloc.bar_index, width=2)  //


// 4.Grid point update and order placement

is_entry0 = big_trend==1 and year>=2020

var is_entry = false

// When not entering the venue:
if is_entry0 and not is_entry
    is_entry := true

    grid_size := atr * X_ATR // Grid size

    price_entry1 := close - grid_size*1
    price_entry2 := close - grid_size*2
    price_entry3 := close - grid_size*3
    price_stop_loss := close - grid_size*5

    price_exit1 := price_entry1 + grid_size*1
    price_exit2 := price_entry2 + grid_size*1
    price_exit3 := price_entry3 + grid_size*1

    qty1 := int(1000/price_entry1)
    qty2 := int(1000/price_entry2)
    qty3 := int(1000/price_entry3)

    // slm_lines(time, price_entry1, price_entry2, price_entry3, price_stop_loss, price_exit1)

    strategy.entry("open1", strategy.long, qty1, limit = price_entry1)
    strategy.entry("open2", strategy.long, qty2, limit = price_entry2)
    strategy.entry("open3", strategy.long, qty3, limit = price_entry3)

    strategy.exit("close1", qty = qty1, limit = price_exit1, stop = price_stop_loss)
    strategy.exit("close2", qty = qty2, limit = price_exit2, stop = price_stop_loss)
    strategy.exit("close3", qty = qty3, limit = price_exit3, stop = price_stop_loss)

// Various situations of positions already entered

// 1.stop loss
if is_entry and close <= price_stop_loss
    strategy.close_all()
    is_entry := false

// 2.Grid lifting
if is_entry and close >= price_exit1
    is_entry := false
Published by ChaoZhang on the FMZ strategy square · last modified 2023-12-08. Collected in the Quant Trading Vault. Unvalidated research: re-test with your own data and costs before trusting it.
Build this with AgenKit
A spec is not a trading system. Paste this into your coding agent and AgenKit runs a specialist team — architecture, test-first build, risk gates, review — with paper trading on by default.
/agenkit build a grid bot with inventory caps and order deduplication from strategies/Trend-Following-Grid-Strategy.md- npx agenkit install engineering-kit in your project
- Paste the command into your agent and approve each phase
- Get tests, backtest, risk controls and a paper-trading switch
Understand it first
Before you run this, read the lesson behind the idea and how to backtest it honestly. Specs like this one are the survivors of an unknown number of trials; deflate their results accordingly.
Related specs
- Bollinger Fibonacci Grid Tracking Trend StrategyPine Script · Grid · 1h
- Advanced Bollinger Band Moving Average Grid Trend Tracking StrategyPine Script · Grid · 1h
- Grid Strategy with Moving Average LinesPine Script · Grid · 1d
- QQE and RSI based Long Short Signal StrategyPine Script · Grid · 1d
- Assassins Grid B A Dynamic Grid Trading StrategyPine Script · Grid · 1d
- Double Bottom Reversal Mean Reversion DCA Grid StrategyPine Script · Grid · 3m