Strategy vault / Trend following
Trend Following Moving Average Strategy
This strategy calculates the channel moving average lines and establishes long or short positions when the price breaks through the channel lines to follow the trend of the stock price. It belongs to the trend…
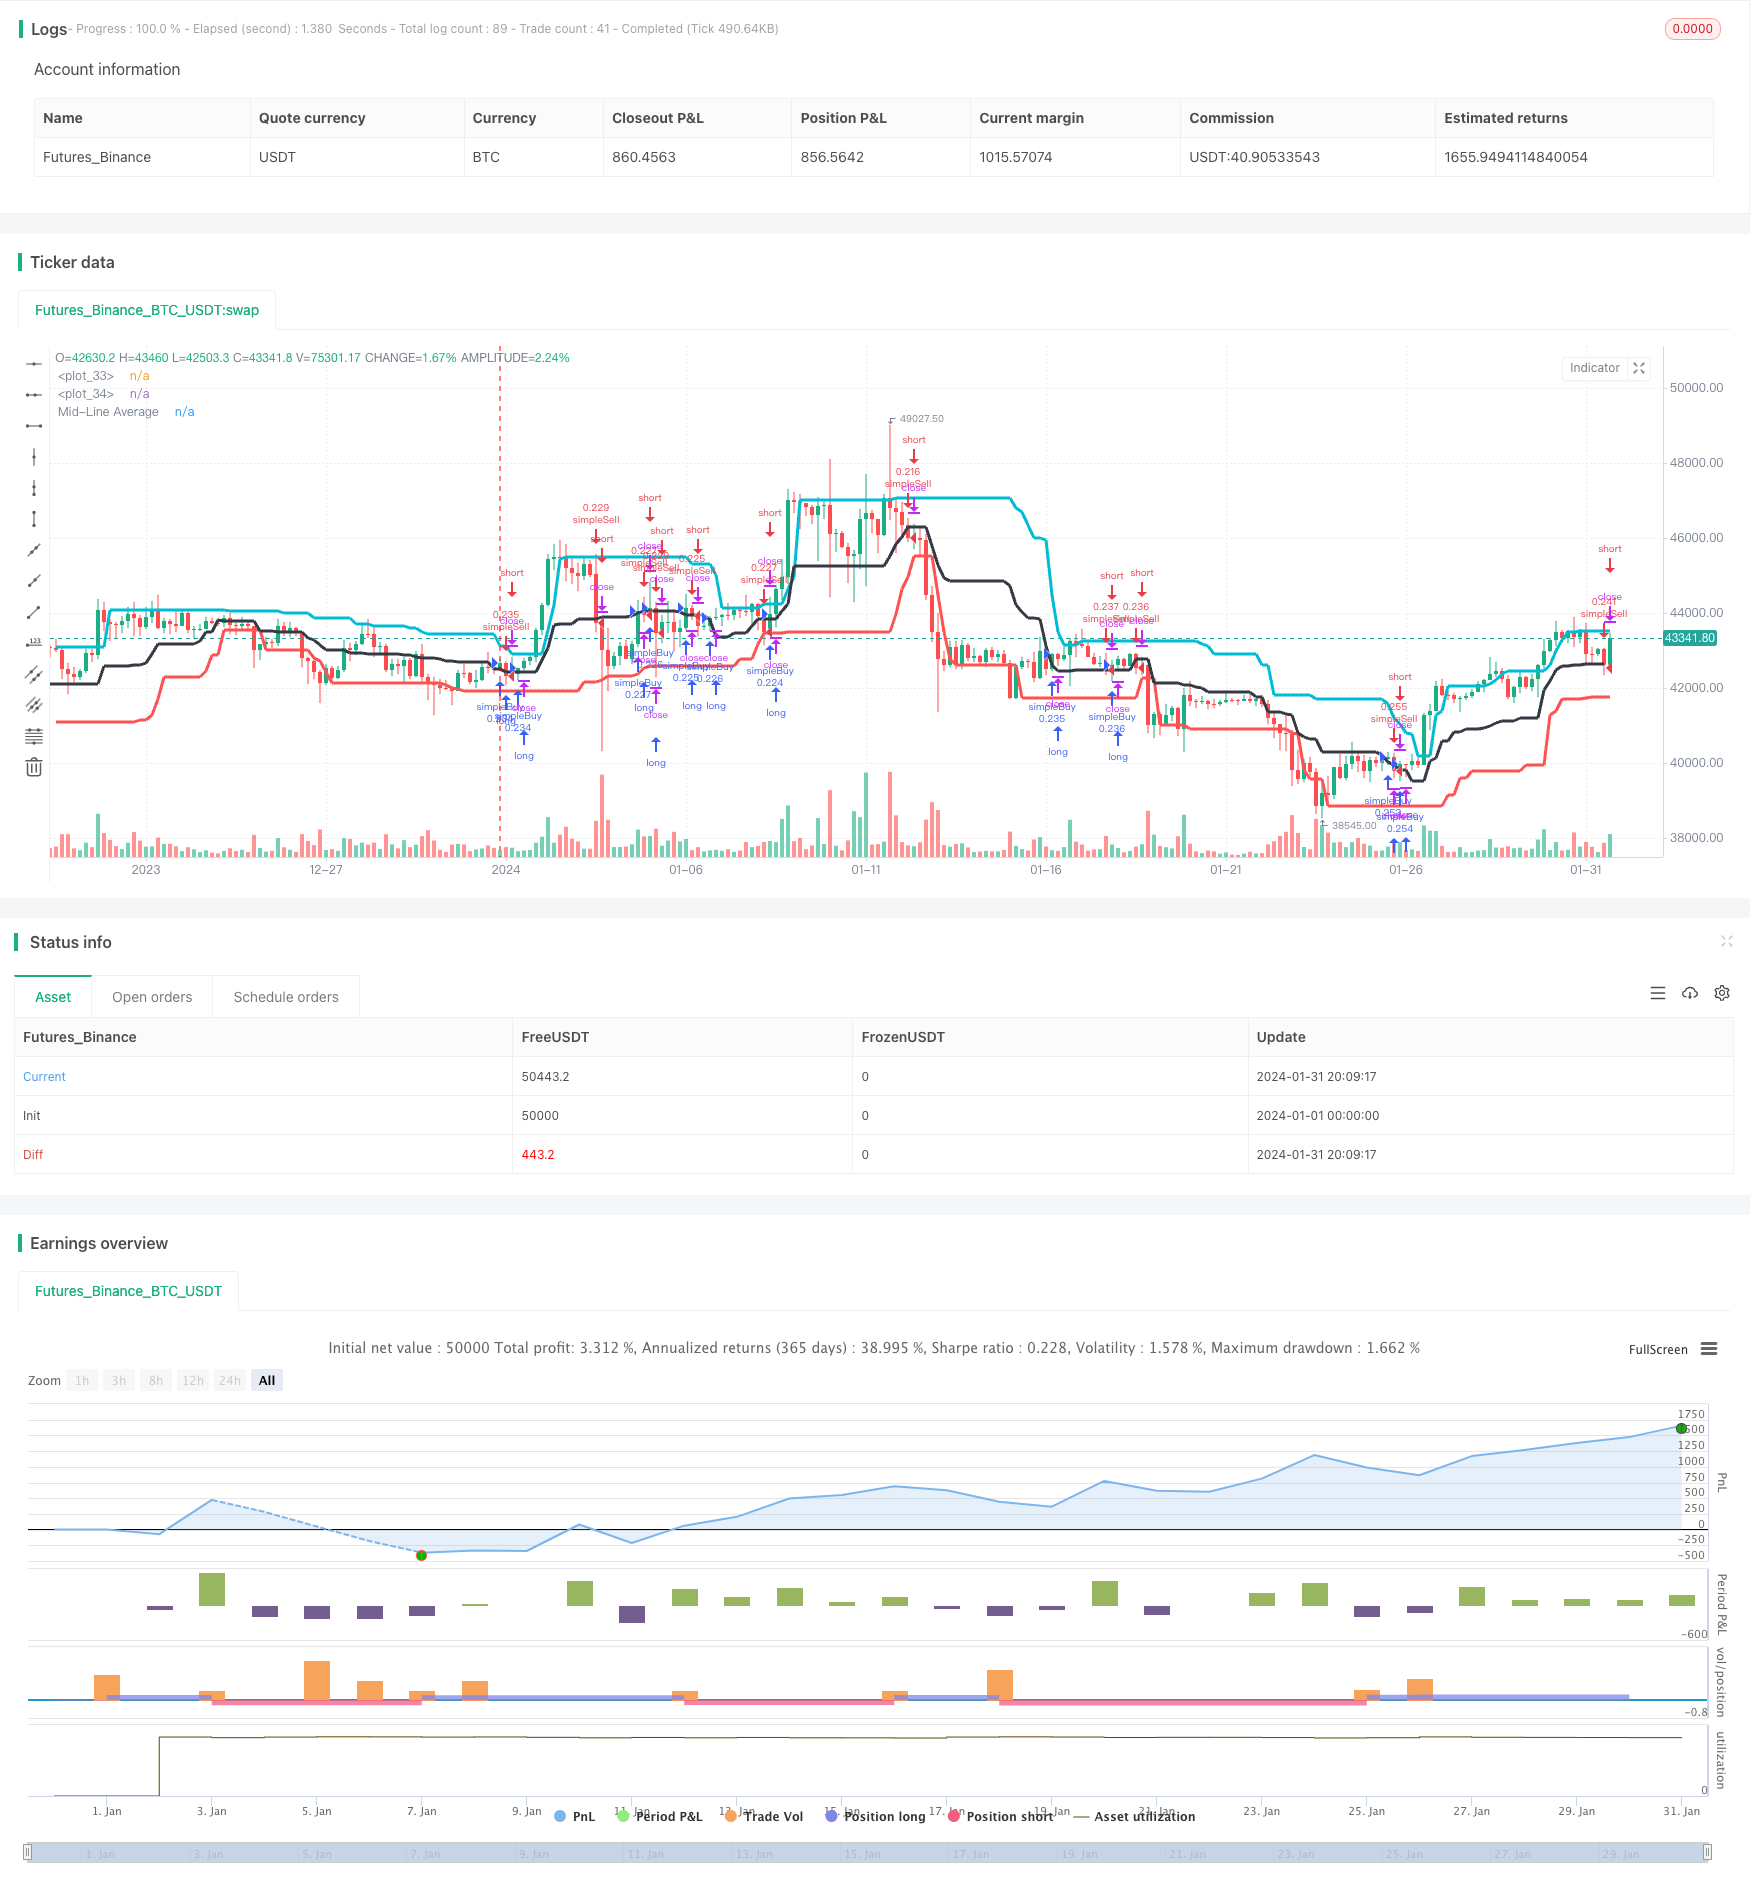
Overview
This strategy calculates the channel moving average lines and establishes long or short positions when the price breaks through the channel lines to follow the trend of the stock price. It belongs to the trend following strategy.
Strategy Principle
The strategy first calculates the 20-day high average as the upper rail of the channel, the 20-day low average as the lower rail of the channel, and calculates the midline of the channel. The midline of the channel represents the recent average price trend. When the price breaks through the midline of the channel upwards, a long position is established. When the price breaks through the midline of the channel downwards, a short position is established. Follow the price trend until the price falls back to the opposite side of the channel range, close the position.
Advantage Analysis
- Use the channel to track price trends, avoid funds being locked in ranging markets;
- Channel rails help determine entry and exit points, making it easy to control entries;
- The channel range filters out some noise and increases profit probability;
- The channel parameters can be adjusted to tune the sensitivity of the strategy;
Risk Analysis
- Significant midline breakouts may be followed by pullback tests of the midline, resulting in being trapped;
- Oscillating stocks are not suitable for this strategy and may lead to high frequency trading;
- Improper parameter settings may also affect strategy performance;
Optimization Directions
- Optimize channel cycle parameters to test impacts of different parameters;
- Add profit taking and stop loss strategies to control single and total losses;
- Combine other indicators as auxiliary judgements to avoid wrong signals;
- Take positions in batches to reduce the probability of being trapped during pullback tests;
Summary
In general, this strategy is relatively simple and straightforward. It judges stock price trends through basic price channels and belongs to the trend following type. The advantages are easy operation, full use of investment opportunities brought by price trends, and avoiding fund lock-ups. The disadvantages are that improper parameter settings may affect performance and there are certain risks of pullback tests. Through reasonable optimization, the stability of the strategy can be improved and real trading performance can be enhanced.
Parameters
| Name | Default | What it controls |
|---|---|---|
| v_input_1 | 2000 | Backtest Start Year |
| v_input_2 | true | Backtest Start Month |
| v_input_3 | true | Backtest Start Day |
| v_input_4 | 2019 | Backtest Start Year |
| v_input_5 | 3 | testEndMonth |
| v_input_6 | 31 | Backtest Start Day |
Source Pine Script
/*backtest
start: 2024-01-01 00:00:00
end: 2024-01-31 23:59:59
period: 4h
basePeriod: 15m
exchanges: [{"eid":"Futures_Binance","currency":"BTC_USDT"}]
*/

//@version=3
//future strategy
//strategy(title = "stub", default_qty_type = strategy.fixed, default_qty_value = 1,  overlay = true, commission_type=strategy.commission.cash_per_contract,commission_value=2)
//stock strategy
strategy(title = "dc", default_qty_type = strategy.percent_of_equity, default_qty_value = 20,  overlay = true, commission_type=strategy.commission.cash_per_contract,commission_value=.005)
//forex strategy
//strategy(title = "stub", default_qty_type = strategy.percent_of_equity, default_qty_value = 20,  overlay = true)
//crypto strategy
//strategy(title = "stub", default_qty_type = strategy.percent_of_equity, default_qty_value = 20,  overlay = true, commission_type=strategy.commission.percent,commission_value=.25,default_qty_value=20)


testStartYear = input(2000, "Backtest Start Year")
testStartMonth = input(1, "Backtest Start Month")
testStartDay = input(1, "Backtest Start Day")
testPeriodStart = timestamp(testStartYear,testStartMonth,testStartDay,0,0)

testEndYear = input(2019, "Backtest Start Year")
testEndMonth = input(3)
testEndDay = input(31, "Backtest Start Day")
testPeriodEnd = timestamp(testStartYear,testStartMonth,testStartDay,0,0)


testPeriod() =>
    true
    //time >= testPeriodStart  ? true : false

dcPeriod = 20

dcUpper = highest(close, dcPeriod)[1]
dcLower = lowest(close, dcPeriod)[1]
dcAverage = (dcUpper + dcLower) / 2

plot(dcLower, style=line, linewidth=3, color=red, offset=1)
plot(dcUpper, style=line, linewidth=3, color=aqua, offset=1)

plot(dcAverage, color=black, style=line, linewidth=3, title="Mid-Line Average")

strategy.entry("simpleBuy", strategy.long, when=close > dcAverage)
strategy.close("simpleBuy",when=close < dcLower)

strategy.entry("simpleSell", strategy.short,when=close < dcAverage)
strategy.close("simpleSell",when=close > dcAverage)
Published by ChaoZhang on the FMZ strategy square · last modified 2024-02-29. Collected in the Quant Trading Vault. Unvalidated research: re-test with your own data and costs before trusting it.
Build this with AgenKit
A spec is not a trading system. Paste this into your coding agent and AgenKit runs a specialist team — architecture, test-first build, risk gates, review — with paper trading on by default.
/agenkit build a production-grade trading bot with a backtest engine, risk controls and paper trading by default from strategies/Trend-Following-Moving-Average-Strategy.md- npx agenkit install engineering-kit in your project
- Paste the command into your agent and approve each phase
- Get tests, backtest, risk controls and a paper-trading switch
Understand it first
Before you run this, read the lesson behind the idea and how to backtest it honestly. Specs like this one are the survivors of an unknown number of trials; deflate their results accordingly.
Related specs
- 200 EMA VWAP MFI Trend Following StrategyPine Script · Trend following · 1d
- 4 EMA Trend StrategyPine Script · Trend following · 1d
- ADX MA and EMA Long Only Trend Tracking StrategyPine Script · Trend following · 1d
- ATR Dynamic Profit Target and Stop Loss StrategyPine Script · Trend following · 1d
- ATR Dynamic Trend Following and EMA Crossover Trading StrategyPine Script · Trend following · 1d
- ATR and Moving Average Crossover Hybrid StrategyPine Script · Trend following · 1h