Strategy vault / Trend following
Trend Following Strategy Based on Bollinger Bands RSI and Moving Average
This strategy integrates Bollinger Bands, Relative Strength Index (RSI) and Moving Average (MA) to identify potential entry and exit points in the market. It can generate buy and sell signals (alerts) that can be…
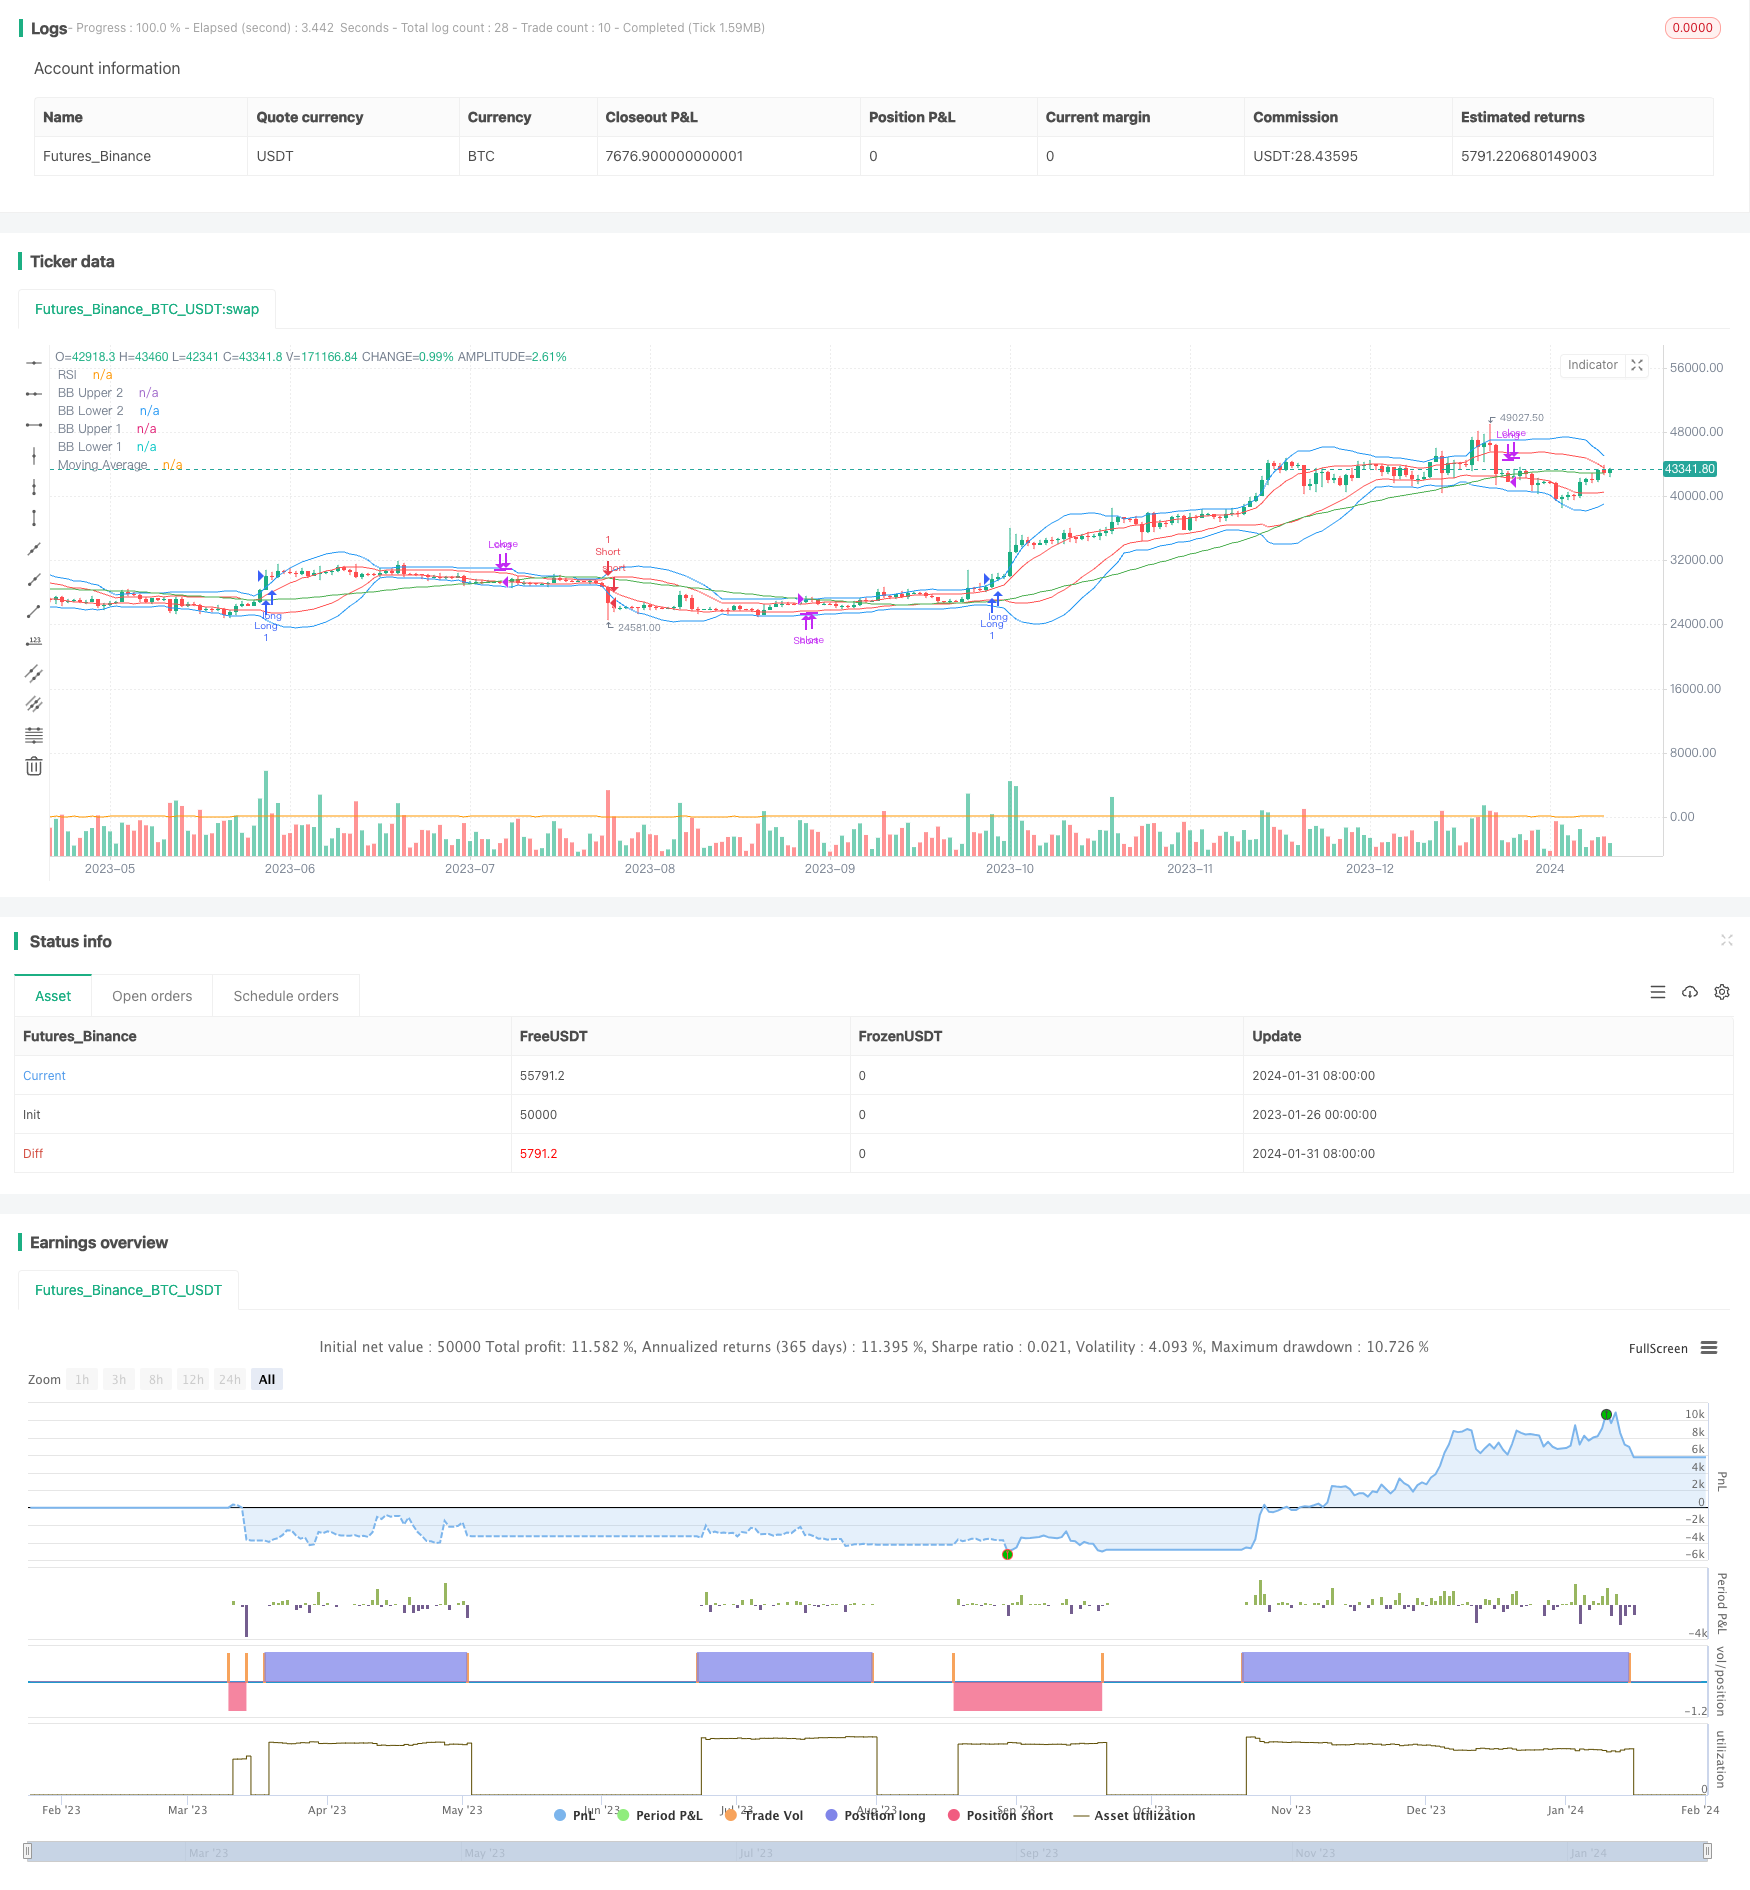
Overview
This strategy integrates Bollinger Bands, Relative Strength Index (RSI) and Moving Average (MA) to identify potential entry and exit points in the market. It can generate buy and sell signals (alerts) that can be executed manually or via automated trading systems.
Strategy Logic
The strategy uses two Bollinger Bands with different parameters to create price channels. The default parameters are length of 20 periods and standard deviation of 2. The upper and lower bands serve as dynamic resistance and support levels.
The RSI indicator gauges price momentum strength. Its values are used to determine if overbought or oversold conditions exist.
A 50-period moving average is incorporated to identify the overall trend direction. When price is above the MA, it suggests an uptrend. When price is below the MA, it suggests a downtrend.
Entry conditions for long trades are when RSI goes above overbought level and Bollinger Bands are not contracting. For short trades, it is when RSI goes below oversold level and Bollinger Bands are not contracting.
Exit conditions for long trades are when RSI drops below overbought level or when price closes below 50-period MA. For short trades it is when RSI rises above oversold level or when price closes above 50-period MA.
Advantages
Combining Bollinger Bands, RSI and MA avoids generating false signals by cross validating signals.
Bollinger Bands identify local highs/lows and confirm breakouts. RSI filters false breakouts. MA determines overall trend. Signals are verified.
Optimized parameters of Bollinger Bands using two standard deviations more accurately depict price channels.
Risks
Bollinger Bands may generate false signals when contracting. RSI is also neutral and trading should be avoided.
RSI and MA may generate incorrect signals during ranging markets. Ranging conditions should be identified beforehand.
Price gaps cannot be effectively handled. Other indicators should confirm true breakouts.
Enhancement Opportunities
Optimize parameters of Bollinger Bands and RSI for different products and timeframes.
Add stop loss orders that trigger automatically when price breaches stop level.
Add trend filter like ADX to avoid inefficient trades during ranging markets.
Integrate with automated trading system to execute signals automatically without manual intervention.
Conclusion
This strategy combines the strengths of Bollinger Bands, RSI and MA with optimized parameters to improve signal accuracy. It can automatically generate trade alerts for execution. Main risks come from false signals during ranging markets. Adding a trend filter can reduce inefficient trades. Overall, by using parameter optimization and integrating multiple indicators, this strategy improves signal quality and is worth validating in live markets for usage.
Parameters
| Name | Default | What it controls |
|---|---|---|
| v_input_1 | 20 | BB Length |
| v_input_2 | 2 | BB Standard Deviation |
| v_input_3 | true | BB Deviation 1 |
| v_input_4 | 14 | RSI Length |
| v_input_5 | 70 | Overbought RSI Level |
| v_input_6 | 30 | Oversold RSI Level |
| v_input_7 | 50 | MA Length |
| v_input_8 | true | Stop Loss Percentage |
| v_input_9_close | 0 | Source: close | high | low | open | hl2 | hlc3 | hlcc4 | ohlc4 |
Source Pine Script
/*backtest
start: 2023-01-26 00:00:00
end: 2024-02-01 00:00:00
period: 1d
basePeriod: 1h
exchanges: [{"eid":"Futures_Binance","currency":"BTC_USDT"}]
*/

//@version=5
strategy("Bollinger Bands, RSI, and MA Strategy", overlay=true)

// Define input variables
b_len = input(20, title="BB Length")
bb_mult = input(2.0, title="BB Standard Deviation")
bb_deviation1 = input(1.0, title="BB Deviation 1")
rsi_len = input(14, title="RSI Length")
overbought = input(70, title="Overbought RSI Level")
oversold = input(30, title="Oversold RSI Level")
ma_len = input(50, title="MA Length")
stop_loss_percent = input(1.0, title="Stop Loss Percentage")
source = input(close, title="Source")

// Calculate Bollinger Bands
bb_upper = ta.sma(source, b_len) + bb_mult * ta.stdev(source, b_len)
bb_lower = ta.sma(source, b_len) - bb_mult * ta.stdev(source, b_len)
bb_upper1 = ta.sma(source, b_len) + bb_deviation1 * ta.stdev(source, b_len)
bb_lower1 = ta.sma(source, b_len) - bb_deviation1 * ta.stdev(source, b_len)

// Calculate RSI
rsi = ta.rsi(source, rsi_len)

// Calculate Moving Average
ma = ta.sma(source, ma_len)

// Determine if Bollinger Bands are contracting
bb_contracting = ta.stdev(source, b_len) < ta.stdev(source, b_len)[1]

// Entry conditions
enterLong = rsi > overbought and not bb_contracting
enterShort = rsi < oversold and not bb_contracting

// Exit conditions
exitLong = close < ma
exitShort = close > ma

// Exit trades and generate alerts
if strategy.position_size > 0 and exitLong
    strategy.close("Long") // Exit the long trade
    alert("Long Exit", alert.freq_once_per_bar_close)
if strategy.position_size < 0 and exitShort
    strategy.close("Short") // Exit the short trade
    alert("Short Exit", alert.freq_once_per_bar_close)

// Strategy orders
if enterLong
    strategy.entry("Long", strategy.long)
if enterShort
    strategy.entry("Short", strategy.short)
if exitLong
    strategy.close("Long")
if exitShort
    strategy.close("Short")

// Plotting Bollinger Bands
plot(bb_upper, color=color.blue, title="BB Upper 2")
plot(bb_lower, color=color.blue, title="BB Lower 2")
plot(bb_upper1, color=color.red, title="BB Upper 1")
plot(bb_lower1, color=color.red, title="BB Lower 1")

// Plotting RSI
plot(rsi, color=color.orange, title="RSI")

// Plotting Moving Average
plot(ma, color=color.green, title="Moving Average")
Published by ChaoZhang on the FMZ strategy square · last modified 2024-02-02. Collected in the Quant Trading Vault. Unvalidated research: re-test with your own data and costs before trusting it.
Build this with AgenKit
A spec is not a trading system. Paste this into your coding agent and AgenKit runs a specialist team — architecture, test-first build, risk gates, review — with paper trading on by default.
/agenkit build a production-grade trading bot with a backtest engine, risk controls and paper trading by default from strategies/Trend-Following-Strategy-Based-on-Bollinger-Bands-RSI-and-Moving-Average.md- npx agenkit install engineering-kit in your project
- Paste the command into your agent and approve each phase
- Get tests, backtest, risk controls and a paper-trading switch
Understand it first
Before you run this, read the lesson behind the idea and how to backtest it honestly. Specs like this one are the survivors of an unknown number of trials; deflate their results accordingly.
Related specs
- Adaptive Dual Strategy System for Trend Following and Range TradingPine Script · Trend following · 1h
- Dual directional Trailing Stop Moving Average Trend StrategyPine Script · Trend following · 1m
- Trend Following Strategy Based on Multiple IndicatorsPine Script · Trend following · 2h
- Adaptive Multi Strategy Dynamic Switching System A Quantitative Trading Strategy Combining Trend Following and Range OscillationPine Script · Trend following · 1d
- MASMA Dual Moving Average Crossover StrategyPine Script · Trend following · 1d
- RSI MA Crossover Swing Trading Strategy with Trailing Stop SystemPine Script · Trend following · 4h