Strategy vault / Trend following
Trend Following Strategy Based on Moving Average Difference
This strategy generates trading signals based on the difference between two moving averages. When the fast line crosses above the slow line, a buy signal is generated. When the fast line crosses below the slow line…
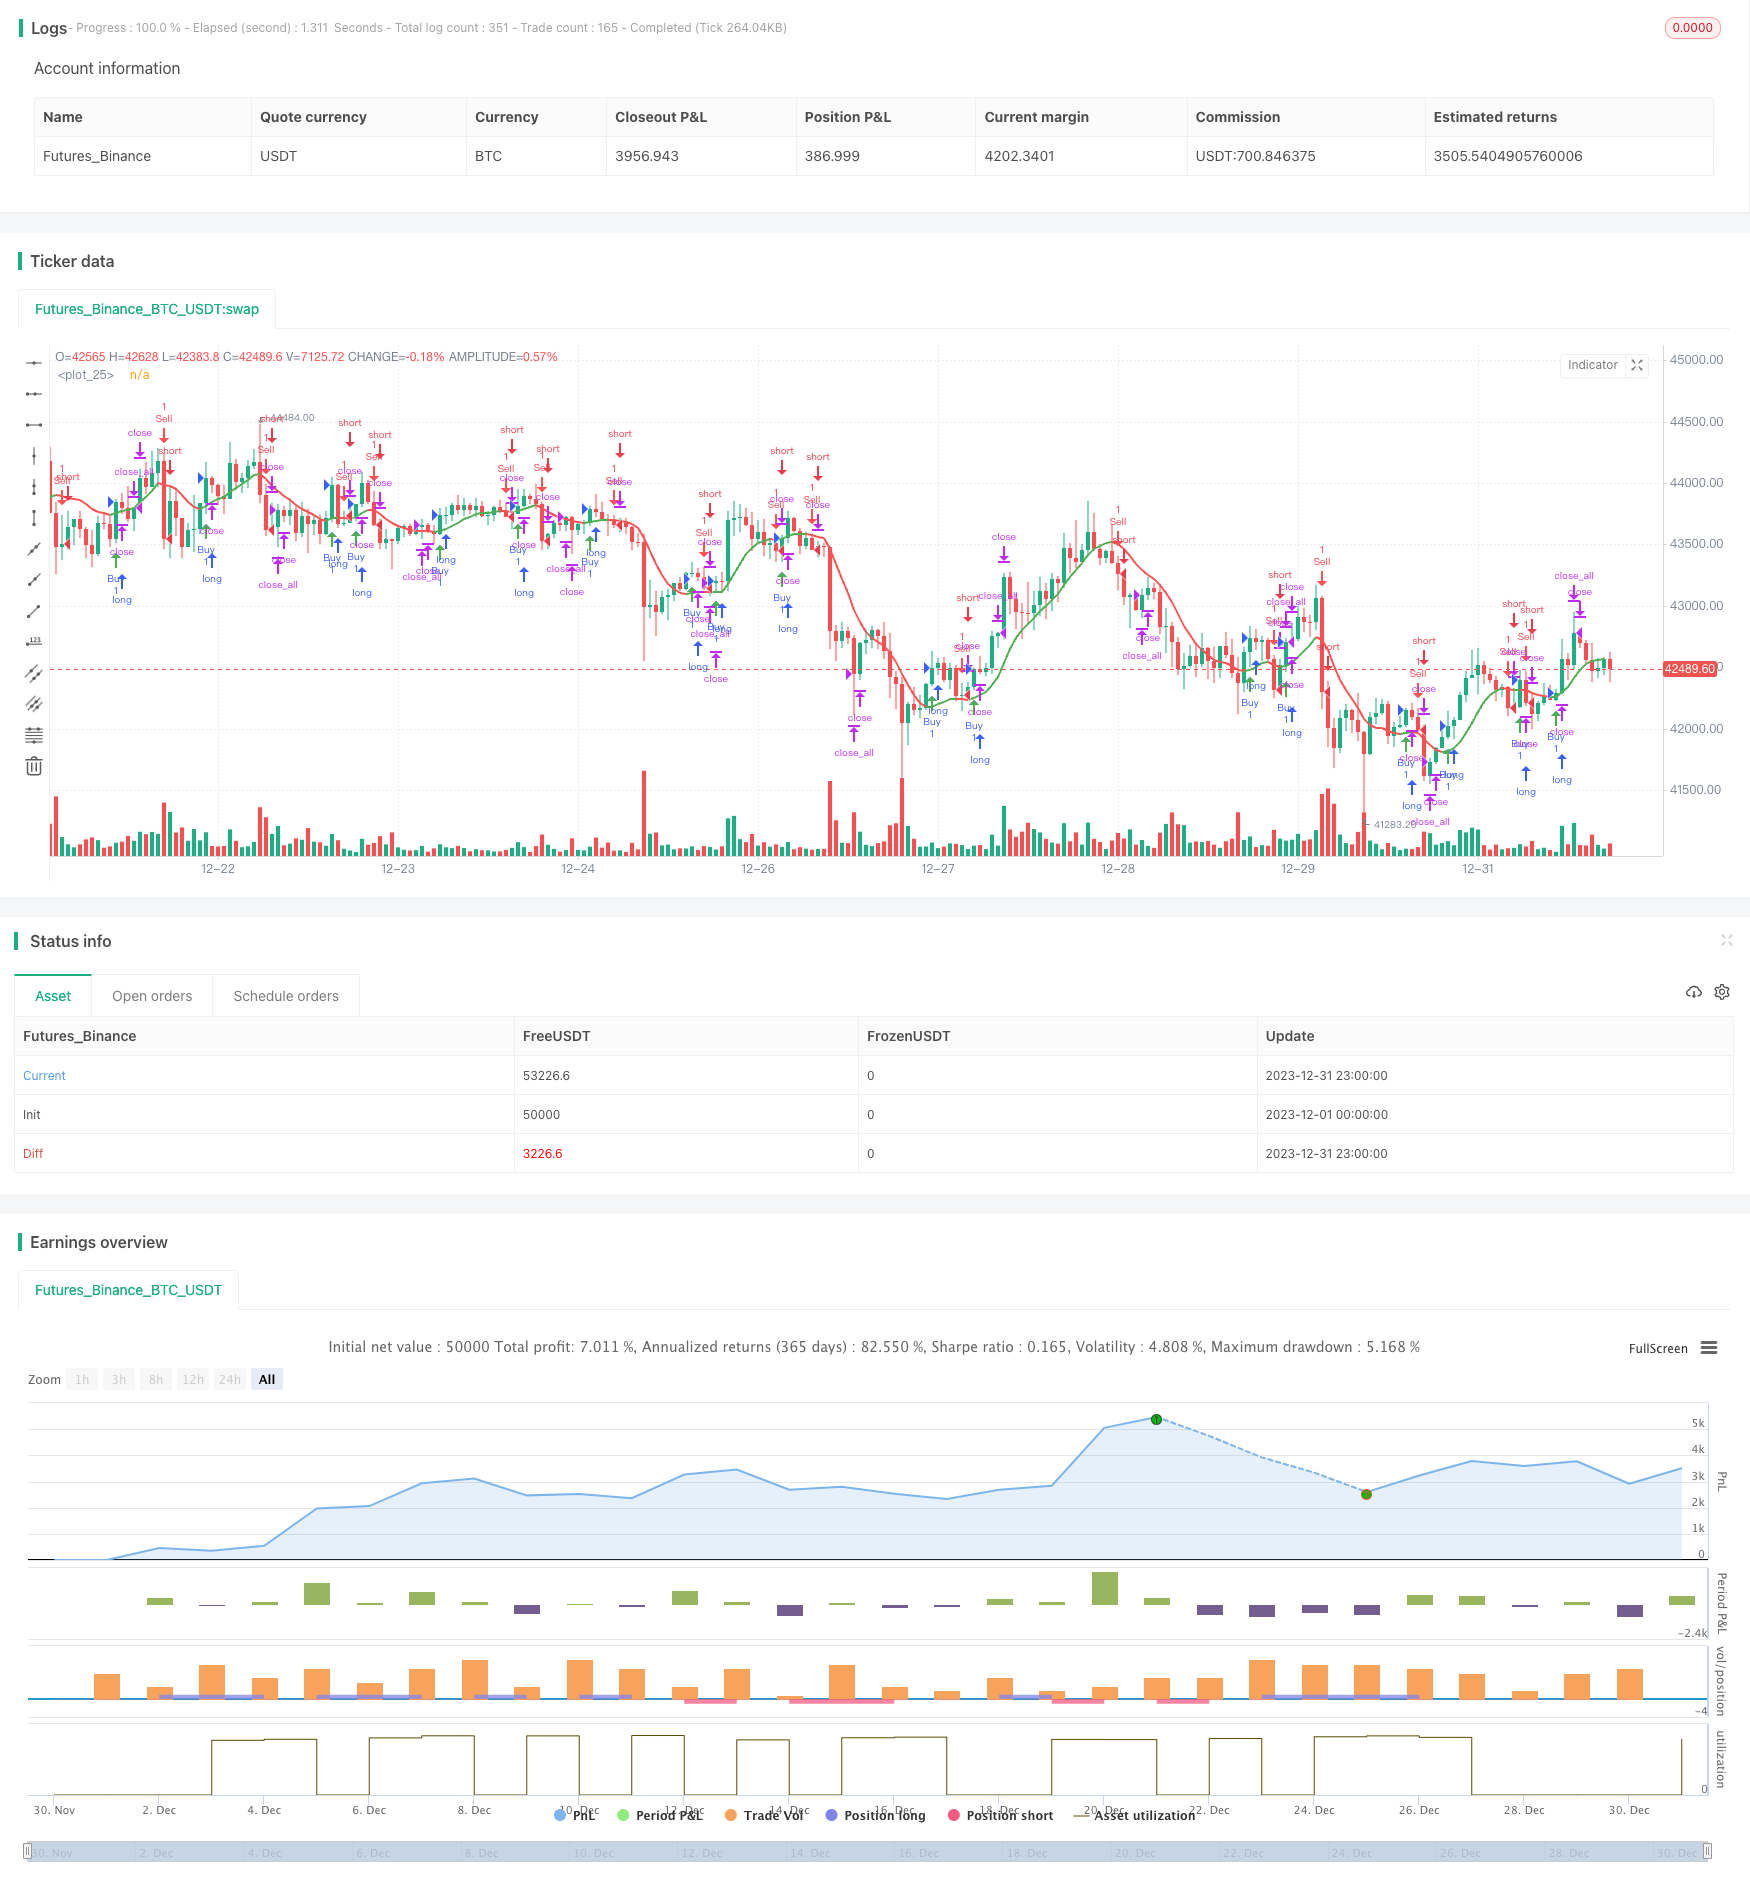
Overview
This strategy generates trading signals based on the difference between two moving averages. When the fast line crosses above the slow line, a buy signal is generated. When the fast line crosses below the slow line, a sell signal is generated. It belongs to the category of trend following strategies. The strategy is simple and easy to understand, suitable for medium-term trading.
Strategy Logic
The strategy calculates the difference between two EMAs with different parameters, and then computes another EMA based on this difference to generate trading signals. Specifically, it chooses a period, calculates 2 times EMA of period/2 as the fast line, and EMA of period as the slow line. The difference between these two EMAs constitutes the difference value diff. Then it calculates the EMA of diff based on the period of sqrt(period), resulting in the indicator line n1. When n1 crosses above 0, a buy signal is generated. When n1 crosses below 0, a sell signal is generated. Thus n1 reflects the trend direction of diff, which can be used to capture price trends.
The strategy is simple and direct, using the double moving average difference indicator to judge price trends. It belongs to a typical trend following strategy. It works well in trending markets, but may generate false signals during range-bound markets. Proper trend judgment and risk management should be used together with the strategy.
Advantage Analysis
The strategy has the following advantages:
The strategy logic is simple and intuitive, easy to understand and implement, suitable for beginners;
The moving average difference indicator is sensitive to price changes and can effectively capture trend changes;
The strategy has few parameters and is easy to optimize and adjust in real trading;
Long and short period indicators can be combined to adapt to different market environments;
Stop loss strategies can be configured according to personal risk preferences to reduce losses.
Risk Analysis
The strategy also has the following risks:
Higher false signal rate in range-bound markets, larger timeframe trends should be considered;
Unable to effectively determine trend reversal points, there is a certain lag;
The parameters of the difference indicator need to be monitored to prevent being too sensitive or lagging;
High trading frequency may lead to higher transaction costs, position sizing needs control.
The corresponding solutions are:
Combining long period moving averages to determine major trends, avoid wrongly entering during ranges;
Adding reversal indicators to determine entry and exit points, reduce lag risk;
Testing parameter combinations to find optimum parameters;
Optimizing stop loss strategies to reduce per trade loss.
Optimization Directions
The strategy can be optimized in the following aspects:
Test different moving average parameter combinations to find optimum parameters;
Add trend judgment indicators to distinguish between trending and range-bound markets;
Combine reversal indicators to improve entry accuracy;
Optimize stop loss strategies to reduce losses.
Testing different period parameters can improve the adaptability of the strategy to different market conditions. Adding trend filters can reduce false signals. Reversal indicators can improve timing of entries. These optimizations can enhance the stability and profitability of the strategy.
Conclusion
The trend following strategy based on moving average difference has a clear and easy to understand logic. By judging price trends using double moving average differences, it belongs to a typical trend chasing strategy. The strategy itself is very simple and easy to implement, suitable for medium-term trading, especially for beginners to study. But there are also certain risks with the strategy that need to be reduced through optimizations. With proper parameter tuning and risk control, the strategy can achieve good results.
Parameters
| Name | Default | What it controls |
|---|---|---|
| v_input_1 | 21 | Period |
Source Pine Script
/*backtest
start: 2023-12-01 00:00:00
end: 2023-12-31 23:59:59
period: 1h
basePeriod: 15m
exchanges: [{"eid":"Futures_Binance","currency":"BTC_USDT"}]
*/

//@version=5
strategy(title='Devick', overlay=true)

// Input parameters
period = input(title='Period', defval=21)

// Calculate moving averages
n2ma = 2 * ta.ema(close, math.round(period / 2))
nma = ta.ema(close, period)
diff = n2ma - nma
sqn = math.round(math.sqrt(period))

n2maPrev = 2 * ta.ema(close[1], math.round(period / 2))
nmaPrev = ta.ema(close[1], period)
diffPrev = n2maPrev - nmaPrev
sqnPrev = math.round(math.sqrt(period))

n1 = ta.ema(diff, sqn)
n2 = ta.ema(diffPrev, sqnPrev)

// Determine color based on condition
maColor = n1 > n2 ? color.green : color.red

// Plot moving average
ma = plot(n1, color=maColor, linewidth=2)

// Signals
buySignal = n1 > n2 and n1[1] <= n2[1]
sellSignal = n1 <= n2 and n1[1] > n2[1]

// Plot shapes for signals
plotshape(series=buySignal, title='Buy Signal', style=shape.arrowup, location=location.belowbar, color=color.green, size=size.small)
plotshape(series=sellSignal, title='Sell Signal', style=shape.arrowdown, location=location.abovebar, color=color.red, size=size.small)

// Alerts
alertcondition(condition=buySignal, title='Buy Signal', message='Buy Signal Detected')
alertcondition(condition=sellSignal, title='Sell Signal', message='Sell Signal Detected')

// Trading hours
openHour = 16
closeHour = 17

// Open position at 4 pm
openCondition = hour == openHour and minute == 0
strategy.entry("Buy", strategy.long, when=buySignal)
strategy.entry("Sell", strategy.short, when=sellSignal)
// Close all positions at 5 pm
closeCondition = hour == closeHour and minute == 0
strategy.close_all(when=closeCondition)
Published by ChaoZhang on the FMZ strategy square · last modified 2024-01-12. Collected in the Quant Trading Vault. Unvalidated research: re-test with your own data and costs before trusting it.
Build this with AgenKit
A spec is not a trading system. Paste this into your coding agent and AgenKit runs a specialist team — architecture, test-first build, risk gates, review — with paper trading on by default.
/agenkit build a production-grade trading bot with a backtest engine, risk controls and paper trading by default from strategies/Trend-Following-Strategy-Based-on-Moving-Average-Difference.md- npx agenkit install engineering-kit in your project
- Paste the command into your agent and approve each phase
- Get tests, backtest, risk controls and a paper-trading switch
Understand it first
Before you run this, read the lesson behind the idea and how to backtest it honestly. Specs like this one are the survivors of an unknown number of trials; deflate their results accordingly.
Related specs
- 200 EMA VWAP MFI Trend Following StrategyPine Script · Trend following · 1d
- 4 EMA Trend StrategyPine Script · Trend following · 1d
- ADX MA and EMA Long Only Trend Tracking StrategyPine Script · Trend following · 1d
- ATR Dynamic Trend Following and EMA Crossover Trading StrategyPine Script · Trend following · 1d
- ATR and Moving Average Crossover Hybrid StrategyPine Script · Trend following · 1h
- ATR and T3 Moving Average StrategyPine Script · Trend following · 5m