Trend Following Strategy Based on Support Resistance and Momentum Indicators Across Multiple Timeframes
This strategy combines multiple technical indicators including support/resistance levels, Supertrend, and moving averages across multiple timeframes to comprehensively determine the trend direction and implement a…
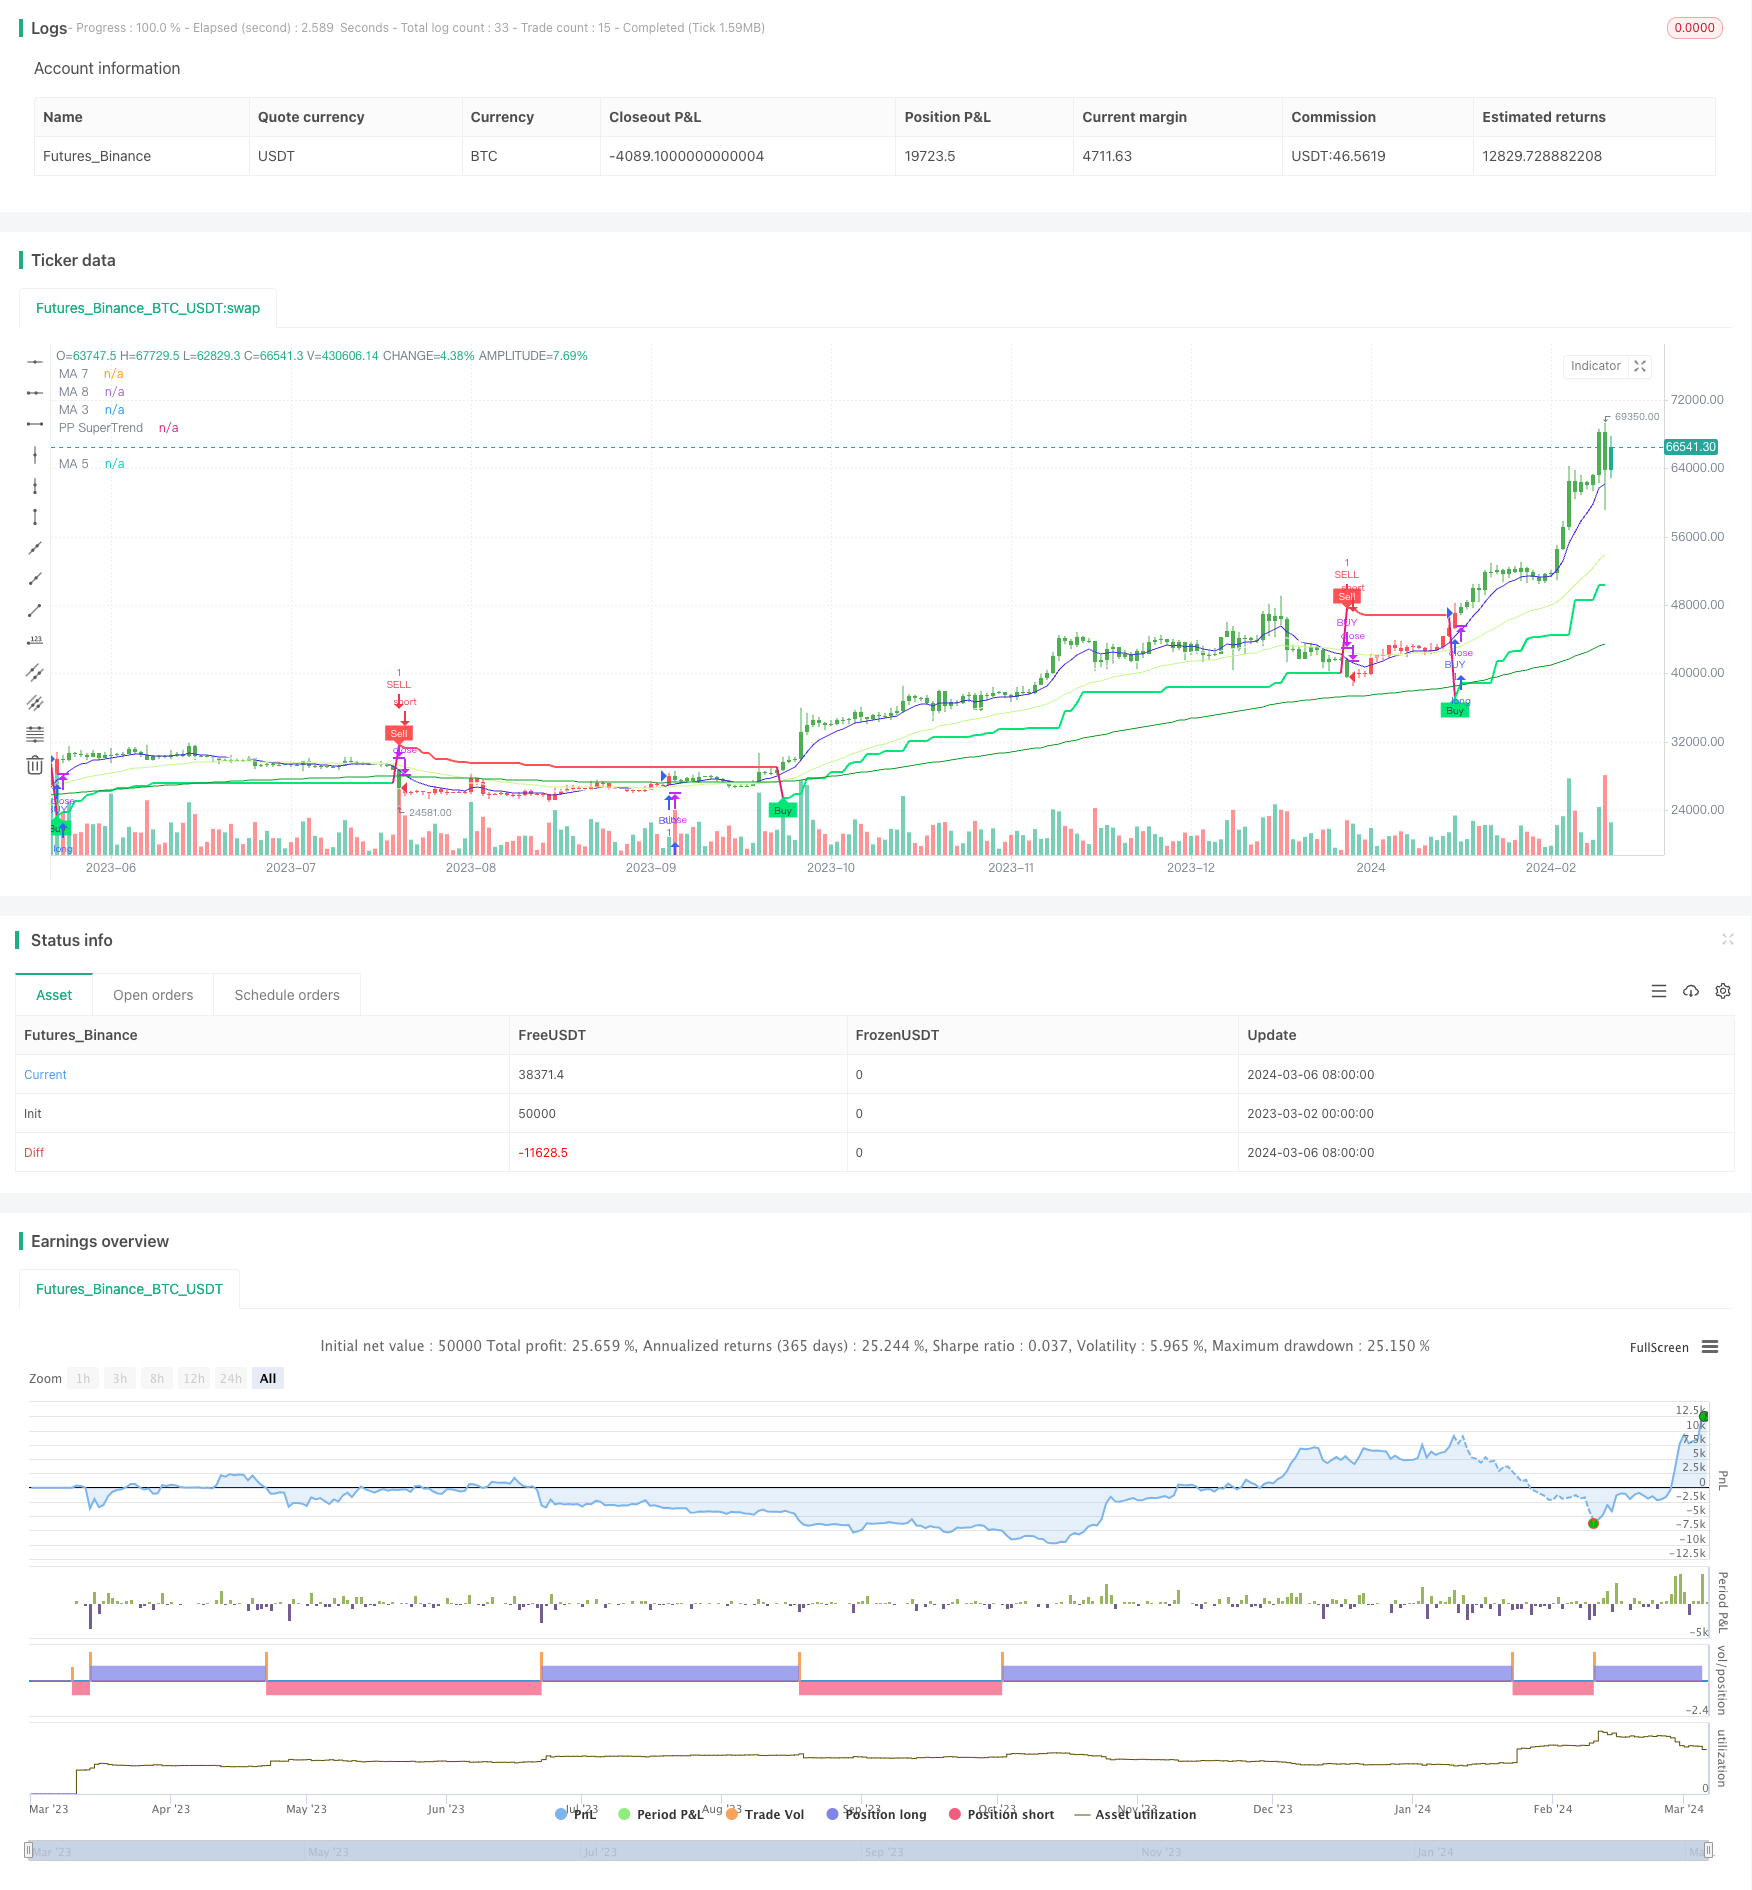
Strategy Overview
This strategy combines multiple technical indicators including support/resistance levels, Supertrend, and moving averages across multiple timeframes to comprehensively determine the trend direction and implement a trend-following trading system. The main idea of this strategy is to: first, use pivot points to determine the current support/resistance levels; then, use the Supertrend indicator to identify the current trend direction; and finally, use moving averages to filter out divergence. At the same time, the strategy also supports risk control measures such as setting trading time windows and limiting maximum positions.
Strategy Principles
- First, calculate the pivot points based on the highest and lowest prices over a certain past period to obtain the current support/resistance levels.
- Use the Supertrend indicator to determine the trend. Supertrend is a trend following indicator calculated from dynamic support/resistance levels.
- Use ATR for stop loss. This strategy incorporates ATR as a stop loss level on top of the original Supertrend.
- Use moving averages as a trend filter. Only go long when the trend is up and the price is above the moving average, and only go short when the trend is down and the price is below the moving average.
- Set a trading time window. Only open positions within a specific time interval to avoid trading at important time points.
- Manage long and short positions separately. Long and short signals trigger their respective opening and closing logics independently.
In summary, this strategy enters a position when the pivot point support/resistance, Supertrend direction, and moving average direction are all in agreement, and closes the position when any one of these conditions becomes invalid. This effectively captures trending market movements while controlling risks.
Advantage Analysis
- The advantage of trading based on support/resistance levels is that it conforms to the law of supply and demand in the market, and pivot points can dynamically reflect market equilibrium.
- Supertrend can effectively capture trends and stop losses in a timely manner. ATR stop loss further controls risk.
- Moving average filtering avoids counter-trend trading. Entering the market when the trend and moving average are in sync will result in a higher win rate.
- The customizable trading time window avoids trading at important time points to a certain extent, such as before the market opens and closes.
- Long and short signals operate independently, allowing for simultaneous holding of long and short positions, thus more fully utilizing market opportunities.
Risk Analysis
- The risk of frequent trading. This strategy may frequently open and close positions in a oscillating market, resulting in excessive transaction costs.
- Counter-trend trading may still occur. Although this strategy adopts moving average filtering, if the moving average itself goes against the major trend, counter-trend trading may still occur.
- The problem of parameter optimization. The strategy contains many parameters, such as the period and multiplier of Supertrend, and the period of moving averages. Different parameters will yield different results, and choosing the optimal parameter combination is a challenge.
- May fail under extreme market conditions. In extreme market conditions, such as sharp rises and falls, liquidity crises, etc., this strategy may not be able to stop losses in a timely manner.
Optimization Directions
- Introduce more medium- and long-term moving averages to improve the reliability of trend judgment and reduce frequent trading.
- Consider introducing volatility indicators, such as Bollinger Bands, to reduce trading in high-volatility markets.
- Optimize the various parameters to find the best parameter combination and improve the stability of the strategy.
- Set a hard stop loss under extreme market conditions to control risk. In addition, consider adding judgment of abnormal market fluctuations, such as price gaps and surges in trading volume, and reduce or stop trading during abnormalities.
Summary
This strategy integrates various technical analysis methods such as support/resistance, trend tracking, and momentum filtering to effectively profit from trending markets while controlling drawdown risk. Its advantages lie in clear and concise signals, clear logic, and suitability for medium- to long-term application. However, this strategy also has problems such as frequent trading, difficulty in parameter optimization, and insufficient risk control under extreme market conditions. In the future, it can be further improved by introducing more technical indicators, optimizing parameters, setting hard stop losses, and judging abnormal market conditions. In general, this strategy is a relatively mature trend-following strategy that, with appropriate optimization and improvement, can become a robust trading system. The strategy ideas can be used for reference, but they still need to be used prudently in combination with actual trading experience and market characteristics. Quantitative trading requires both mathematical logic and human subjective judgment, and only when the two are organically combined can ideal returns be created.
Parameters
| Name | Default | What it controls |
|---|---|---|
| v_input_1 | true | Pivot Point Period |
| v_input_2 | 4 | ATR Factor |
| v_input_3 | 72 | ATR Period |
| v_input_4 | false | Show Pivot Points |
| v_input_5 | true | Show Buy/Sell Labels |
| v_input_6 | false | Show PP Center Line |
| v_input_7 | false | Show Support/Resistance |
| v_input_8 | true | EMA |
| v_input_9 | false | Show MA 1 |
| v_input_10 | 13 | Length MA 1 |
| v_input_11 | 0 | Type MA 1: EMA | SMA | RMA | WMA | HMA | VWMA |
| v_input_12_close | 0 | MA1 Source: close | high | low | open | hl2 | hlc3 | hlcc4 | ohlc4 |
| v_input_13 | #eb9fee | Color MA 1 |
| v_input_14 | false | Show MA 2 |
| v_input_15 | 17 | Length MA 2 |
| v_input_16 | 0 | Type MA 2: EMA | SMA | RMA | WMA | HMA | VWMA |
| v_input_17_close | 0 | MA2 Source: close | high | low | open | hl2 | hlc3 | hlcc4 | ohlc4 |
| v_input_18 | #e6f141 | Color MA 2 |
| v_input_19 | true | Show MA 3 |
| v_input_20 | 34 | Length MA 3 |
| v_input_21 | 0 | Type MA 3: EMA | SMA | RMA | WMA | HMA | VWMA |
| v_input_22_close | 0 | MA3 Source: close | high | low | open | hl2 | hlc3 | hlcc4 | ohlc4 |
| v_input_23 | #c7f887 | Color MA 3 |
| v_input_24 | false | Show MA 4 |
| v_input_25 | 72 | Length MA 4 |
| v_input_26 | 0 | Type MA 4: EMA | SMA | RMA | WMA | HMA | VWMA |
| v_input_27_close | 0 | MA4 Source: close | high | low | open | hl2 | hlc3 | hlcc4 | ohlc4 |
| v_input_28 | #2f6999 | Color MA 4 |
| v_input_29 | true | Show MA 5 |
| v_input_30 | 144 | Length MA 5 |
| v_input_31 | 0 | Type MA 5: EMA | SMA | RMA | WMA | HMA | VWMA |
| v_input_32_close | 0 | MA5 Source: close | high | low | open | hl2 | hlc3 | hlcc4 | ohlc4 |
| v_input_33 | #0d9c25 | Color MA 5 |
| v_input_34 | true | Show MA 6 |
| v_input_35 | 610 | Length MA 6 |
| v_input_36 | 0 | Type MA 6: EMA | SMA | RMA | WMA | HMA | VWMA |
| v_input_37_close | 0 | MA6 Source: close | high | low | open | hl2 | hlc3 | hlcc4 | ohlc4 |
| v_input_38 | #ada198 | Color MA 6 |
| v_input_39 | true | Show MA 7 |
| v_input_40 | 8 | Length MA 7 |
| v_input_41 | 0 | Type MA 7: EMA | SMA | RMA | WMA | HMA | VWMA |
| v_input_42_close | 0 | MA7 Source: close | high | low | open | hl2 | hlc3 | hlcc4 | ohlc4 |
| v_input_43 | #4427e7 | Color MA 7 |
| v_input_44 | true | Show MA 8 |
| v_input_45 | 21 | Length MA 8 |
| v_input_46 | 0 | Type MA 8: EMA | SMA | RMA | WMA | HMA | VWMA |
| v_input_47_close | 0 | MA8 Source: close | high | low | open | hl2 | hlc3 | hlcc4 | ohlc4 |
| v_input_48 | white | Color MA 8 |
| v_input_49 | 3 | ATR Period |
| v_input_50_hlc3 | 0 | Source: hlc3 | high | low | open | hl2 | close | hlcc4 | ohlc4 |
| v_input_51 | 4 | ATR Multiplier |
| v_input_52 | true | Change ATR Calculation Method ? |
| v_input_53 | 20 | Moving Average Period |
| v_input_54_close | 0 | Moving Average Source: close | high | low | open | hl2 | hlc3 | hlcc4 | ohlc4 |
| v_input_55 | true | From Month |
| v_input_56 | true | From Day |
| v_input_57 | 2017 | From Year |
| v_input_58 | true | To Month |
| v_input_59 | true | To Day |
| v_input_60 | 9999 | To Year |
Source Pine Script
/*backtest
start: 2023-03-02 00:00:00
end: 2024-03-07 00:00:00
period: 1d
basePeriod: 1h
exchanges: [{"eid":"Futures_Binance","currency":"BTC_USDT"}]
*/

//@rpcoelho
// Based on © Julien_Eche "Pivot Point Supertrend" with optional EMAs ploted
//@version=4

strategy("PPS w/ EMAs", overlay=true)

prd = input(defval = 1, title="Pivot Point Period", minval = 1, maxval = 50)
Factor=input(defval = 4, title = "ATR Factor", minval = 1, step = 0.1)
Pd=input(defval = 72, title = "ATR Period", minval=1)
showpivot = input(defval = false, title="Show Pivot Points")
showlabel = input(defval = true, title="Show Buy/Sell Labels")
showcl = input(defval = false, title="Show PP Center Line")
showsr = input(defval = false, title="Show Support/Resistance")

/////////////////////////////////////////////////////////////////////////
// Switch Board
////////////////////////////////////////////////////////////////////////
// Define the switch board title as a label (since grouping is not available)
//switchboard_group = "████ Switch Board (Turn On/Off Overlay Indicators) ████"
//label.new(bar_index, high, switchboard_group, color=color.red)
// Create input controls for EMA and VWAP switches
switch_ema = input(true, title="EMA")

/////////////////////////////////////////////////////////////////////////
// EMA Selection
////////////////////////////////////////////////////////////////////////

ma_function(source, length, type) =>
    float ma = na
    if type == 'RMA'
        ma := rma(source, length)
    else if type == 'SMA'
        ma := sma(source, length)
    else if type == 'EMA'
        ma := ema(source, length)
    else if type == 'WMA'
        ma := wma(source, length)
    else if type == 'HMA'
        ma := length < 2 ? hma(source, 2) : hma(source, length)
    else
        ma := vwma(source, length)
    ma

// Moving Averages Line Title
//ma_group = "██████████ MAs Line ██████████"

// Inputs for MA 1
len1bool = input(false, title="Show MA 1")
len1 = input(13, title="Length MA 1")
ma_1_type = input("EMA", title="Type MA 1", options=["RMA", "SMA", "EMA", "WMA", "HMA", "VWMA"])
src_ma1 = input(title="MA1 Source", type=input.source, defval=close)
ma_1_colour = input(color.rgb(235, 159, 238), title="Color MA 1")

// Inputs for MA 2
len2bool = input(false, title="Show MA 2")
len2 = input(17, title="Length MA 2")
ma_2_type = input("EMA", title="Type MA 2", options=["RMA", "SMA", "EMA", "WMA", "HMA", "VWMA"])
src_ma2 = input(title="MA2 Source", type=input.source, defval=close)
ma_2_colour = input(color.rgb(230, 241, 65), title="Color MA 2")

// Inputs for MA 3
len3bool = input(true, title="Show MA 3")
len3 = input(34, title="Length MA 3")
ma_3_type = input("EMA", title="Type MA 3", options=["RMA", "SMA", "EMA", "WMA", "HMA", "VWMA"])
src_ma3 = input(title="MA3 Source", type=input.source, defval=close)
ma_3_colour = input(#c7f887, title="Color MA 3")

// Inputs for MA 4
len4bool = input(false, title="Show MA 4")
len4 = input(72, title="Length MA 4")
ma_4_type = input("EMA", title="Type MA 4", options=["RMA", "SMA", "EMA", "WMA", "HMA", "VWMA"])
src_ma4 = input(title="MA4 Source", type=input.source, defval=close)
ma_4_colour = input(#2f6999, title="Color MA 4")

// Inputs for MA 5
len5bool = input(true, title="Show MA 5")
len5 = input(144, title="Length MA 5")
ma_5_type = input("EMA", title="Type MA 5", options=["RMA", "SMA", "EMA", "WMA", "HMA", "VWMA"])
src_ma5 = input(title="MA5 Source", type=input.source, defval=close)
ma_5_colour = input(color.rgb(13, 156, 37), title="Color MA 5")

// Inputs for MA 6
len6bool = input(true, title="Show MA 6")
len6 = input(610, title="Length MA 6")
ma_6_type = input("EMA", title="Type MA 6", options=["RMA", "SMA", "EMA", "WMA", "HMA", "VWMA"])
src_ma6 = input(title="MA6 Source", type=input.source, defval=close)
ma_6_colour = input(color.rgb(173, 161, 152), title="Color MA 6")

// Inputs for MA 7
len7bool = input(true, title="Show MA 7")
len7 = input(8, title="Length MA 7")
ma_7_type = input("EMA", title="Type MA 7", options=["RMA", "SMA", "EMA", "WMA", "HMA", "VWMA"])
src_ma7 = input(title="MA7 Source", type=input.source, defval=close)
ma_7_colour = input(color.rgb(68, 39, 231), title="Color MA 7")

// Inputs for MA 8
len8bool = input(true, title="Show MA 8")
len8 = input(21, title="Length MA 8")
ma_8_type = input("EMA", title="Type MA 8", options=["RMA", "SMA", "EMA", "WMA", "HMA", "VWMA"])
src_ma8 = input(title="MA8 Source", type=input.source, defval=close)
ma_8_colour = input(color.white, title="Color MA 8")

ema1 = security(syminfo.tickerid, timeframe.period, ma_function(src_ma1, len1, ma_1_type))
ema2 = security(syminfo.tickerid, timeframe.period, ma_function(src_ma2, len2, ma_2_type))
ema3 = security(syminfo.tickerid, timeframe.period, ma_function(src_ma3, len3, ma_3_type))
ema4 = security(syminfo.tickerid, timeframe.period, ma_function(src_ma4, len4, ma_4_type))
ema5 = security(syminfo.tickerid, timeframe.period, ma_function(src_ma5, len5, ma_5_type))
ema6 = security(syminfo.tickerid, timeframe.period, ma_function(src_ma6, len6, ma_6_type))
ema7 = security(syminfo.tickerid, timeframe.period, ma_function(src_ma7, len7, ma_7_type))
ema8 = security(syminfo.tickerid, timeframe.period, ma_function(src_ma8, len8, ma_8_type))

plot(len1bool and switch_ema ? ema1:na, color=ma_1_colour, linewidth=1, title='MA 1')
plot(len2bool and switch_ema? ema2:na, color=ma_2_colour, linewidth=1, title='MA 2')
plot(len3bool and switch_ema? ema3:na, color=ma_3_colour, linewidth=1, title='MA 3')
plot(len4bool and switch_ema? ema4:na, color=ma_4_colour, linewidth=1, title='MA 4')
plot(len5bool and switch_ema? ema5:na, color=ma_5_colour, linewidth=1, title='MA 5')
plot(len6bool and switch_ema? ema6:na, color=ma_6_colour, linewidth=2, title='MA 6')
plot(len7bool and switch_ema? ema7:na, color=ma_7_colour, linewidth=1, title='MA 7')
plot(len8bool and switch_ema? ema8:na, color=ma_8_colour, linewidth=1, title='MA 8')


// get Pivot High/Low
float ph = pivothigh(prd, prd)
float pl = pivotlow(prd, prd)

// drawl Pivot Points if "showpivot" is enabled
plotshape(ph and showpivot, text="H",  style=shape.labeldown, color=na, textcolor=color.red, location=location.abovebar, transp=0, offset = -prd)
plotshape(pl and showpivot, text="L",  style=shape.labeldown, color=na, textcolor=color.lime, location=location.belowbar, transp=0, offset = -prd)

// calculate the Center line using pivot points
var float center = na
float lastpp = ph ? ph : pl ? pl : na
if lastpp
    if na(center)
        center := lastpp
    else
        //weighted calculation
        center := (center * 2 + lastpp) / 3

// upper/lower bands calculation
Up = center - (Factor * atr(Pd))
Dn = center + (Factor * atr(Pd))

// get the trend
float TUp = na
float TDown = na
Trend = 0
TUp := close[1] > TUp[1] ? max(Up, TUp[1]) : Up
TDown := close[1] < TDown[1] ? min(Dn, TDown[1]) : Dn
Trend := close > TDown[1] ? 1: close < TUp[1]? -1: nz(Trend[1], 1)
Trailingsl = Trend == 1 ? TUp : TDown

// plot the trend
linecolor = Trend == 1 and nz(Trend[1]) == 1 ? color.lime : Trend == -1 and nz(Trend[1]) == -1 ? color.red : na
plot(Trailingsl, color = linecolor ,  linewidth = 2, title = "PP SuperTrend")

plot(showcl ? center : na, color = showcl ? center < hl2 ? color.blue : color.red : na)

// check and plot the signals
bsignal = Trend == 1 and Trend[1] == -1
ssignal = Trend == -1 and Trend[1] == 1
plotshape(bsignal and showlabel ? Trailingsl : na, title="Buy", text="Buy", location = location.absolute, style = shape.labelup, size = size.tiny, color = color.lime, textcolor = color.black, transp = 0)
plotshape(ssignal and showlabel ? Trailingsl : na, title="Sell", text="Sell", location = location.absolute, style = shape.labeldown, size = size.tiny, color = color.red, textcolor = color.white, transp = 0)

//get S/R levels using Pivot Points
float resistance = na
float support = na
support := pl ? pl : support[1]
resistance := ph ? ph : resistance[1]

// if enabled then show S/R levels
plot(showsr and support ? support : na, color = showsr and support ? color.lime : na, style = plot.style_circles, offset = -prd)
plot(showsr and resistance ? resistance : na, color = showsr and resistance ? color.red : na, style = plot.style_circles, offset = -prd)

// Trend Filter from SuperTrend Long Strategy
Periods = input(title="ATR Period", type=input.integer, defval=3)
src = input(hlc3, title="Source")
Multiplier = input(title="ATR Multiplier", type=input.float, step=0.1, defval=4.0)
changeATR = input(title="Change ATR Calculation Method ?", type=input.bool, defval=true)

// Combine the SuperTrend calculations
atr2 = sma(tr, Periods)
atr = changeATR ? atr(Periods) : atr2

up = src - (Multiplier * atr)
up1 = nz(up[1], up)
up := close[1] > up1 ? max(up, up1) : up

dn = src + (Multiplier * atr)
dn1 = nz(dn[1], dn)
dn := close[1] < dn1 ? min(dn, dn1) : dn

trend = 1
trend := nz(trend[1], trend)
trend := trend == -1 and close > dn1 ? 1 : trend == 1 and close < up1 ? -1 : trend

// Moving Average as Trend Filter
periodes_ma = input(title="Moving Average Period", type=input.integer, defval=20)
src_ma = input(title="Moving Average Source", type=input.source, defval=close)
ma = sma(src_ma, periodes_ma)

// Strategy Entry Conditions
FromMonth = input(defval = 1, title = "From Month", minval = 1, maxval = 12)
FromDay   = input(defval = 1, title = "From Day", minval = 1, maxval = 31)
FromYear  = input(defval = 2017, title = "From Year", minval = 999)
ToMonth   = input(defval = 1, title = "To Month", minval = 1, maxval = 12)
ToDay     = input(defval = 1, title = "To Day", minval = 1, maxval = 31)
ToYear    = input(defval = 9999, title = "To Year", minval = 999)

start     = timestamp(FromYear, FromMonth, FromDay, 00, 00)
finish    = timestamp(ToYear, ToMonth, ToDay, 23, 59)

window()  => true

// Combined entry conditions
longCondition = (trend == 1 and trend[1] == -1 and close > ma) or (bsignal and window())
shortCondition = (trend == -1 and trend[1] == 1 and close < ma) or (ssignal and window())

if (longCondition)
    strategy.entry("BUY", strategy.long)

if (shortCondition)
    strategy.close("BUY")
    strategy.entry("SELL", strategy.short)

buy1 = barssince((trend == 1 and trend[1] == -1 and close > ma) or (bsignal and window()))
sell1 = barssince((trend == -1 and trend[1] == 1 and close < ma) or (ssignal and window()))
color1 = buy1[1] < sell1[1] ? color.green : buy1[1] > sell1[1] ? color.red : na
barcolor(color1)
Published by ChaoZhang on the FMZ strategy square · last modified 2024-03-08. Collected in the Quant Trading Vault. Unvalidated research: re-test with your own data and costs before trusting it.
Build this with AgenKit
A spec is not a trading system. Paste this into your coding agent and AgenKit runs a specialist team — architecture, test-first build, risk gates, review — with paper trading on by default.
/agenkit build a production-grade trading bot with a backtest engine, risk controls and paper trading by default from strategies/Trend-Following-Strategy-Based-on-Support-Resistance-and-Momentum-Indicators-Across-Multiple-Timeframes.md- npx agenkit install engineering-kit in your project
- Paste the command into your agent and approve each phase
- Get tests, backtest, risk controls and a paper-trading switch
Understand it first
Before you run this, read the lesson behind the idea and how to backtest it honestly. Specs like this one are the survivors of an unknown number of trials; deflate their results accordingly.
Related specs
- Multi Indicator Trend Momentum Trading Strategy Based on SuperTrendPine Script · Momentum · 2d
- Multi Indicator Comprehensive Analysis Quantitative Trading Strategy Trend Momentum and Volatility Collaborative Prediction ModelPine Script · Momentum · 3m
- Oscillator Candles Momentum Trading StrategyPine Script · Momentum · 1h
- Advanced Multi Indicator Trend Following and Momentum Quantitative Trading StrategyPine Script · Momentum · 1h
- KST EMA Momentum Trend Following StrategyPine Script · Momentum · 1d
- Moving Average Candle Regression StrategyPine Script · Momentum · 15m