Strategy vault / Trend following
Trend Following Strategy with 3 EMAs DMI and MACD
This is a trend following strategy that uses a combination of 3 exponential moving averages (EMA), a trend indicator (DMI), and a moving average convergence indicator (MACD) to determine trend direction and generate…
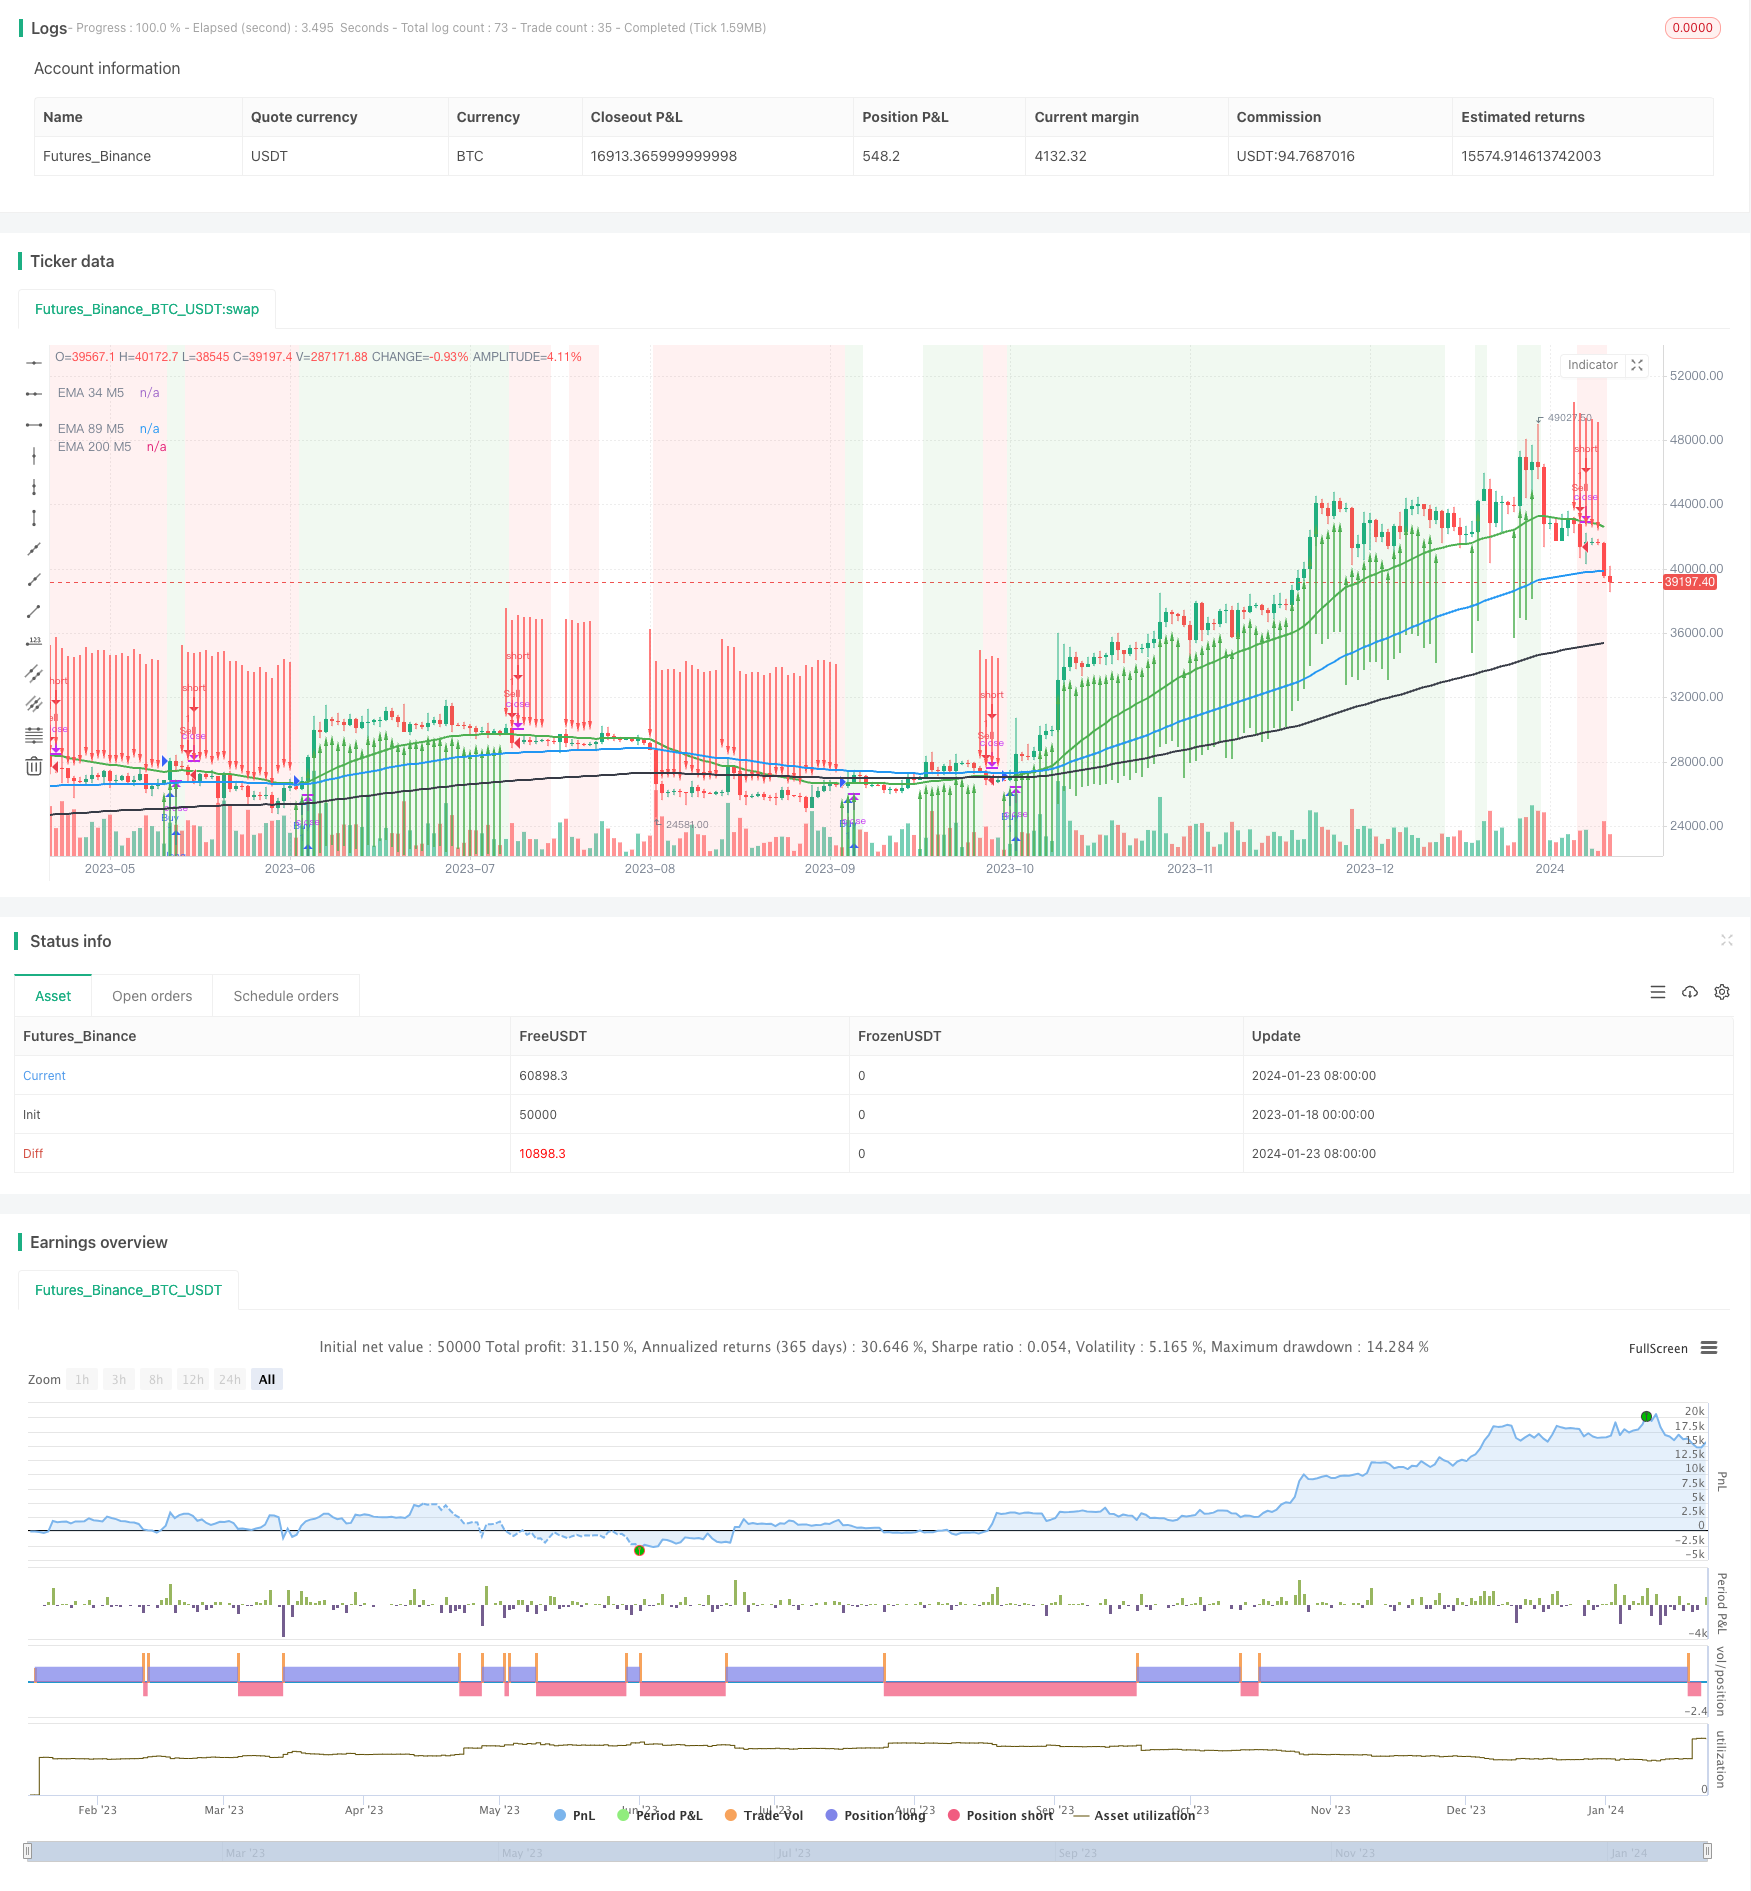
Overview
This is a trend following strategy that uses a combination of 3 exponential moving averages (EMA), a trend indicator (DMI), and a moving average convergence indicator (MACD) to determine trend direction and generate buy and sell signals. Key components include EMA golden cross signals, DMI for trend strength and MACD for momentum confirmation.
Strategy Logic
The core logic relies on 3 EMAs - 34, 89 and 200 - calculated on the M5 period to identify the overall trend. The 34-period EMA provides near-term direction, while the 89 and 200 EMA define mid- to long-term trends.
When the buy signal is triggered:
- Closing price crosses above34 EMA
- +DI(Bullish trend movement)> 17
- ADX(Trend Strength)> -DI
When a sell signal is generated:
- Closing price crosses below34 EMA
- -DI(Bearish trend movement)> 17
- ADX > +DI
There is also a MACD indicator to provide additional confirmation before entering the market.
Advantage
This strategy has several key advantages:
- Catching trend shifts early with short-term EMA golden crosses
- Use multiple EMAs to determine trend strength under different time frames
- DMIFilters help avoid false signals by checking strong trending movements
- MACDProvide momentum confirmation to improve the quality and probability of trading opportunities
- The combination of indicators improves the accuracy and timing of entry signals
Risk
Main risks to consider:
- Relying only on the EMA golden cross is susceptible to misleading and misalignment
- Multiple confirmations may cause a lag at the point of signal generation
- Easily affected by sudden trend reversals
Mitigation Method:
- Use appropriate stop-loss and position management
- Optimize EMA parameters based on current market conditions
- Observe the price action for visual confirmation
Optimization Direction
Further improvement of the strategy:
- Add indicators like RSI to determine overbought and oversold zones
- Combine volume analysis to generate stronger signals
- Optimize indicators and parameters based on different assets and timeframes
- Use machine learning technology to continuously learn from new market data
Summary
Overall, this is a powerful trend following system that uses a combination of simple but practical indicators to follow the trend. The three-EMA configuration determines the trend under multiple time frames, and DMI and MACD checks improve entry timing and profit probability. Paired with proper optimization and risk management, it can be an effective tool for trend traders.
Parameters
| Name | Default | What it controls |
|---|---|---|
| v_input_1 | 14 | DI Length |
| v_input_2 | 12 | Fast Length |
| v_input_3 | 26 | Slow Length |
| v_input_4 | 9 | Signal Length |
Source Pine Script
/*backtest
start: 2023-01-18 00:00:00
end: 2024-01-24 00:00:00
period: 1d
basePeriod: 1h
exchanges: [{"eid":"Futures_Binance","currency":"BTC_USDT"}]
*/

//@version=5
strategy("2 EMA di+ Buy Sell, strategy ", overlay=true)

// Define the EMA calculation function
ema(src, length) =>
    ta.ema(src, length)

// Calculate and plot EMA on M5
ema34_M5 = ema(close, 34)
ema89_M5 = ema(close, 89)
ema200_M5 = ema(close, 200)

// Plot EMAs
plot(ema34_M5, color=color.green, title="EMA 34 M5", linewidth=2)
plot(ema89_M5, color=color.blue, title="EMA 89 M5", linewidth=2)
plot(ema200_M5, color=color.black, title="EMA 200 M5", linewidth=2)

// Define DMI parameters
len = input(14, title="DI Length")
up = ta.change(high)
down = -ta.change(low)
plusDM = na(up) ? na : (up > down and up > 0 ? up : 0)
minusDM = na(down) ? na : (down > up and down > 0 ? down : 0)
trur = ta.rma(ta.tr, len)
plusDI = 100 * ta.rma(plusDM, len) / trur
minusDI = 100 * ta.rma(minusDM, len) / trur

// Calculate ADX
adxValue = 100 * ta.rma(math.abs(plusDI - minusDI) / (plusDI + minusDI == 0 ? 1 : plusDI + minusDI), len)

// Define MACD parameters
fastLength = input(12, title="Fast Length")
slowLength = input(26, title="Slow Length")
signalLength = input(9, title="Signal Length")

// Calculate MACD
[macdLine, signalLine, _] = ta.macd(close, fastLength, slowLength, signalLength)

// Create buy/sell conditions
buyCondition = close > ema34_M5 and plusDI > 17 and adxValue > minusDI
sellCondition = close < ema34_M5 and minusDI > 17 and adxValue > plusDI

// Strategy logic
strategy.entry("Buy", strategy.long, when = buyCondition)
strategy.entry("Sell", strategy.short, when = sellCondition)

// Create alerts for buy/sell signals
alertcondition(buyCondition, title="Buy Signal", message="Buy Signal")
alertcondition(sellCondition, title="Sell Signal", message="Sell Signal")

// Plot buy/sell arrows on the price chart
bgcolor(buyCondition ? color.new(color.green, 90) : sellCondition ? color.new(color.red, 90) : na)

plotarrow(buyCondition ? 1 : sellCondition ? -1 : na, colorup=color.new(color.green, 0), colordown=color.new(color.red, 0), offset=-1)
Published by ChaoZhang on the FMZ strategy square · last modified 2024-01-25. Collected in the Quant Trading Vault. Unvalidated research: re-test with your own data and costs before trusting it.
Build this with AgenKit
A spec is not a trading system. Paste this into your coding agent and AgenKit runs a specialist team — architecture, test-first build, risk gates, review — with paper trading on by default.
/agenkit build a production-grade trading bot with a backtest engine, risk controls and paper trading by default from strategies/Trend-Following-Strategy-with-3-EMAs-DMI-and-MACD.md- npx agenkit install engineering-kit in your project
- Paste the command into your agent and approve each phase
- Get tests, backtest, risk controls and a paper-trading switch
Understand it first
Before you run this, read the lesson behind the idea and how to backtest it honestly. Specs like this one are the survivors of an unknown number of trials; deflate their results accordingly.
Related specs
- EMA SMA Multi Indicator Comprehensive Trend Following StrategyPine Script · Trend following · 1h
- Dynamic Trend Identification Strategy with Exponential Moving Average and Adaptive Volatility ThresholdPine Script · Trend following · 1h
- Multi Indicator Crossover Dynamic Stop Loss Trend Following StrategyPine Script · Trend following · 1d
- Dual Trend Strategy with EMA Crossover and RSI FilterPine Script · Trend following · 1d
- Multi Timeframe Volume and Trend Confluence Trading StrategyPine Script · Trend following · 1d
- Multi timeframe Trend Tracking Strategy Based on Impulse MACD and Dual Moving Average CrossoverPine Script · Trend following · 1d