Trend Following Strategy with MACD and Donchian Channel
This strategy combines the Donchian Channel indicator and MACD indicator to determine the trend. It belongs to a typical trend following strategy. It goes long when the price breaks out the upper band and MACD shows…
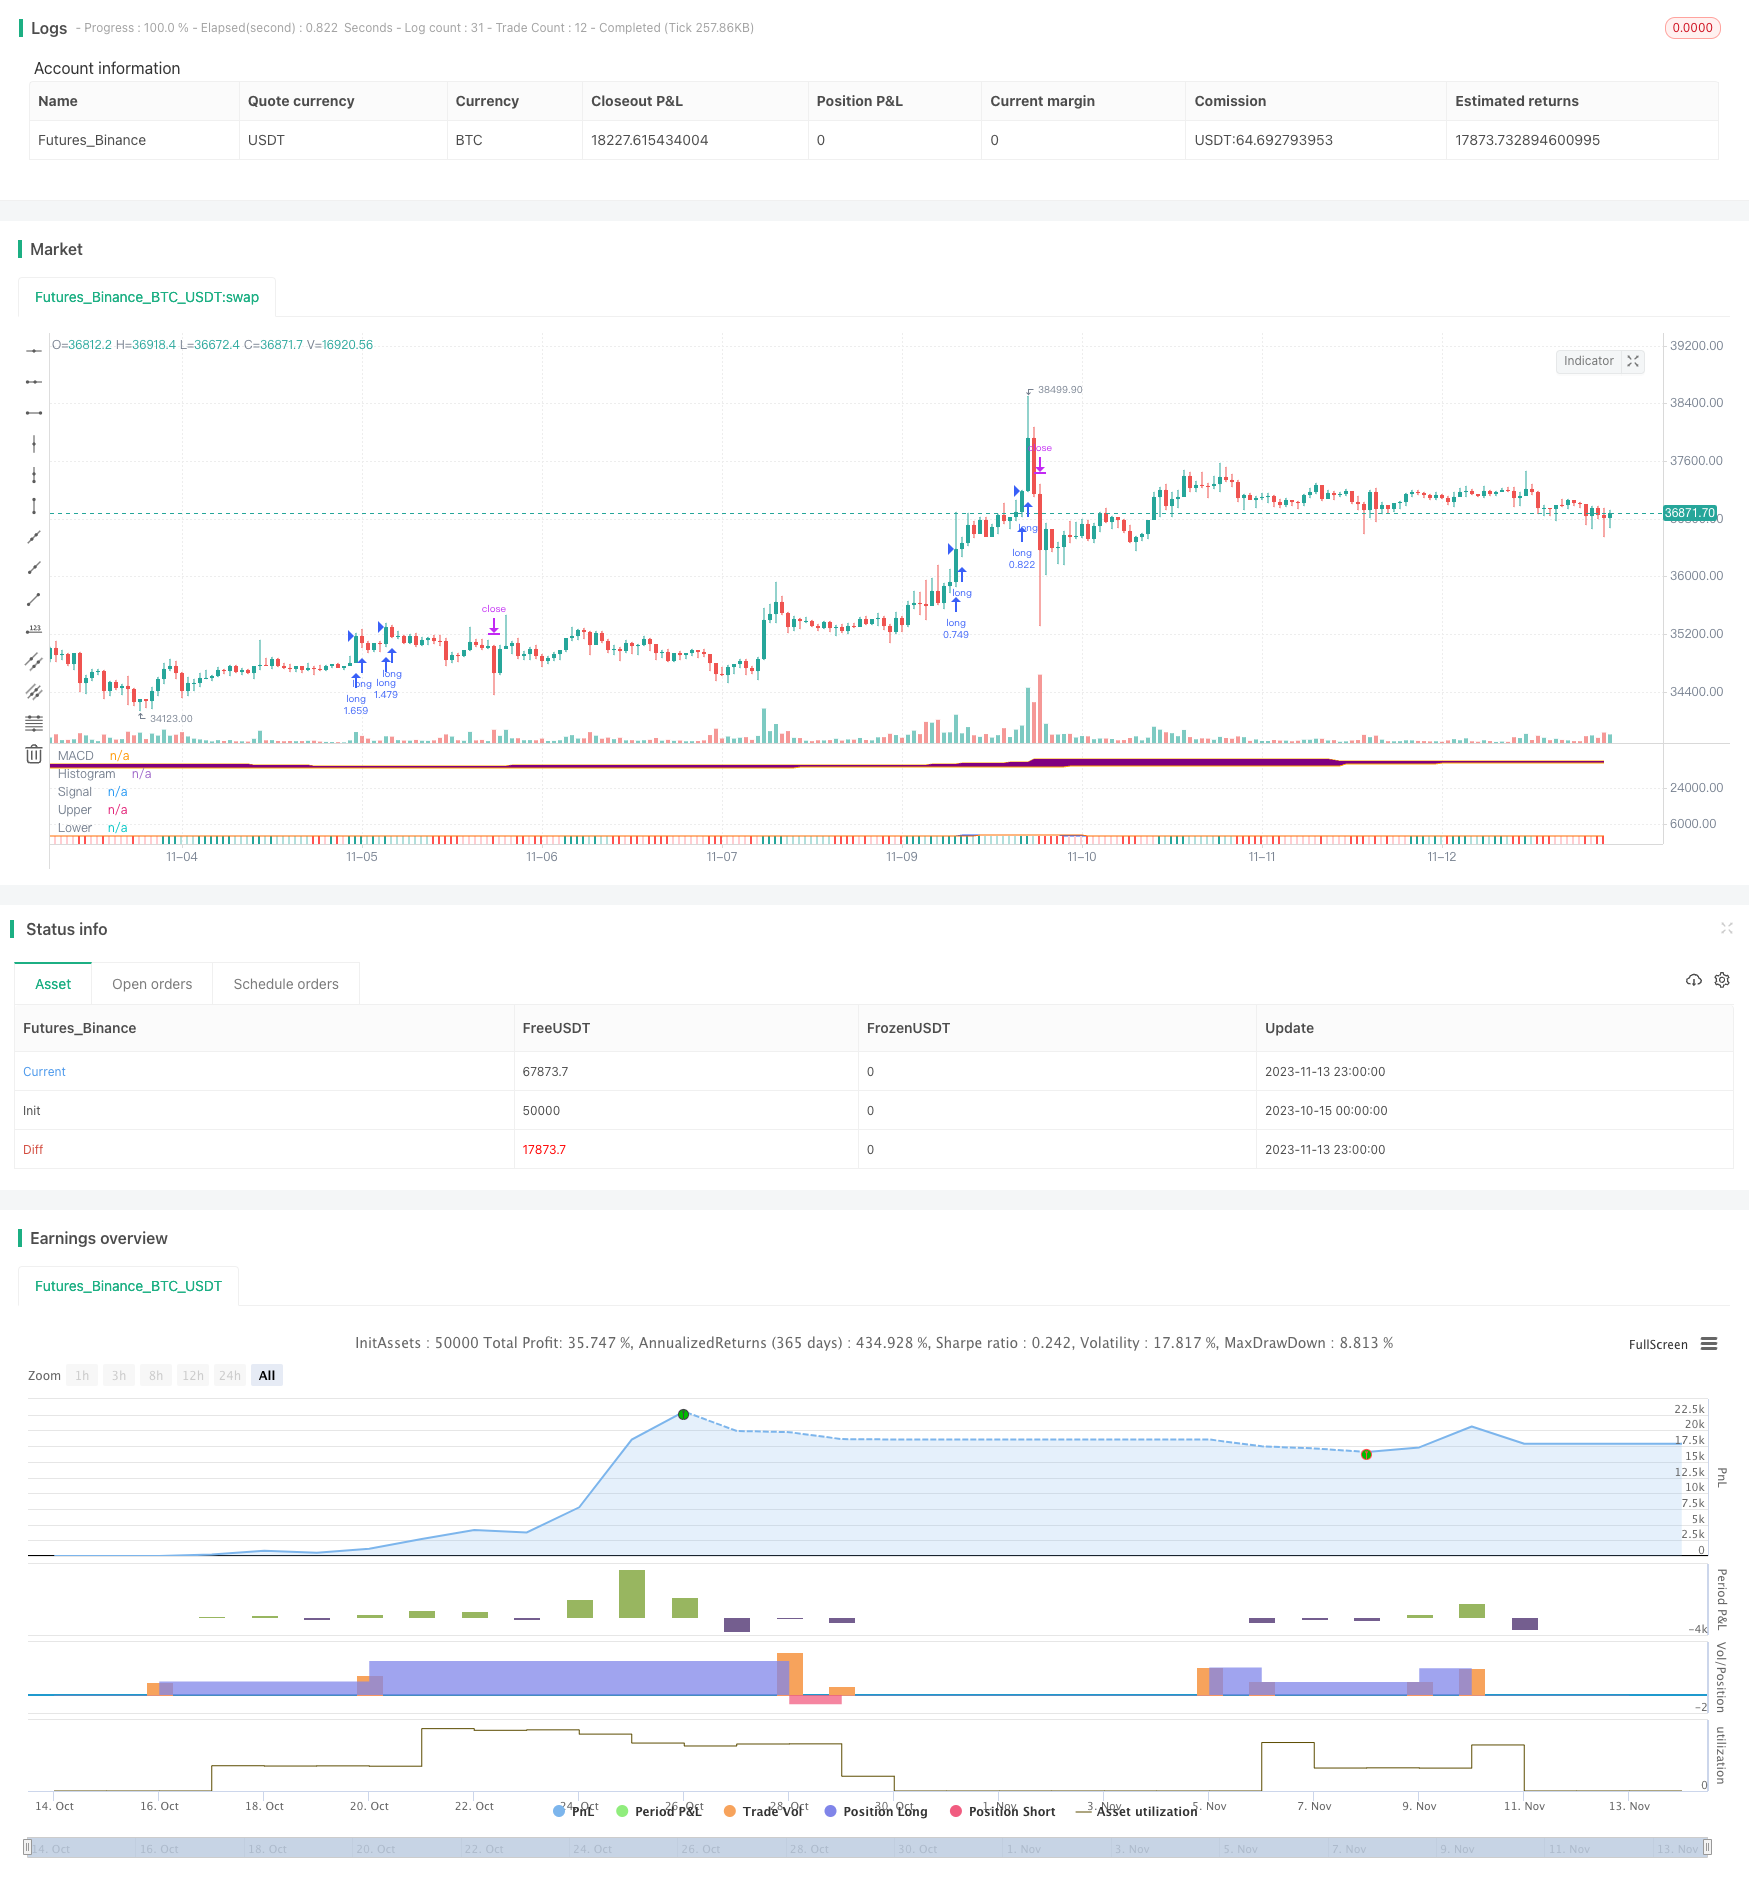
Overview
This strategy combines the Donchian Channel indicator and MACD indicator to determine the trend. It belongs to a typical trend following strategy. It goes long when the price breaks out the upper band and MACD shows golden cross, and goes short when the price breaks the lower band and MACD shows death cross. The ATR indicator is used to calculate the stop loss.
Strategy Logic
Calculate the MACD indicator, including fast line, slow line and histogram.
Calculate the upper and lower Donchian Channel bands. The upper band is the highest price over N days, the lower band is the lowest price over N days.
When the price breaks the upper band, and the MACD fast line crosses above the slow line, go long.
When the price breaks the lower band, and the MACD fast line crosses below the slow line, go short.
Use ATR indicator to calculate the stop loss for this strategy, which is set to ATR value multiplied by a coefficient from the current price.
Close the position when a reverse signal appears.
Advantage Analysis
This strategy combines trend judgment indicators and channel indicators, which can effectively track trends. MACD indicator judges price trend and momentum. Donchian Channel judges direction. The ATR stop loss limits the loss per trade.
Advantages are:
The strategy is simple with few parameters, easy to implement.
It can open position along the trend, and capture trend opportunities in time.
ATR stop loss controls risk.
Drawdown can be controlled to some extent.
Risk Analysis
There are also some risks:
Improper parameter settings of Donchian Channel may cause false signals.
Improper MACD parameters may also lead to lagging signals.
A too wide stop loss setting may lead to expanded loss.
Sharp market reversal may lead to huge loss.
The strategy tends to overtrade.
Solutions:
Optimize parameters, select stocks cautiously.
Strict stop loss, trailing stop loss.
Adjust position sizing properly.
Optimization Directions
The strategy can be optimized in the following aspects:
Optimize MACD parameters to improve sensitivity.
Optimize stop loss algorithm to make it closer to price.
Add position sizing mechanism according to trend strength.
Add filters to avoid false signals.
Add selection criteria for trading instruments.
Add judgement of trading time period.
Summary
In summary, this is a typical trend following strategy. It combines Donchian Channel for trend direction and MACD for trend strength. It can follow the trend effectively and control risk. By optimizing parameters, stop loss, position sizing etc, the stability and profitability can be further improved. The strategy suits investors who require high accuracy in trend judgment.
Parameters
| Name | Default | What it controls |
|---|---|---|
| v_input_1 | 12 | Fast Length |
| v_input_2 | 26 | Slow Length |
| v_input_3_close | 0 | Source: close | high | low | open | hl2 | hlc3 | hlcc4 | ohlc4 |
| v_input_int_1 | 9 | Signal Smoothing |
| v_input_string_1 | 0 | Oscillator MA Type: EMA | SMA |
| v_input_string_2 | 0 | Signal Line MA Type: EMA | SMA |
| v_input_4 | #2962FF | (?Color Settings)MACD Line |
| v_input_5 | #FF6D00 | Signal Line |
| v_input_6 | #26A69A | (?Histogram)Above Grow |
| v_input_7 | #B2DFDB | Fall |
| v_input_8 | #FFCDD2 | Below Grow |
| v_input_9 | #FF5252 | Fall |
| v_input_int_2 | 50 | (?Donchian Channels Inputs)Length Upper Channel |
| v_input_int_3 | 50 | Length Lower Channel |
| v_input_color_1 | purple | Fill Color |
| v_input_color_2 | orange | Color Upper Channel |
| v_input_color_3 | orange | Color Lower Channel |
| v_input_int_4 | 14 | (?ATR Inputs)ATR Period |
| v_input_10 | 0.01 | Risk Per Trade |
| v_input_11 | 2 | ATR Multiplier |
Source Pine Script
/*backtest
start: 2023-10-15 00:00:00
end: 2023-11-14 00:00:00
period: 1h
basePeriod: 15m
exchanges: [{"eid":"Futures_Binance","currency":"BTC_USDT"}]
*/

// This source code is subject to the terms of the Mozilla Public License 2.0 at https://mozilla.org/MPL/2.0/
// © Robrecht99

//@version=5
strategy("Trend Following with Donchian Channels and MACD", overlay=false, margin_long=100, margin_short=100, pyramiding=3)

// MACD //
fast_length = input(title="Fast Length", defval=12)
slow_length = input(title="Slow Length", defval=26)
src = input(title="Source", defval=close)
signal_length = input.int(title="Signal Smoothing",  minval = 1, maxval = 50, defval = 9)
sma_source = input.string(title="Oscillator MA Type",  defval="EMA", options=["SMA", "EMA"])
sma_signal = input.string(title="Signal Line MA Type", defval="EMA", options=["SMA", "EMA"])

col_macd = input(#2962FF, "MACD Line  ", group="Color Settings", inline="MACD")
col_signal = input(#FF6D00, "Signal Line  ", group="Color Settings", inline="Signal")
col_grow_above = input(#26A69A, "Above   Grow", group="Histogram", inline="Above")
col_fall_above = input(#B2DFDB, "Fall", group="Histogram", inline="Above")
col_grow_below = input(#FFCDD2, "Below Grow", group="Histogram", inline="Below")
col_fall_below = input(#FF5252, "Fall", group="Histogram", inline="Below")

fast_ma = sma_source == "SMA" ? ta.sma(src, fast_length) : ta.ema(src, fast_length)
slow_ma = sma_source == "SMA" ? ta.sma(src, slow_length) : ta.ema(src, slow_length)
macd = fast_ma - slow_ma
signal = sma_signal == "SMA" ? ta.sma(macd, signal_length) : ta.ema(macd, signal_length)
hist = macd - signal
plot(hist, title="Histogram", style=plot.style_columns, color=(hist>=0 ? (hist[1] < hist ? col_grow_above : col_fall_above) : (hist[1] < hist ? col_grow_below : col_fall_below)))
plot(macd, title="MACD", color=col_macd)
plot(signal, title="Signal", color=col_signal)

// Donchian Channels //

Length1 = input.int(title="Length Upper Channel", defval=50, minval=1, group="Donchian Channels Inputs")
Length2 = input.int(title="Length Lower Channel", defval=50, minval=1, group="Donchian Channels Inputs")
h1 = ta.highest(high[1], Length1)
l1 = ta.lowest(low[1], Length2)
fillColor = input.color(color.new(color.purple, 95), title = "Fill Color", group = "Donchian Channels Inputs")
upperColor = input.color(color.new(color.orange, 0), title = " Color Upper Channel", group = "Donchian Channels Inputs", inline = "upper")
lowerColor = input.color(color.new(color.orange, 0), title = " Color Lower Channel", group = "Donchian Channels Inputs", inline = "lower")
u = plot(h1, "Upper", color=upperColor)
l = plot(l1, "Lower", color=upperColor)
fill(u, l, color=fillColor)

//ATR and Position Size //
strategy.initial_capital = 50000
length = input.int(title="ATR Period", defval=14, minval=1, group="ATR Inputs")
risk = input(title="Risk Per Trade", defval=0.01, group="ATR Inputs")
multiplier = input(title="ATR Multiplier", defval=2, group="ATR Inputs")
atr = ta.atr(length)
amount = (risk * strategy.initial_capital / (multiplier * atr))

// Buy and Sell Conditions //

entrycondition1 = ta.crossover(macd, signal)
entrycondition2 = macd > signal
entrycondition3 = macd and signal > hist
sellcondition1 = ta.crossover(signal, macd)
sellcondition2 = signal > macd
sellcondition3 = macd and signal < hist

// Buy and Sell Signals //

if (close > h1 and entrycondition2 and entrycondition3)
    strategy.entry("long", strategy.long, qty=amount)
    stoploss = close - atr * 4
    strategy.exit("exit sl", stop=stoploss, trail_offset=stoploss)
if (sellcondition1 and sellcondition2 and sellcondition3)
    strategy.close(id="long")

if (close < l1 and sellcondition2 and sellcondition3)
    strategy.entry("short", strategy.short, qty=amount)
    stoploss = close + atr * 4
    strategy.exit("exit sl", stop=stoploss, trail_offset=stoploss)
if (entrycondition1 and entrycondition2 and entrycondition3)
strategy.close(id="short")Published by ChaoZhang on the FMZ strategy square · last modified 2023-11-15. Collected in the Quant Trading Vault. Unvalidated research: re-test with your own data and costs before trusting it.
Build this with AgenKit
A spec is not a trading system. Paste this into your coding agent and AgenKit runs a specialist team — architecture, test-first build, risk gates, review — with paper trading on by default.
/agenkit build a production-grade trading bot with a backtest engine, risk controls and paper trading by default from strategies/Trend-Following-Strategy-with-MACD-and-Donchian-Channel.md- npx agenkit install engineering-kit in your project
- Paste the command into your agent and approve each phase
- Get tests, backtest, risk controls and a paper-trading switch
Understand it first
Before you run this, read the lesson behind the idea and how to backtest it honestly. Specs like this one are the survivors of an unknown number of trials; deflate their results accordingly.
Related specs
- Trend Tracking Strategy Based on Momentum BreakoutPine Script · Breakout · 1m
- Donchian Channel and Larry Williams Large Trade Index StrategyPine Script · Breakout · 1m
- Dual Breakout Volatility Channel StrategyPine Script · Breakout · 1h
- Kana Candle Breakout Strategy Based on Moving Average and Support ResistancePine Script · Breakout · 1h
- Momentum Breakout Moving Average StrategyPine Script · Breakout · 1d
- Momentum Breakout Trading Strategy 435896Pine Script · Breakout · 1d