Strategy vault / Trend following
Trend Following Strategy
The trend following strategy is a trend trading strategy based on the crossover of moving averages. It uses the crossover of an exponential moving average (EMA) and a Hull moving average (HMA) to determine the trend…
Overview
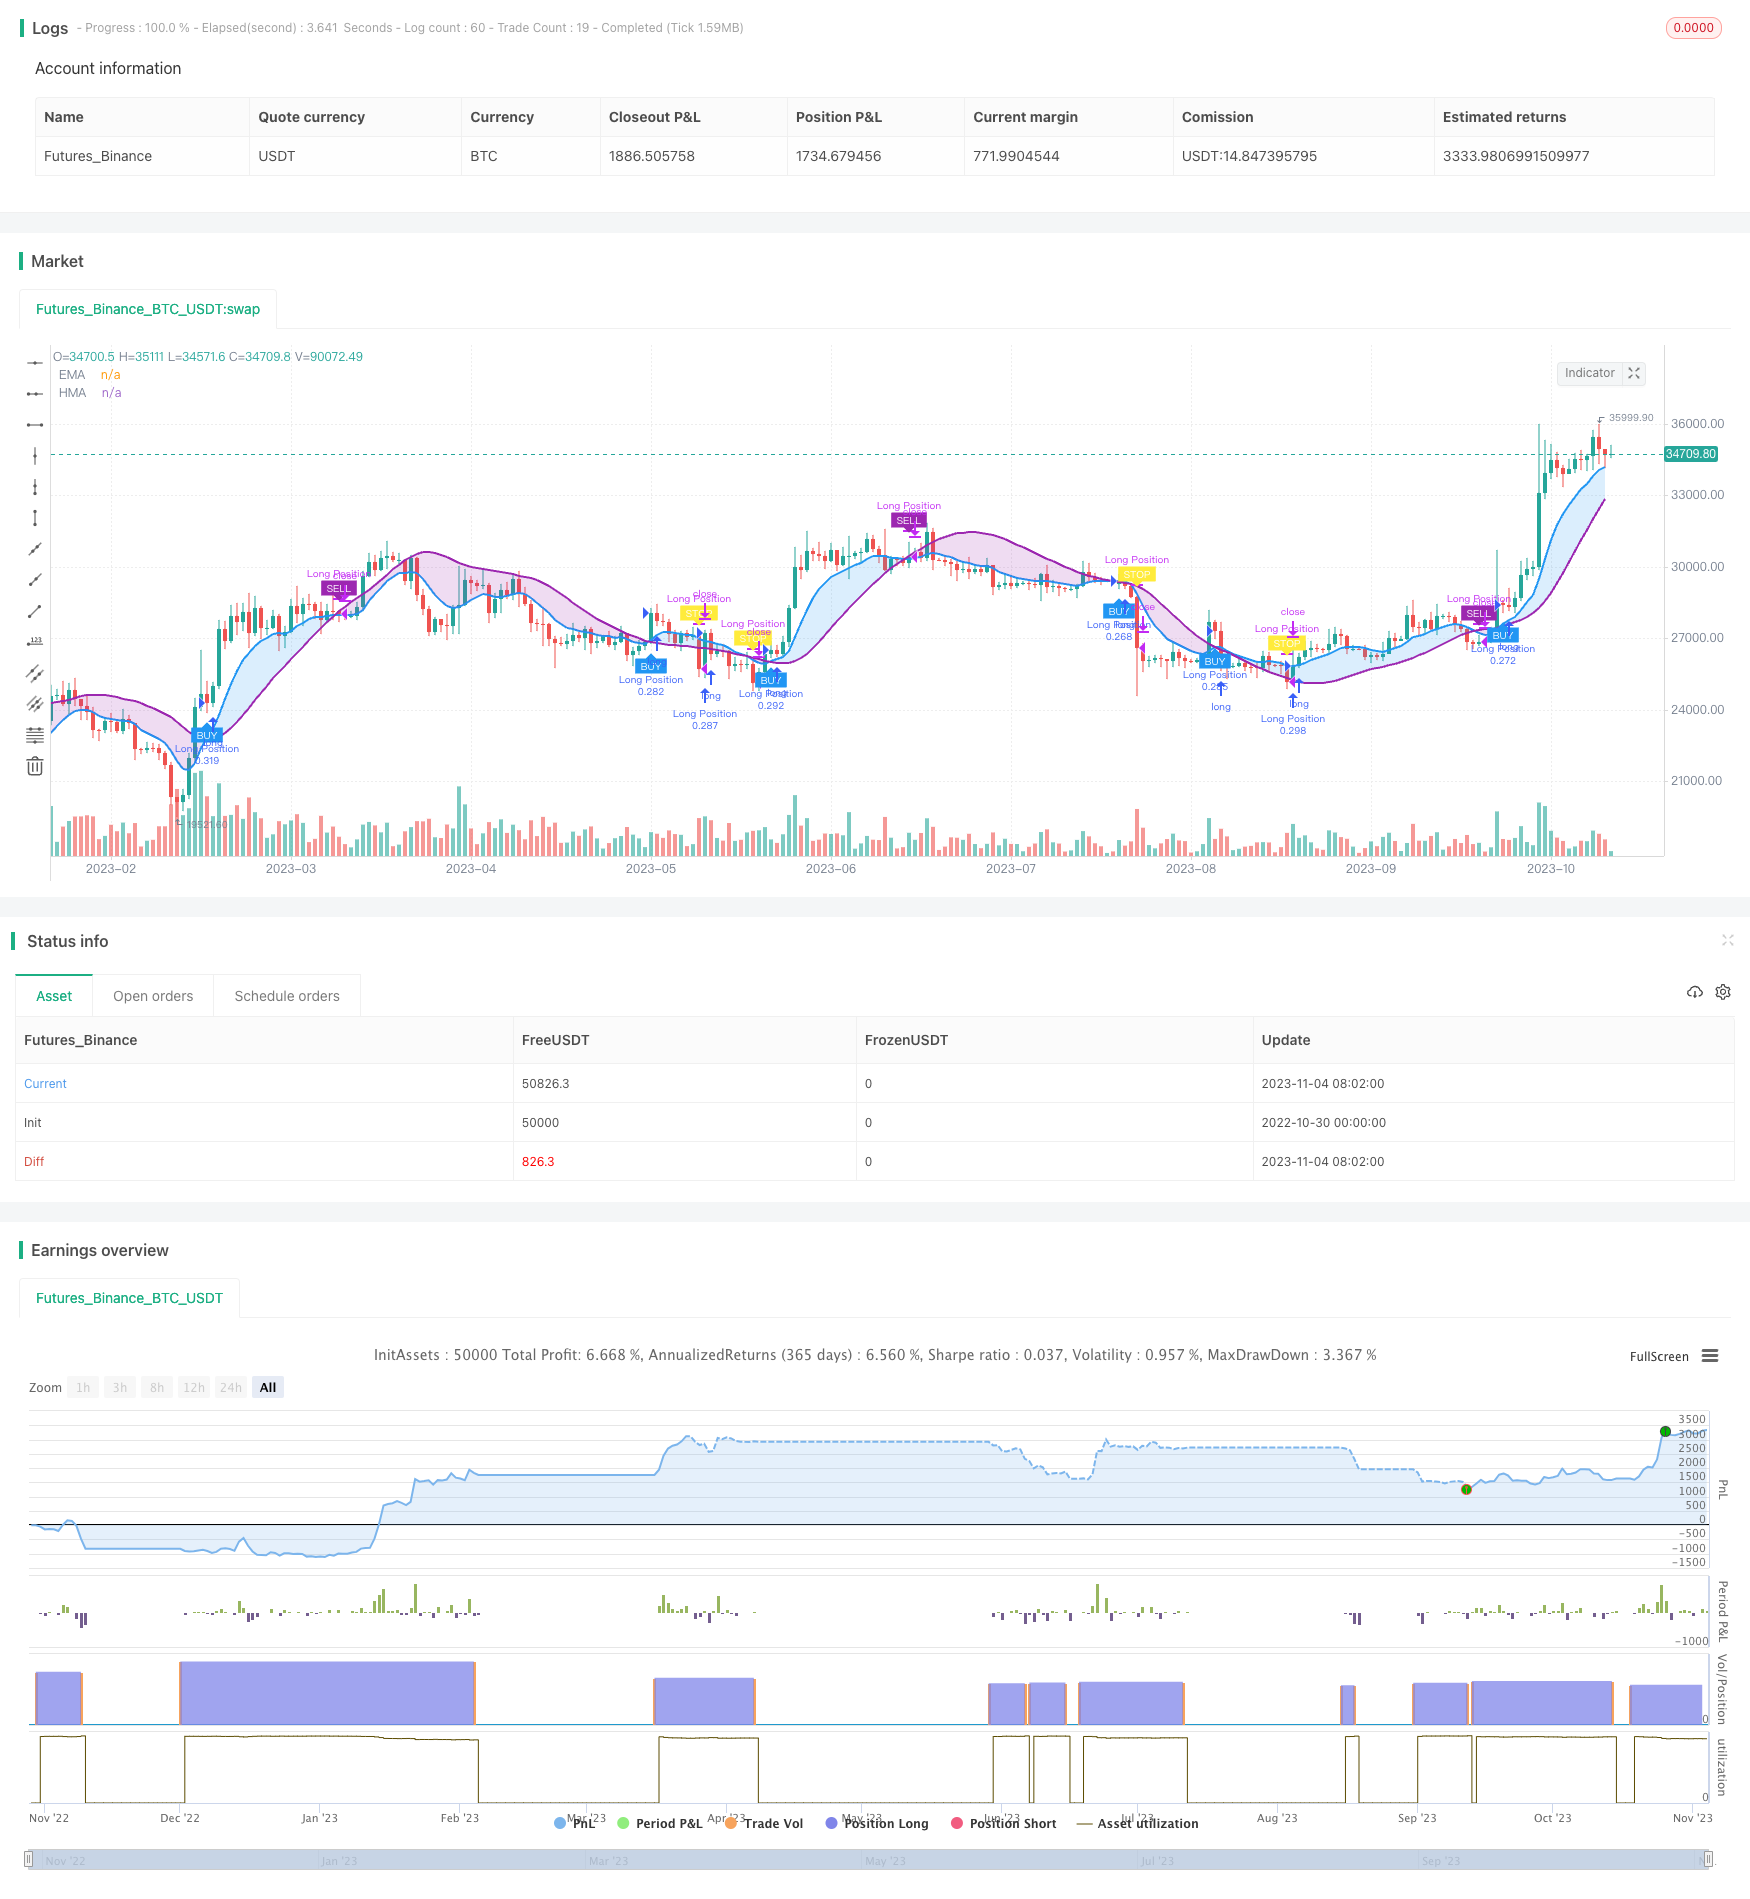
The trend following strategy is a trend trading strategy based on the crossover of moving averages. It uses the crossover of an exponential moving average (EMA) and a Hull moving average (HMA) to determine the trend direction and generate trading signals accordingly. The strategy aims to follow the longer-term price trend rather than short-term oscillations.
Strategy Logic
The strategy employs two moving averages with different parameters: a faster EMA and a slower HMA. The EMA reacts faster to price changes and is used to judge short-term trends, while the HMA responds slower and tracks long-term trend direction.
When the faster EMA crosses above the slower HMA, it is viewed as a start of an upward trend, and the strategy will place a long order at market price on the next bar open. When the EMA crosses below the HMA, it is seen as the beginning of a downward trend, and the strategy will go short at market price on the next bar open.
To optimize entry timing, the strategy incorporates a Heikin-Ashi option. When enabled, the buy and sell signals will be based on Heikin-Ashi bars instead of normal candlesticks. Heikin-Ashi bars can filter out short-term price oscillations on the original candlesticks and reduce false signals.
The strategy also employs a stop loss setting. When the position loss reaches the preset stop loss percentage, the position will be closed out at market price, capping the maximum loss per trade.
Advantage Analysis
The advantages of this strategy include:
Using EMA and HMA crossover to determine trends can take advantage of different period moving averages and improve accuracy.
Trading based on trends avoids churning on minor oscillations and reduces unnecessary trades.
The Heikin-Ashi option optimizes entry timing by filtering out false signals.
The moving stop loss effectively limits maximum loss per trade.
Customizable parameters allow optimization for different products and timeframes.
Risk Analysis
The risks of this strategy include:
As a trend following system, it underperforms during range-bound markets.
It may incur large losses when a trend reversal comes.
Improper stop loss settings may cause unnecessary stops or magnify losses.
Bad parameter tuning can lead to overtrading or inaction.
EMA and HMA periods need optimization for different products and timeframes.
Heikin-Ashi cannot completely avoid the risk of false breakouts.
Optimization Directions
The strategy can be improved from the following aspects:
Utilize more indicators like MACD, KDJ to enhance trend accuracy.
Add more filters such as volume, ATR to reduce false breaks.
Optimize parameters of moving averages based on products and timeframes.
Fine tune the stop loss percentage for better stop loss behavior.
Consider profit taking features like moving profit stop and partial profit taking.
Test alternative ways to calculate position cost basis for optimization.
Summary
The trend following strategy identifies trends using moving average crossovers, and optimizes performance via Heikin-Ashi and moving stop loss. It is suitable for medium-to-long term trend trading, and can be further enhanced through parameter tuning and feature expansion. But users should be aware of the risks of reversals and improper stop loss. Overall it provides a universal and customizable framework for trend trading that works across different products and timeframes. Proper parameter testing is needed when applying it.
Parameters
| Name | Default | What it controls |
|---|---|---|
| v_input_1 | true | Heikin Ashi Source |
| v_input_2 | true | Stop Loss |
| v_input_int_1 | 9 | EMA Length |
| v_input_int_2 | 69 | HMA Length |
| v_input_float_1 | -6.5 | Stop Loss (%) |
Source Pine Script
/*backtest
start: 2022-10-30 00:00:00
end: 2023-11-05 00:00:00
period: 1d
basePeriod: 1h
exchanges: [{"eid":"Futures_Binance","currency":"BTC_USDT"}]
*/

//@version=5
strategy("????? ?????", overlay=true, initial_capital=1000, default_qty_type=strategy.percent_of_equity, default_qty_value=15)

//Heikin Ashi Option
ha = input(true, title = "Heikin Ashi Source")
src = ha ? request.security(ticker.heikinashi(syminfo.tickerid), timeframe.period, close, barmerge.gaps_off, barmerge.lookahead_off) : close
usestoploss = input(true, title="Stop Loss")

//EMA
len1 = input.int(9, minval=1, title="EMA Length")
ema = ta.ema(src, len1)
emaline = plot(ema, title="EMA", color=color.blue, linewidth=2)

//HMA
len2 = input.int(69, minval=1, title="HMA Length")
hma = ta.wma(2*ta.wma(src, len2/2)-ta.wma(src, len2), math.floor(math.sqrt(len2)))
hmaline = plot(hma, title="HMA", color=color.purple, linewidth=2)
fillcolor = hma < ema ? color.blue : color.purple
fill(emaline, hmaline, title="EMA Fill", color=color.new(fillcolor, 80), editable=true)

//Stop Loss Conditions
stoplosspercent = input.float(title="Stop Loss (%)", defval=-6.5, minval=-50, maxval=0, step=.1) / 100
stoploss = strategy.position_avg_price * (1 + stoplosspercent)
stop = stoploss > close and stoploss[1] < close[1] and strategy.position_size > 0 and usestoploss

//Buy Sell Conditions
buy = hma < ema
sell = hma > ema

//Trades and Alerts
if buy
	strategy.entry("Long Position", strategy.long, comment="BUY")
//	alert("{\n\"message_type\": \"bot\",\n\"bot_id\": 6477543,\n\"email_token\": \"9b842a1b-9cb4-48ac-9ed4-524c98557e5f\",\n\"delay_seconds\": 0\n}", alert.freq_once_per_bar)
if sell and strategy.openprofit > 0
	strategy.close("Long Position", comment="SELL")
//	alert("{\n\"action\": \"close_at_market_price\",\n\"message_type\": \"bot\",\n\"bot_id\": 6477543,\n\"email_token\": \"9b842a1b-9cb4-48ac-9ed4-524c98557e5f\",\n\"delay_seconds\": 0\n}", alert.freq_once_per_bar)
if stop
    strategy.close("Long Position", comment="STOP")
//    alert("{\n\"action\": \"close_at_market_price\",\n\"message_type\": \"bot\",\n\"bot_id\": 6477543,\n\"email_token\": \"9b842a1b-9cb4-48ac-9ed4-524c98557e5f\",\n\"delay_seconds\": 0\n}", alert.freq_once_per_bar)

//Alternate Labels
var pos = 0
if buy and pos <= 0
    pos := 1
if sell and pos >= 0
    pos := -1
buylabel  = pos ==  1 and (pos !=  1)[1]
selllabel = pos == -1 and (pos != -1)[1]

//Plot Labels
plotshape(buylabel,  style=shape.labelup,   location=location.belowbar, color=color.blue,   text="BUY",  textcolor=color.white, size=size.tiny)
plotshape(selllabel, style=shape.labeldown, location=location.abovebar, color=color.purple, text="SELL", textcolor=color.white, size=size.tiny)
plotshape(stop,      style=shape.labeldown, location=location.abovebar, color=color.yellow, text="STOP", textcolor=color.white, size=size.tiny)
Published by ChaoZhang on the FMZ strategy square · last modified 2023-11-06. Collected in the Quant Trading Vault. Unvalidated research: re-test with your own data and costs before trusting it.
Build this with AgenKit
A spec is not a trading system. Paste this into your coding agent and AgenKit runs a specialist team — architecture, test-first build, risk gates, review — with paper trading on by default.
/agenkit build a production-grade trading bot with a backtest engine, risk controls and paper trading by default from strategies/Trend-Following-Strategy.md- npx agenkit install engineering-kit in your project
- Paste the command into your agent and approve each phase
- Get tests, backtest, risk controls and a paper-trading switch
Understand it first
Before you run this, read the lesson behind the idea and how to backtest it honestly. Specs like this one are the survivors of an unknown number of trials; deflate their results accordingly.
Related specs
- Full Crypto Swing ALMA Cross MACD Quantitative StrategyPine Script · Trend following · 1h
- Incremental Order Size Fibonacci Retracement Trend Following StrategyPine Script · Trend following · 1d
- Cryptocurrency Trend Following Strategy Based on Heiken AshiPine Script · Trend following · 1d
- Multi Technical Indicator Gold Real Time Movement Detection and Risk Management StrategyPine Script · Trend following · 1d
- V3Heiken Ashi Moving Average Crossover Strategy with MACD Filter V3Pine Script · Trend following · 1h
- WaveTrend and DER Based Swing Trading StrategyPine Script · Trend following · 1d