Trend Momentum Strategy Multi Period Dynamic ZigZag Wave Timing System
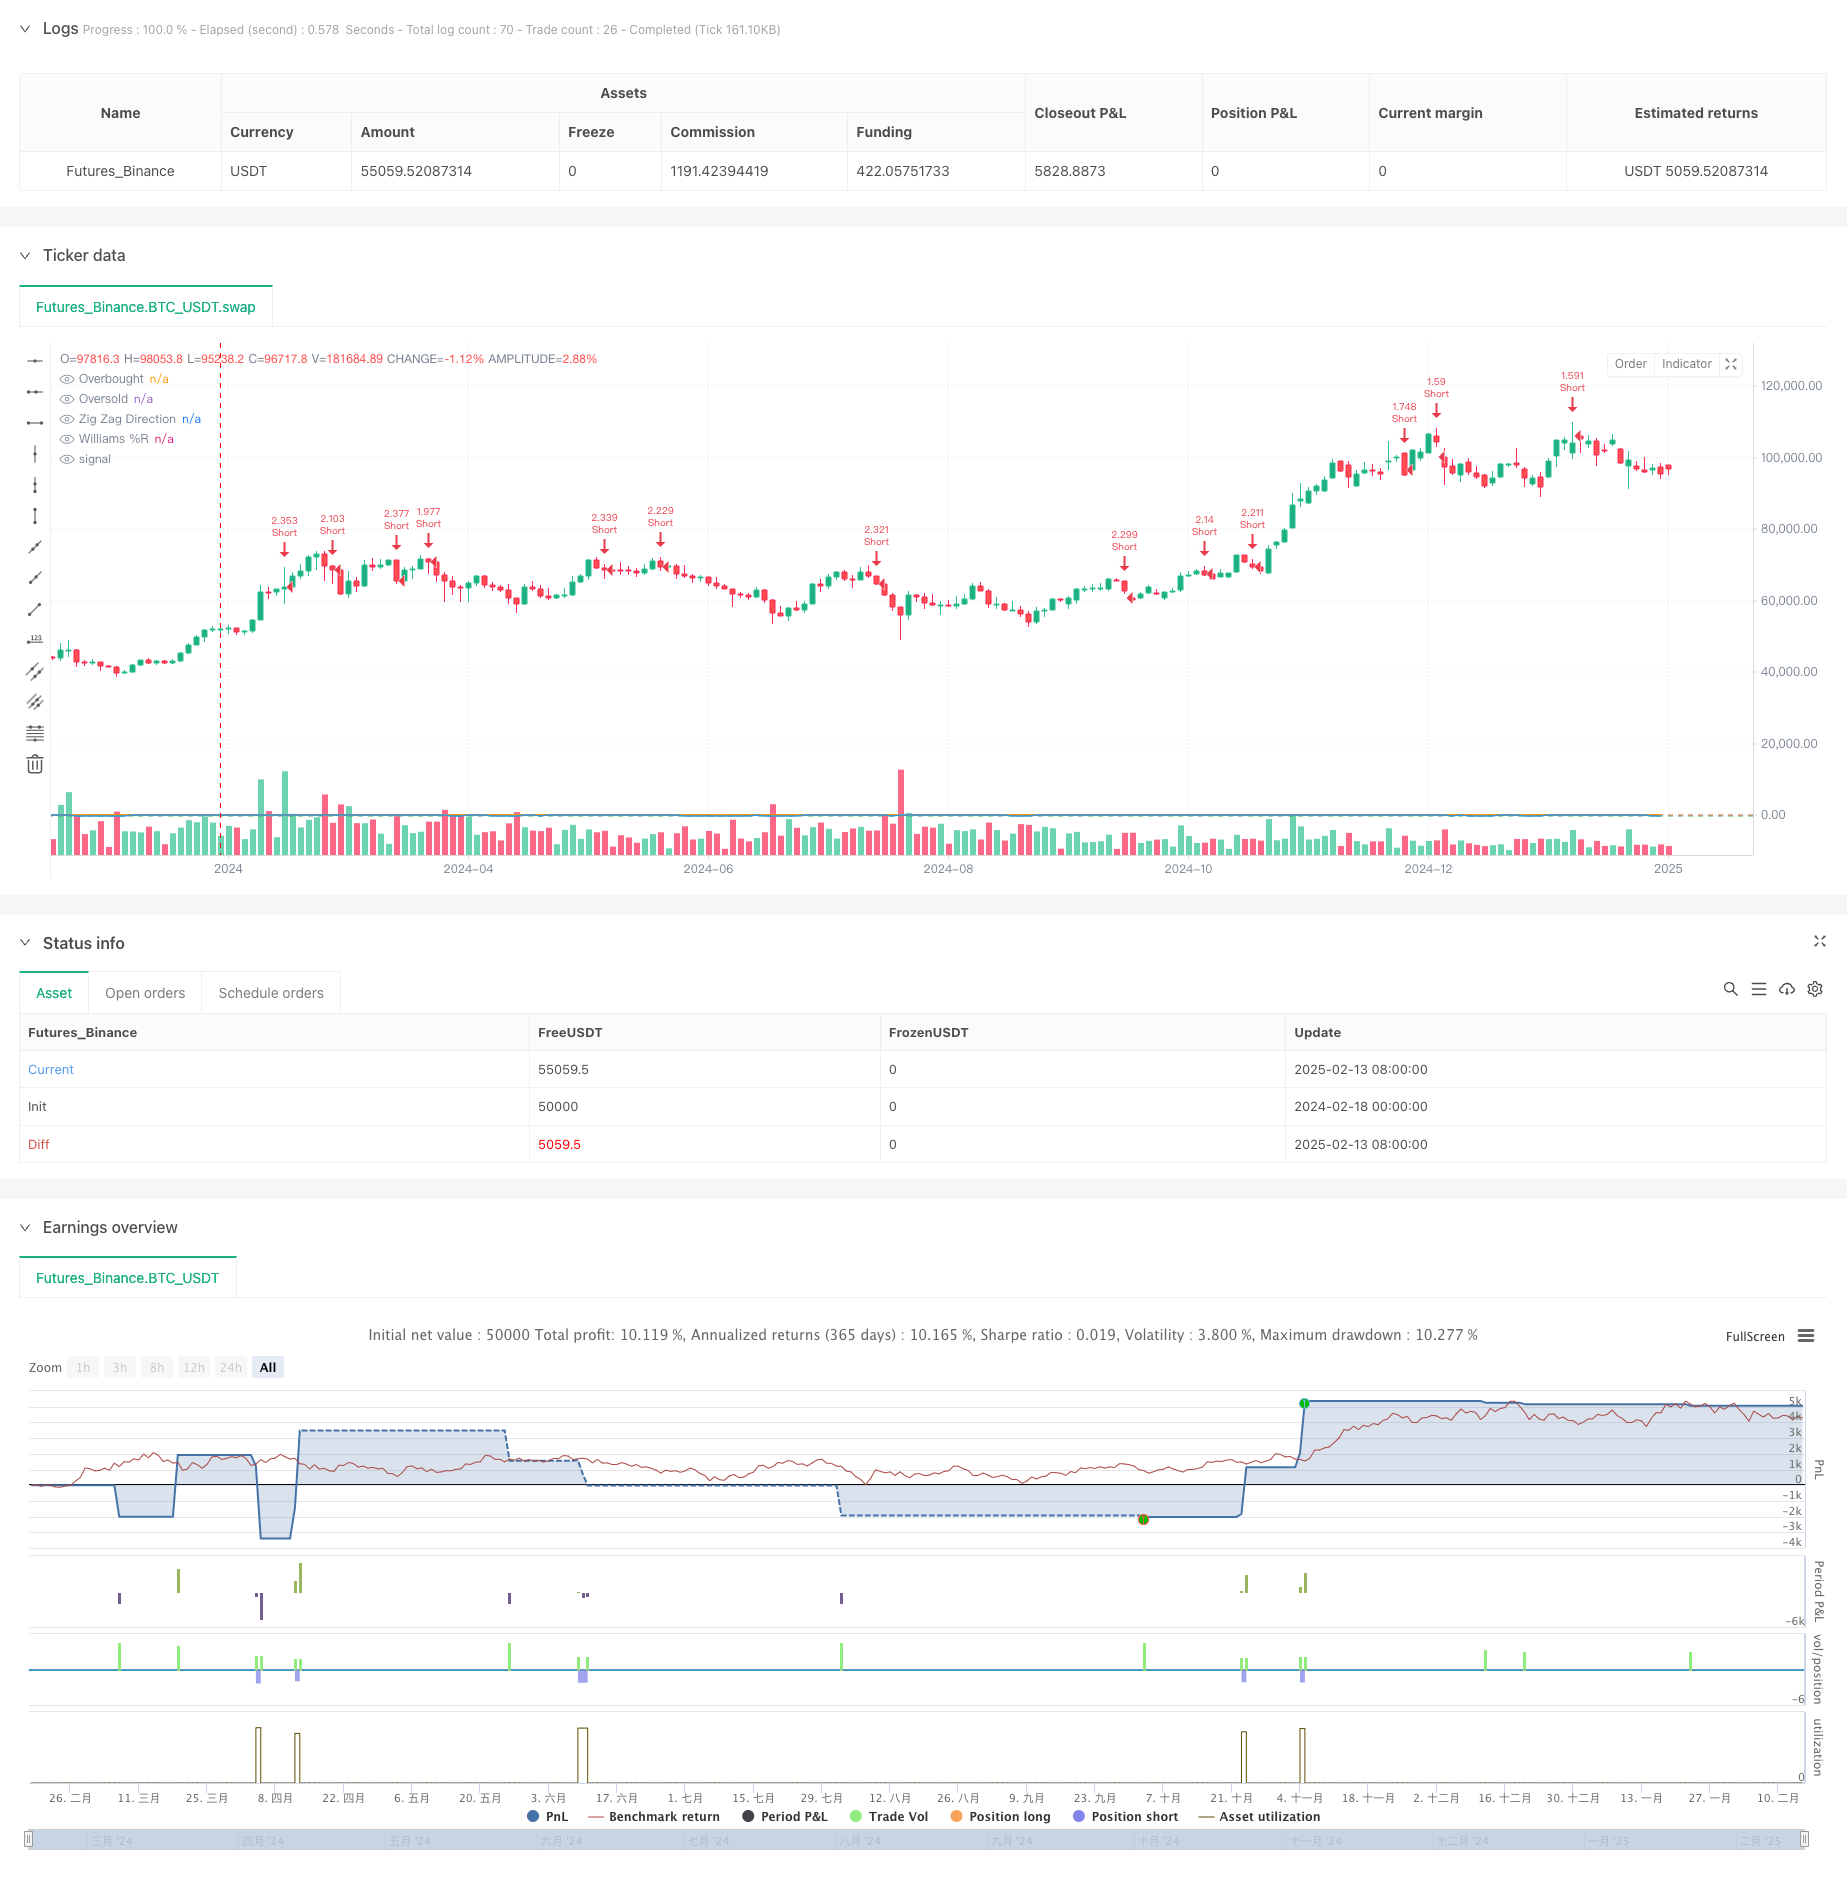
This strategy is a multi-dimensional trading system that combines the ZigZag indicator with the Williams %R indicator. It identifies significant swing highs and lows using the ZigZag indicator while confirming entry…
Overview
This strategy is a multi-dimensional trading system that combines the ZigZag indicator with the Williams %R indicator. It identifies significant swing highs and lows using the ZigZag indicator while confirming entry points with the Williams %R when the market reaches overbought or oversold conditions. This combination captures major market trend reversals while using momentum confirmation to improve trading accuracy.
Strategy Principles
The core logic is based on two main components:
- The ZigZag indicator identifies significant swing points using depth and deviation parameters to filter market noise and determine trend direction. A new swing low indicates the start of an uptrend, while a new swing high indicates the start of a downtrend.
- The Williams %R indicator calculates market momentum by comparing current price to the highest price within a specific period. Values crossing above -80 indicate oversold conditions (potential buy), while crossing below -20 indicate overbought conditions (potential sell).
Trading rules are as follows:
- Long Entry: ZigZag identifies a new swing low and Williams %R crosses up from oversold zone
- Short Entry: ZigZag identifies a new swing high and Williams %R crosses down from overbought zone
- Stop Loss is set at 1% and Take Profit at 2%
Strategy Advantages
- Multi-dimensional confirmation: Improved signal reliability through trend and momentum verification
- Strong adaptability: ZigZag deviation parameters can be dynamically adjusted based on market volatility
- Comprehensive risk control: Fixed percentage stop-loss and take-profit strategy controls risk per trade
- Excellent visualization: Clear display of trading signals through labels and graphics for analysis and optimization
Strategy Risks
- Choppy market risk: May generate frequent false breakout signals in sideways markets
- Slippage risk: Potentially significant slippage in fast-moving markets
- Parameter sensitivity: Strategy performance heavily depends on indicator parameter selection
- Signal lag: May miss some quick moves due to the need for new swing point confirmation
Optimization Directions
- Add market environment filtering: Incorporate volatility indicators to identify market conditions and use different parameters accordingly
- Dynamic stop-loss optimization: Adjust stop-loss positions based on ATR or volatility
- Volume confirmation integration: Add volume verification when generating signals
- Time filtering: Add trading time period filters to avoid highly volatile sessions
Summary
This is a complete trading system combining trend following and momentum trading. Through the synergy of multiple technical indicators, it maintains a high win rate while effectively controlling risk. Although there is some lag, stable trading results can be achieved through proper parameter optimization and risk management. The strategy is particularly suitable for medium to long-term trend markets and performs better when there are clear directional opportunities.
Source Pine Script
/*backtest
start: 2024-02-18 00:00:00
end: 2025-02-15 08:00:00
period: 2d
basePeriod: 2d
exchanges: [{"eid":"Futures_Binance","currency":"BTC_USDT"}]
*/

//@version=6
strategy("Zig Zag + Williams %R Strategy", overlay=true, default_qty_type=strategy.percent_of_equity, default_qty_value=300)

// ====================
// === Parameters
// ====================

// Zig Zag parameters
zigzag_depth = input.int(5, title="Zig Zag Depth", minval=1)
zigzag_deviation = input.float(1.0, title="Zig Zag Deviation (%)", minval=0.1, step=0.1)

// Williams %R parameters
williams_length = input.int(14, title="Williams %R Length", minval=1)
williams_overbought = input.int(-20, title="Williams %R Overbought", minval=-100, maxval=0)
williams_oversold = input.int(-80, title="Williams %R Oversold", minval=-100, maxval=0)

// ====================
// === Zig Zag Calculation
// ====================

// Initialize variables
var float last_pivot_high = na
var float last_pivot_low = na
var int zz_dir = 0  // 1 for uptrend, -1 for downtrend

// Calculate pivots
pivot_high = ta.pivothigh(high, zigzag_depth, zigzag_depth)
pivot_low = ta.pivotlow(low, zigzag_depth, zigzag_depth)

// Update Zig Zag direction and last pivots with deviation
if (not na(pivot_high))
    if (zz_dir != -1)  // Only change to downtrend if not already in downtrend
        if (na(last_pivot_high) or (high[zigzag_depth] > last_pivot_high * (1 + zigzag_deviation / 100)))
            last_pivot_high := high[zigzag_depth]
            zz_dir := -1
            label.new(bar_index[zigzag_depth], high[zigzag_depth], text="PH", color=color.red, style=label.style_label_down)

if (not na(pivot_low))
    if (zz_dir != 1)  // Only change to uptrend if not already in uptrend
        if (na(last_pivot_low) or (low[zigzag_depth] < last_pivot_low * (1 - zigzag_deviation / 100)))
            last_pivot_low := low[zigzag_depth]
            zz_dir := 1
            label.new(bar_index[zigzag_depth], low[zigzag_depth], text="PL", color=color.green, style=label.style_label_up)

// ====================
// === Williams %R Calculation
// ====================

// Calculate Williams %R manually
highest_high = ta.highest(high, williams_length)
lowest_low = ta.lowest(low, williams_length)
williams_r = (highest_high - close) / (highest_high - lowest_low) * -100

// ====================
// === Trade Conditions
// ====================

// Assign crossover and crossunder results to variables
crossover_williams = ta.crossover(williams_r, williams_oversold)
crossunder_williams = ta.crossunder(williams_r, williams_overbought)

// Define trade conditions
longCondition = (zz_dir == 1) and crossover_williams
shortCondition = (zz_dir == -1) and crossunder_williams

// ====================
// === Trading
// ====================

// Enter Long
if (longCondition)
    strategy.entry("Long", strategy.long)
    label.new(bar_index, low, text="BUY", color=color.green, style=label.style_label_up)

// Enter Short
if (shortCondition)
    strategy.entry("Short", strategy.short)
    label.new(bar_index, high, text="SELL", color=color.red, style=label.style_label_down)

// ====================
// === Visualization
// ====================

// Plot Zig Zag pivot shapes
plotshape(series=(not na(pivot_high) and high[zigzag_depth] == last_pivot_high), title="Swing High", location=location.abovebar, color=color.red, style=shape.triangledown, size=size.small, text="ZZ High")
plotshape(series=(not na(pivot_low) and low[zigzag_depth] == last_pivot_low), title="Swing Low", location=location.belowbar, color=color.green, style=shape.triangleup, size=size.small, text="ZZ Low")

// Plot Williams %R
hline(williams_overbought, "Overbought", color=color.red, linestyle=hline.style_dashed)
hline(williams_oversold, "Oversold", color=color.green, linestyle=hline.style_dashed)
plot(williams_r, title="Williams %R", color=color.blue)

// Debug plot for Zig Zag direction
plot(zz_dir, title="Zig Zag Direction", color=color.orange, linewidth=2)

// ====================
// === Risk Management
// ====================

// Risk parameters
stop_loss_perc = input.float(1.0, title="Stop Loss (%)") / 100
take_profit_perc = input.float(2.0, title="Take Profit (%)") / 100

// Stop Loss and Take Profit for Long
if (longCondition)
    strategy.exit("Long Exit", from_entry="Long", stop=close * (1 - stop_loss_perc), limit=close * (1 + take_profit_perc))

// Stop Loss and Take Profit for Short
if (shortCondition)
    strategy.exit("Short Exit", from_entry="Short", stop=close * (1 + stop_loss_perc), limit=close * (1 - take_profit_perc))
Published by ChaoZhang on the FMZ strategy square · last modified 2025-02-18. Collected in the Quant Trading Vault. Unvalidated research: re-test with your own data and costs before trusting it.
Build this with AgenKit
A spec is not a trading system. Paste this into your coding agent and AgenKit runs a specialist team — architecture, test-first build, risk gates, review — with paper trading on by default.
/agenkit build a production-grade trading bot with a backtest engine, risk controls and paper trading by default from strategies/Trend-Momentum-Strategy-Multi-Period-Dynamic-ZigZag-Wave-Timing-System.md- npx agenkit install engineering-kit in your project
- Paste the command into your agent and approve each phase
- Get tests, backtest, risk controls and a paper-trading switch
Understand it first
Before you run this, read the lesson behind the idea and how to backtest it honestly. Specs like this one are the survivors of an unknown number of trials; deflate their results accordingly.
Related specs
- KST EMA Momentum Trend Following StrategyPine Script · Momentum · 1d
- Triple Moving Average Momentum Trend Trading StrategyPine Script · Momentum · 2d
- Dynamic Trend RSI Crossover Momentum Enhancement StrategyPine Script · Momentum · 1h
- Cross Period Momentum EMA Strategy with RSI and Dynamic ATR Stop LossPine Script · Momentum · 1d
- Multi EMA Trend Momentum Trading Strategy with Risk Management SystemPine Script · Momentum · 1h
- Multi Indicator Trend Momentum Trading Strategy with Dynamic Risk Management SystemPine Script · Momentum · 1h