Strategy vault / Mean reversion
Trend Reversal Strategy Based on Multiple Moving Averages
This strategy generates buy and sell signals based on reversals of multiple trend indicators including TDI, TCF, TTF and TII. The strategy allows selecting which indicator signal to use for entries and exits.
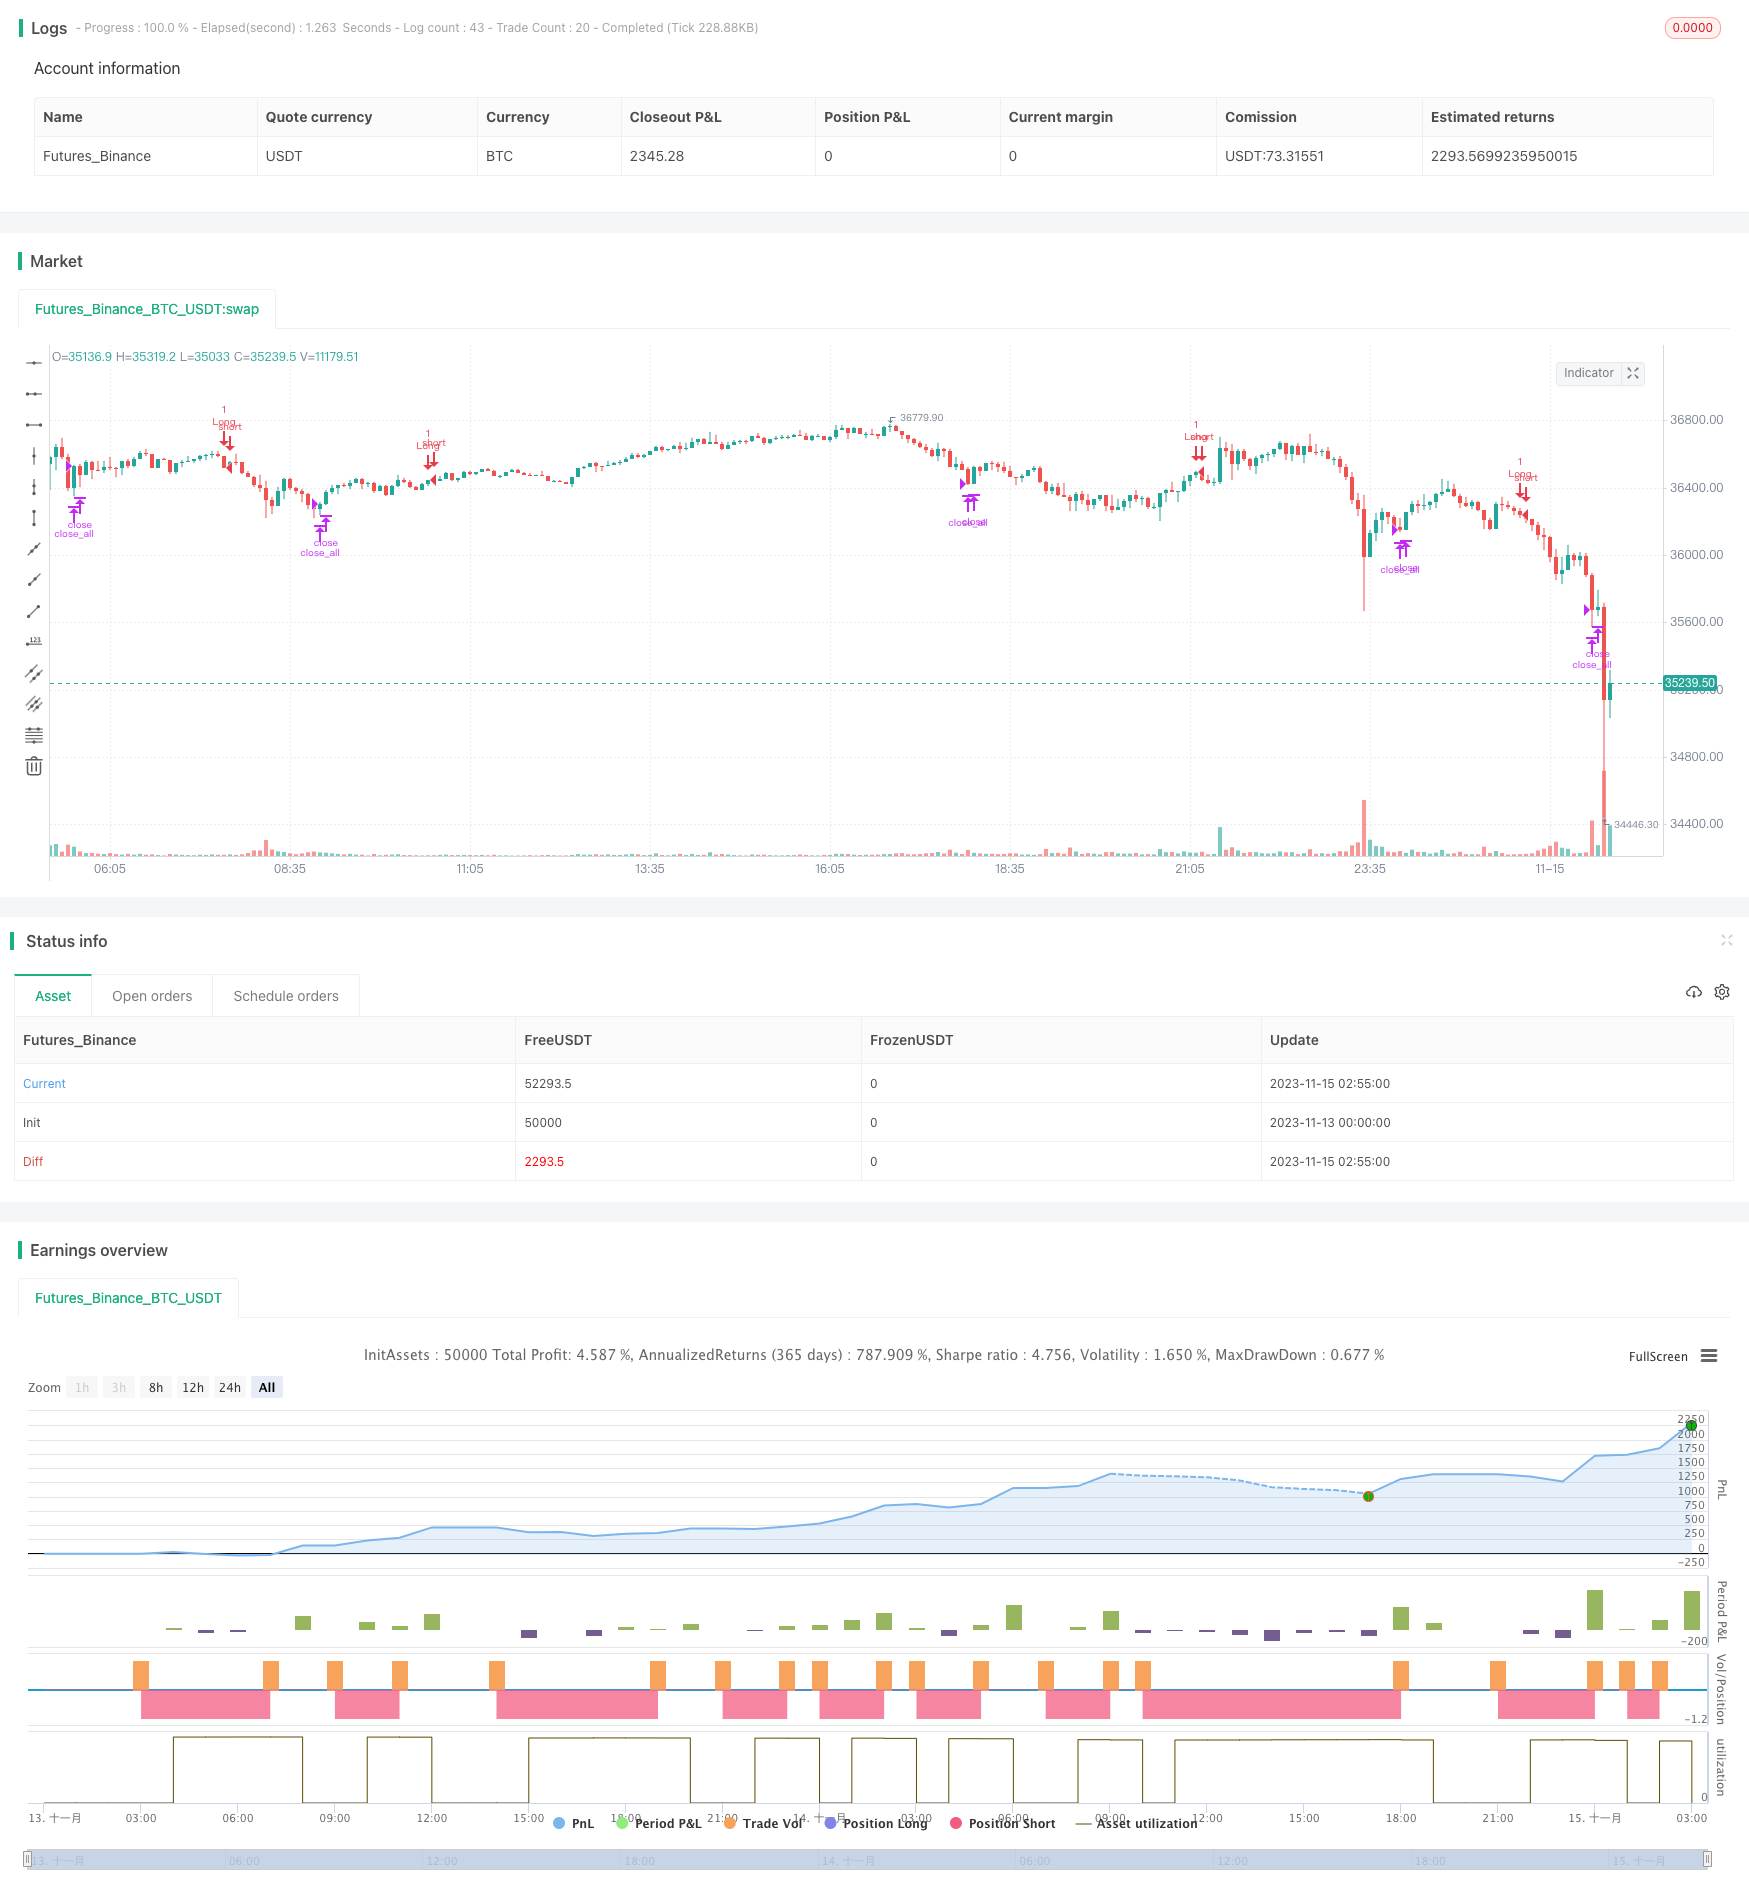
Overview
This strategy generates buy and sell signals based on reversals of multiple trend indicators including TDI, TCF, TTF and TII. The strategy allows selecting which indicator signal to use for entries and exits.
Strategy Logic
TDI Indicator
The TDI indicator is constructed using price momentum with summing and smoothing techniques. It goes long when TDI direction crosses above TDI line and exits when crossing below.
TCF Indicator
TCF indicator measures positive and negative price changes to gauge bullish and bearish forces. It goes long when positive change is greater than negative change, otherwise it exits.
TTF Indicator
TTF indicator compares the power of highest and lowest prices to determine trend. The long signal is when TTF crosses above 100 and exit is when crossing below -100.
TII Indicator
The TII combines moving average and price bands to identify trend reversals. It considers both short and long term trends. The long signal is above 80 and exit is below 80.
The entry long and close logic selects appropriate signals based on configured indicator.
Advantages
The strategy incorporates several commonly used trend trading indicators, which allows flexibility to adapt to changing market conditions. Specific advantages:
- Captures trend reversal opportunities in a timely manner using reversal signals
- Optimizable through configuring different indicators
- Rich indicator combinations can be used to confirm signals
Risks
The main risks this strategy faces:
- Indicator signals may have false signals resulting in losses
- Individual indicators cannot fully judge trends and are susceptible to market noise
- Incorrect configurations of indicators and trading parameters can misinterpret the market and generate erroneous trades
Risks can be reduced by:
- Optimizing indicator parameters to find best combinations
- Requiring multiple indicator signal confirmations to improve quality
- Adjusting position sizing to control single trade loss
Enhancement Opportunities
The strategy can be enhanced in several areas:
- Test optimal indicators and parameters across different market cycles
- Add or reduce indicators to find best combinations
- Filter out false signals
- Optimize position sizing strategies e.g. variable size, trailing stop loss
- Incorporate machine learning scoring to assist with signal quality
Conclusion
By combining multiple trend reversal indicators and optimizing configurations, this strategy is adaptable to varying market environments foroperating at trend turning points. The key is finding the optimum parameters and indicators while controlling risk. Continued optimizations and validations can build a steady alpha strategy.
Parameters
| Name | Default | What it controls |
|---|---|---|
| v_input_1 | 0 | Use Indicator: TDI | TCF | TTF | TII |
| v_input_2 | 20 | Length |
| v_input_3 | 35 | Length |
| v_input_4 | 15 | Lookback Length |
| v_input_5 | 60 | Major Length |
| v_input_6 | 30 | Minor Length |
| v_input_7 | 80 | Upper Level |
| v_input_8 | 20 | Lower Level |
| v_input_9 | 2016 | Back Testing Start Year |
| v_input_10 | true | Back Testing Start Month |
| v_input_11 | true | Back Testing Start Day |
| v_input_12 | 2028 | Back Testing Stop Year |
| v_input_13 | 12 | Back Testing Stop Month |
| v_input_14 | 31 | Back Testing Stop Day |
| v_input_15 | 20 | Max Position % |
| v_input_16 | 5 | Max Loss Risk % |
| v_input_17 | 14 | ATR Length |
| v_input_18 | 1.5 | Stop Offset |
| v_input_19 | true | Limit Offset |
Source Pine Script
/*backtest
start: 2023-11-13 00:00:00
end: 2023-11-15 03:00:00
period: 5m
basePeriod: 1m
exchanges: [{"eid":"Futures_Binance","currency":"BTC_USDT"}]
*/

//@version=4
//
// This source code is subject to the terms of the Mozilla Public License 2.0 at https://mozilla.org/MPL/2.0/
// © kruskakli
//
// Here is a collection of Trend Indicators as defined by M.H Pee and presented
// in various articles of the "STOCKS & COMMODITIES Magazine"
//
// The actual implementation of the indicators here are made by: everget
//
// I have gather them here so that they easily can be tested.
//
// My own test was made using 15 companies from the OMXS30 list
// during the time period of 2016-2018, and I only went LONG.
//
// The result was as follows:
//
//        Average    Std.Dev
//        profit
//  TDI    3.04%      5.97
//  TTF    1.22%.     5.73
//  TII    1.07%      6.2
//  TCF    0.32%      2.68
//
strategy("M.H Pee indicators", overlay=true)


use = input(defval="TDI", title="Use Indicator", type=input.string,
             options=["TDI","TCF","TTF","TII"])

src = close


//
// TDI
//
length = input(title="Length", type=input.integer, defval=20)
mom = change(close, length)
tdi = abs(sum(mom, length)) - sum(abs(mom), length * 2) + sum(abs(mom), length)
// Direction Indicator
tdiDirection = sum(mom, length)
tdiLong = crossover(tdiDirection, tdi)
tdiXLong = crossunder(tdiDirection, tdi)

//
// TCF
//
tcflength = input(title="Length", type=input.integer, defval=35)

plusChange(src) =>
    change_1 = change(src)
    change(src) > 0 ? change_1 : 0.0
minusChange(src) =>
    change_1 = change(src)
    change(src) > 0 ? 0.0 : -change_1

plusCF = 0.0
plusChange__1 = plusChange(src)
plusCF := plusChange(src) == 0 ? 0.0 : plusChange__1 + nz(plusCF[1])

minusCF = 0.0
minusChange__1 = minusChange(src)
minusCF := minusChange(src) == 0 ? 0.0 : minusChange__1 + nz(minusCF[1])

plusTCF = sum(plusChange(src) - minusCF, tcflength)
minusTCF = sum(minusChange(src) - plusCF, tcflength)

tcfLong = plusTCF > 0
tcfXLong = plusTCF < 0

//
// TTF
//
ttflength = input(title="Lookback Length", type=input.integer, defval=15)

hh = highest(length)
ll = lowest(length)

buyPower = hh - nz(ll[length])
sellPower = nz(hh[length]) - ll

ttf = 200 * (buyPower - sellPower) / (buyPower + sellPower)

ttfLong = crossover(ttf, 100)
ttfXLong = crossunder(ttf, -100)

//
// TII
//
majorLength = input(title="Major Length", type=input.integer, defval=60)
minorLength = input(title="Minor Length", type=input.integer, defval=30)
upperLevel = input(title="Upper Level", type=input.integer, defval=80)
lowerLevel = input(title="Lower Level", type=input.integer, defval=20)

sma = sma(src, majorLength)

positiveSum = 0.0
negativeSum = 0.0

for i = 0 to minorLength - 1 by 1
    price = nz(src[i])
    avg = nz(sma[i])
    positiveSum := positiveSum + (price > avg ? price - avg : 0)
    negativeSum := negativeSum + (price > avg ? 0 : avg - price)
    negativeSum

tii = 100 * positiveSum / (positiveSum + negativeSum)

tiiLong = crossover(tii, 80)
tiiXLong = crossunder(tii,80)

//
// LOGIC
//
enterLong = (use == "TDI" and tdiLong) or (use == "TCF" and tcfLong) or (use == "TTF" and ttfLong) or (use == "TII" and tiiLong)
exitLong = (use == "TDI" and tdiXLong) or (use == "TCF" and tcfXLong) or (use == "TTF" and ttfXLong) or (use == "TII" and tiiXLong)


// Time range for Back Testing
btStartYear  = input(title="Back Testing Start Year",  type=input.integer, defval=2016)
btStartMonth = input(title="Back Testing Start Month", type=input.integer, defval=1)
btStartDay   = input(title="Back Testing Start Day",   type=input.integer, defval=1)
startTime = timestamp(btStartYear, btStartMonth, btStartDay, 0, 0)

btStopYear  = input(title="Back Testing Stop Year",  type=input.integer, defval=2028)
btStopMonth = input(title="Back Testing Stop Month", type=input.integer, defval=12)
btStopDay   = input(title="Back Testing Stop Day",   type=input.integer, defval=31)
stopTime  = timestamp(btStopYear, btStopMonth, btStopDay, 0, 0)

window() => time >= startTime and time <= stopTime ? true : false


riskPerc     = input(title="Max Position  %", type=input.float, defval=20, step=0.5)
maxLossPerc  = input(title="Max Loss Risk %", type=input.float, defval=5, step=0.25)

// Average True Range (ATR) measures market volatility.
// We use it for calculating position sizes.
atrLen   = input(title="ATR Length", type=input.integer, defval=14)
stopOffset = input(title="Stop Offset", type=input.float, defval=1.5, step=0.25)
limitOffset = input(title="Limit Offset", type=input.float, defval=1.0, step=0.25)
atrValue = atr(atrLen)


// Calculate position size
maxPos = floor((strategy.equity * (riskPerc/100)) / src)
// The position sizing algorithm is based on two parts:
// a certain percentage of the strategy's equity and
// the ATR in currency value.
riskEquity  = (riskPerc / 100) * strategy.equity
// Translate the ATR into the instrument's currency value.
atrCurrency = (atrValue * syminfo.pointvalue)
posSize0    = min(floor(riskEquity / atrCurrency), maxPos)
posSize     = posSize0 < 1 ? 1 : posSize0

if (window())
    strategy.entry("Long", long=true, qty=posSize0, when=enterLong)
strategy.close_all(when=exitLong)Published by ChaoZhang on the FMZ strategy square · last modified 2023-11-21. Collected in the Quant Trading Vault. Unvalidated research: re-test with your own data and costs before trusting it.
Build this with AgenKit
A spec is not a trading system. Paste this into your coding agent and AgenKit runs a specialist team — architecture, test-first build, risk gates, review — with paper trading on by default.
/agenkit build a production-grade trading bot with a backtest engine, risk controls and paper trading by default from strategies/Trend-Reversal-Strategy-Based-on-Multiple-Moving-Averages.md- npx agenkit install engineering-kit in your project
- Paste the command into your agent and approve each phase
- Get tests, backtest, risk controls and a paper-trading switch
Understand it first
Before you run this, read the lesson behind the idea and how to backtest it honestly. Specs like this one are the survivors of an unknown number of trials; deflate their results accordingly.
Related specs
- Adaptive Trading Strategy Combining Dynamic Trend Reversal and Stochastic IndicatorPine Script · Mean reversion · 1d
- Advanced Momentum EMA Trend Following with RSI Overbought Oversold Trading StrategyPine Script · Mean reversion · 1d
- Advanced Quantitative Trend Following and Cloud Reversal Composite Trading StrategyPine Script · Mean reversion · 1d
- Advanced Strategy with Volume and Price Pullback Multiple Take ProfitPine Script · Mean reversion · 1h
- Bidirectional Moving Average Reversion Trading StrategyPine Script · Mean reversion · 1h
- Bollinger Bands ATR Risk Reward Trading StrategyPine Script · Mean reversion · 1d