Strategy vault / Trend following
Trend Surfing Hedging Strategy Based on TSI and HMACCI Indicators
This strategy combines the bilateral trading signals of the TSI and improved CCI indicators, and adopts a hedging approach to frequently open and close positions, aiming to pursue more stable continuous profits. The…
Overview
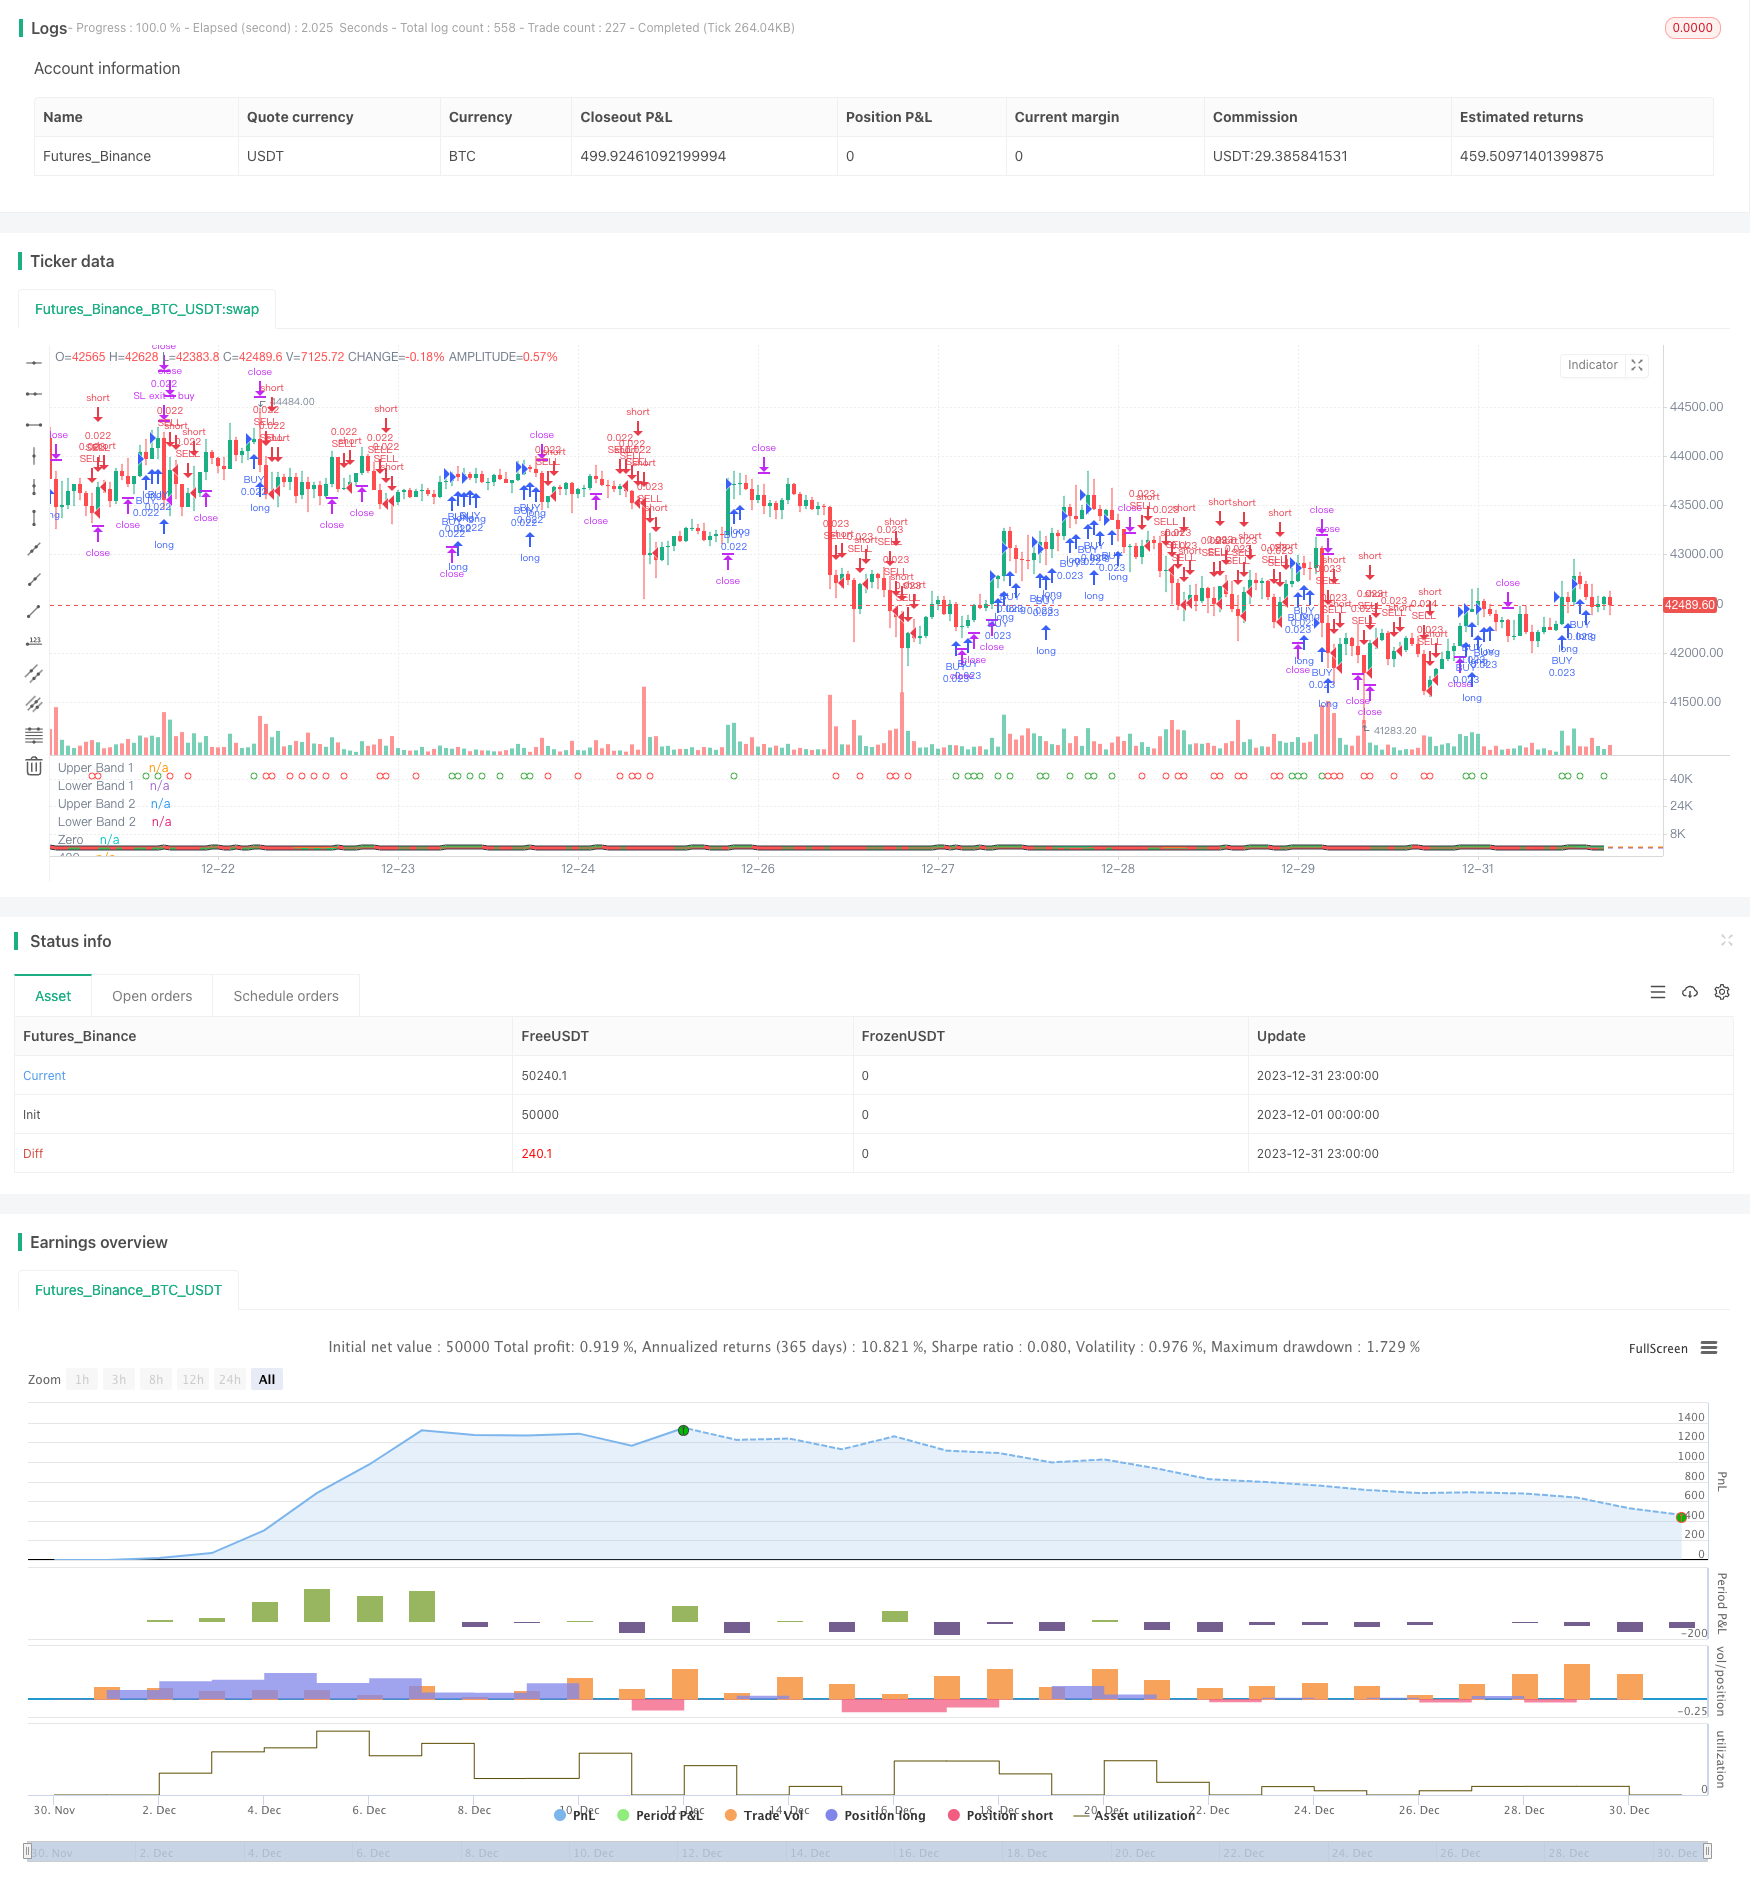
This strategy combines the bilateral trading signals of the TSI and improved CCI indicators, and adopts a hedging approach to frequently open and close positions, aiming to pursue more stable continuous profits. The key logic is the golden cross and dead cross of the fast and slow moving averages of the TSI indicator, combined with the buy and sell signals of the HMACCI indicator to determine market direction. Risks are controlled by limiting opening conditions, while stop loss and take profit logics are set.
Strategy Principle
The strategy is mainly based on the combination of the TSI and HMACCI indicators.
The TSI indicator contains a fast moving average and a slow one to determine trading signals. When the fast line breaks through the slow line upwards, it is a buy signal, and vice versa for sell signals. This can capture changes in market trends more sensitively.
The HMACCI indicator is based on the traditional CCI indicator using Hull Moving Average instead of price itself, which can filter out some noise and judge overbought and oversold zones. The overbought and oversold zones can further confirm the signal direction of the TSI indicator.
The key logic of the strategy is to combine the judgments of these two indicators and set certain additional conditions to filter out false signals, such as examining the previous bar's closing price and maximum and minimum prices over multiple periods to control the quality of reversal signals.
For opening positions, if conditions are met, market orders are placed each time the bar closes, going both long and short. This can obtain more stable returns, but undertakes the risks of a hedging strategy.
For take profit and stop loss, floating stop loss and close all orders when reaching target profit are set. This can effectively control the risks of one-way trades.
Advantages of the Strategy
This is a relatively stable and reliable high frequency hedging strategy. The main advantages are:
- Combination of dual indicators can effectively avoid false signals
- Frequent hedging operations every bar leads to more stable fluctuations in profit and loss
- Strict opening logic and stop loss conditions can control risks
- Combining trend and reversal judgments leads to higher fault tolerance
- No directional bias, suitable for various market conditions
- Large adjustable parameter space, can be optimized for different products
Risk Analysis
The main risks to note are:
- More fee loss caused by high frequency trading
- Impossibility to perfectly avoid being locked in a hedge
- Overly aggressive entry if parameters not set properly
- Difficulty to withstand one-way huge losses in short term
Risks can be reduced through:
- Adjust opening frequency appropriately to lower fee impact
- Optimize indicator parameters to ensure signal quality
- Increase stop loss amplitude but suffer more hedging losses
- Test parameters on different products
Optimization Directions
There is still large room for optimizing this strategy, mainly:
- Optimizing parameters like period, length etc. through testing
- Trying different indicator combinations e.g. MACD, BOLL etc.
- Modifying opening logic, setting stricter filters
- Optimizing take profit and stop loss strategies e.g. dynamic, breakout stops
- Using machine learning methods to find more stable parameter ranges
- Testing on different trading products and timeframes
- Combining trend detection to avoid overly aggressive trades in range-bound markets
Conclusion
Overall this strategy is a stable, reliable hedging strategy with high fault tolerance. It combines trend and reversal indicators, obtaining steady returns through frequent dual-directional trading. Also, the strategy itself has strong potential for optimization, and represents a worthwhile high frequency trading idea to research further.
Parameters
| Name | Default | What it controls |
|---|---|---|
| v_input_1 | 25 | TSI Long Length |
| v_input_2 | 25 | TSI Short Length |
| v_input_3 | 13 | TSI Signal Length |
| v_input_4 | 33 | HMACCI Length |
| v_input_5_open | 0 | Price Source: open | high | low | close | hl2 | hlc3 | hlcc4 | ohlc4 |
| v_input_6 | 50 | Line Distance |
| v_input_7 | 8 | Candles Look Back |
| v_input_8 | 3000 | Stop Loss |
| v_input_9 | 3000 | Target Profit Close All |
| v_input_10 | true | FromMonth |
| v_input_11 | true | FromDay |
| v_input_12 | 2020 | FromYear |
| v_input_13 | true | ToMonth |
| v_input_14 | true | ToDay |
| v_input_15 | 9999 | ToYear |
Source Pine Script
/*backtest
start: 2023-12-01 00:00:00
end: 2023-12-31 23:59:59
period: 1h
basePeriod: 15m
exchanges: [{"eid":"Futures_Binance","currency":"BTC_USDT"}]
*/

// This source code is subject to the terms of the suns bipolarity
//©SeaSide420
//@version=4
strategy(title="TSI HMA CCI", default_qty_type=strategy.cash,default_qty_value=1000,commission_type=strategy.commission.percent,commission_value=0.001)
long = input(title="TSI Long Length", type=input.integer, defval=25)
short = input(title="TSI Short Length", type=input.integer, defval=25)
signal = input(title="TSI Signal Length", type=input.integer, defval=13)
length = input(33, minval=1, title="HMACCI Length")
src = input(open, title="Price Source")
ld = input(50, minval=1, title="Line Distance")
CandlesBack = input(8,minval=1,title="Candles Look Back")
StopLoss= input(3000,minval=1, title="Stop Loss")
TargetProfitAll= input(3000,minval=1, title="Target Profit Close All")
FromMonth=input(defval=1,title="FromMonth",minval=1,maxval=12)
FromDay=input(defval=1,title="FromDay",minval=1,maxval=31)
FromYear=input(defval=2020,title="FromYear",minval=2020)
ToMonth=input(defval=1,title="ToMonth",minval=1,maxval=12)
ToDay=input(defval=1,title="ToDay",minval=1,maxval=31)
ToYear=input(defval=9999,title="ToYear",minval=2017)
start=timestamp(FromYear,FromMonth,FromDay,00,00)
finish=timestamp(ToYear,ToMonth,ToDay,23,59)
window()=>true
ul = (ld)
ll = (ld-ld*2)
ma = hma(src, length)
cci = (src - ma) / (0.015 * dev(src, length))
price = close
double_smooth(src, long, short) =>
	fist_smooth = ema(src, long)
	ema(fist_smooth, short)
pc = change(price)
double_smoothed_pc = double_smooth(pc, long, short)
double_smoothed_abs_pc = double_smooth(abs(pc), long, short)
tsi_value = 100 * (double_smoothed_pc / double_smoothed_abs_pc)*10
tsi_value2=ema(tsi_value/10, signal)*10
cc = color.white
ct = color.new(color.gray, 90)
if cci<ll or cci[1]<ll
    cc:=color.red
if cci>ul or cci[1]>ul
    cc:=color.green
if cci<ul and cci>ll
    cc:=color.new(color.yellow, 90)
ccc = color.white
if cci>ul
    ccc:=color.green
if cci<cci[1] and cci<ul and cci>ll
    ccc:=color.red
if cci<ll
    ccc:=color.red
if cci>cci[1] and cci>ll and cci<ul
    ccc:=color.green
tsiplot= plot(tsi_value, color=color.lime)
tsiplot2=plot(tsi_value2, color=color.red)
colorchange2 =tsi_value>tsi_value2?color.lime:color.orange
fill(tsiplot, tsiplot2, color=colorchange2, title="TSIBackground", transp=50)
band1 = hline(ul, "Upper Band 1", color=ct, linestyle=hline.style_dashed)
band0 = hline(ll, "Lower Band 1", color=ct, linestyle=hline.style_dashed)
fill(band1, band0, color=cc, title="MidBandBackground", transp=0)
band2 = hline(ul, "Upper Band 2", color=ct, linestyle=hline.style_dashed)
band3 = hline(ll, "Lower Band 2", color=ct, linestyle=hline.style_dashed)
cciplot2 = plot(cci, "CCIvHMA 2", color=color.black, transp=0, linewidth=5)
cciplot = plot(cci, "CCIvHMA", color=ccc, transp=0, linewidth=3)
hline(0, title="Zero")
hline(420, title="420")
hline(-420, title="-420")
fill(cciplot, cciplot2, color=ccc, title="CCIBackground", transp=0)
LongCondition=cci>cci[1] and cci>ll and src>src[CandlesBack] and tsi_value>tsi_value2
ShortCondition=cci<cci[1] and cci<ul and src<src[CandlesBack] and tsi_value<tsi_value2
plotshape(LongCondition, title="BUY", style=shape.circle, location=location.top, color=color.green)
plotshape(ShortCondition, title="SELL", style=shape.circle, location=location.top, color=color.red)
if  strategy.openprofit>TargetProfitAll
    strategy.close_all(when=window(),comment="close all profit target")
if LongCondition and strategy.openprofit>-1
    strategy.order("BUY", strategy.long,when=window())
if ShortCondition and strategy.openprofit>-1
    strategy.order("SELL", strategy.short,when=window())
strategy.exit("SL exit a sell", "SELL", loss = StopLoss,when=window())
strategy.exit("SL exit a buy", "BUY", loss = StopLoss,when=window()) Published by ChaoZhang on the FMZ strategy square · last modified 2024-01-23. Collected in the Quant Trading Vault. Unvalidated research: re-test with your own data and costs before trusting it.
Build this with AgenKit
A spec is not a trading system. Paste this into your coding agent and AgenKit runs a specialist team — architecture, test-first build, risk gates, review — with paper trading on by default.
/agenkit build a production-grade trading bot with a backtest engine, risk controls and paper trading by default from strategies/Trend-Surfing-Hedging-Strategy-Based-on-TSI-and-HMACCI-Indicators.md- npx agenkit install engineering-kit in your project
- Paste the command into your agent and approve each phase
- Get tests, backtest, risk controls and a paper-trading switch
Understand it first
Before you run this, read the lesson behind the idea and how to backtest it honestly. Specs like this one are the survivors of an unknown number of trials; deflate their results accordingly.
Related specs
- EMA SMA Multi Indicator Comprehensive Trend Following StrategyPine Script · Trend following · 1h
- Supertrend Advance StrategyPine Script · Trend following · 5m
- TSI and CCI Hull Moving Average Trend Tracking StrategyPine Script · Trend following · 1d
- Trend Tracking Strategy Based on Multi factor Model with Adaptive Trailing StoplossPine Script · Trend following · 1d
- SuperTrend Trailing Stop Strategy Based on Heikin AshiPine Script · Trend following · 4h
- CCIRSIKC Trend Filter Bi Directional Trading StrategyPine Script · Trend following · 2h