Strategy vault / Mean reversion
Trend Tracking Reversal Strategy 437549
The trend tracking reversal strategy is a trend trading strategy based on moving averages and price extremes. The strategy uses two moving averages to track price trends and opens reverse positions when the trends…
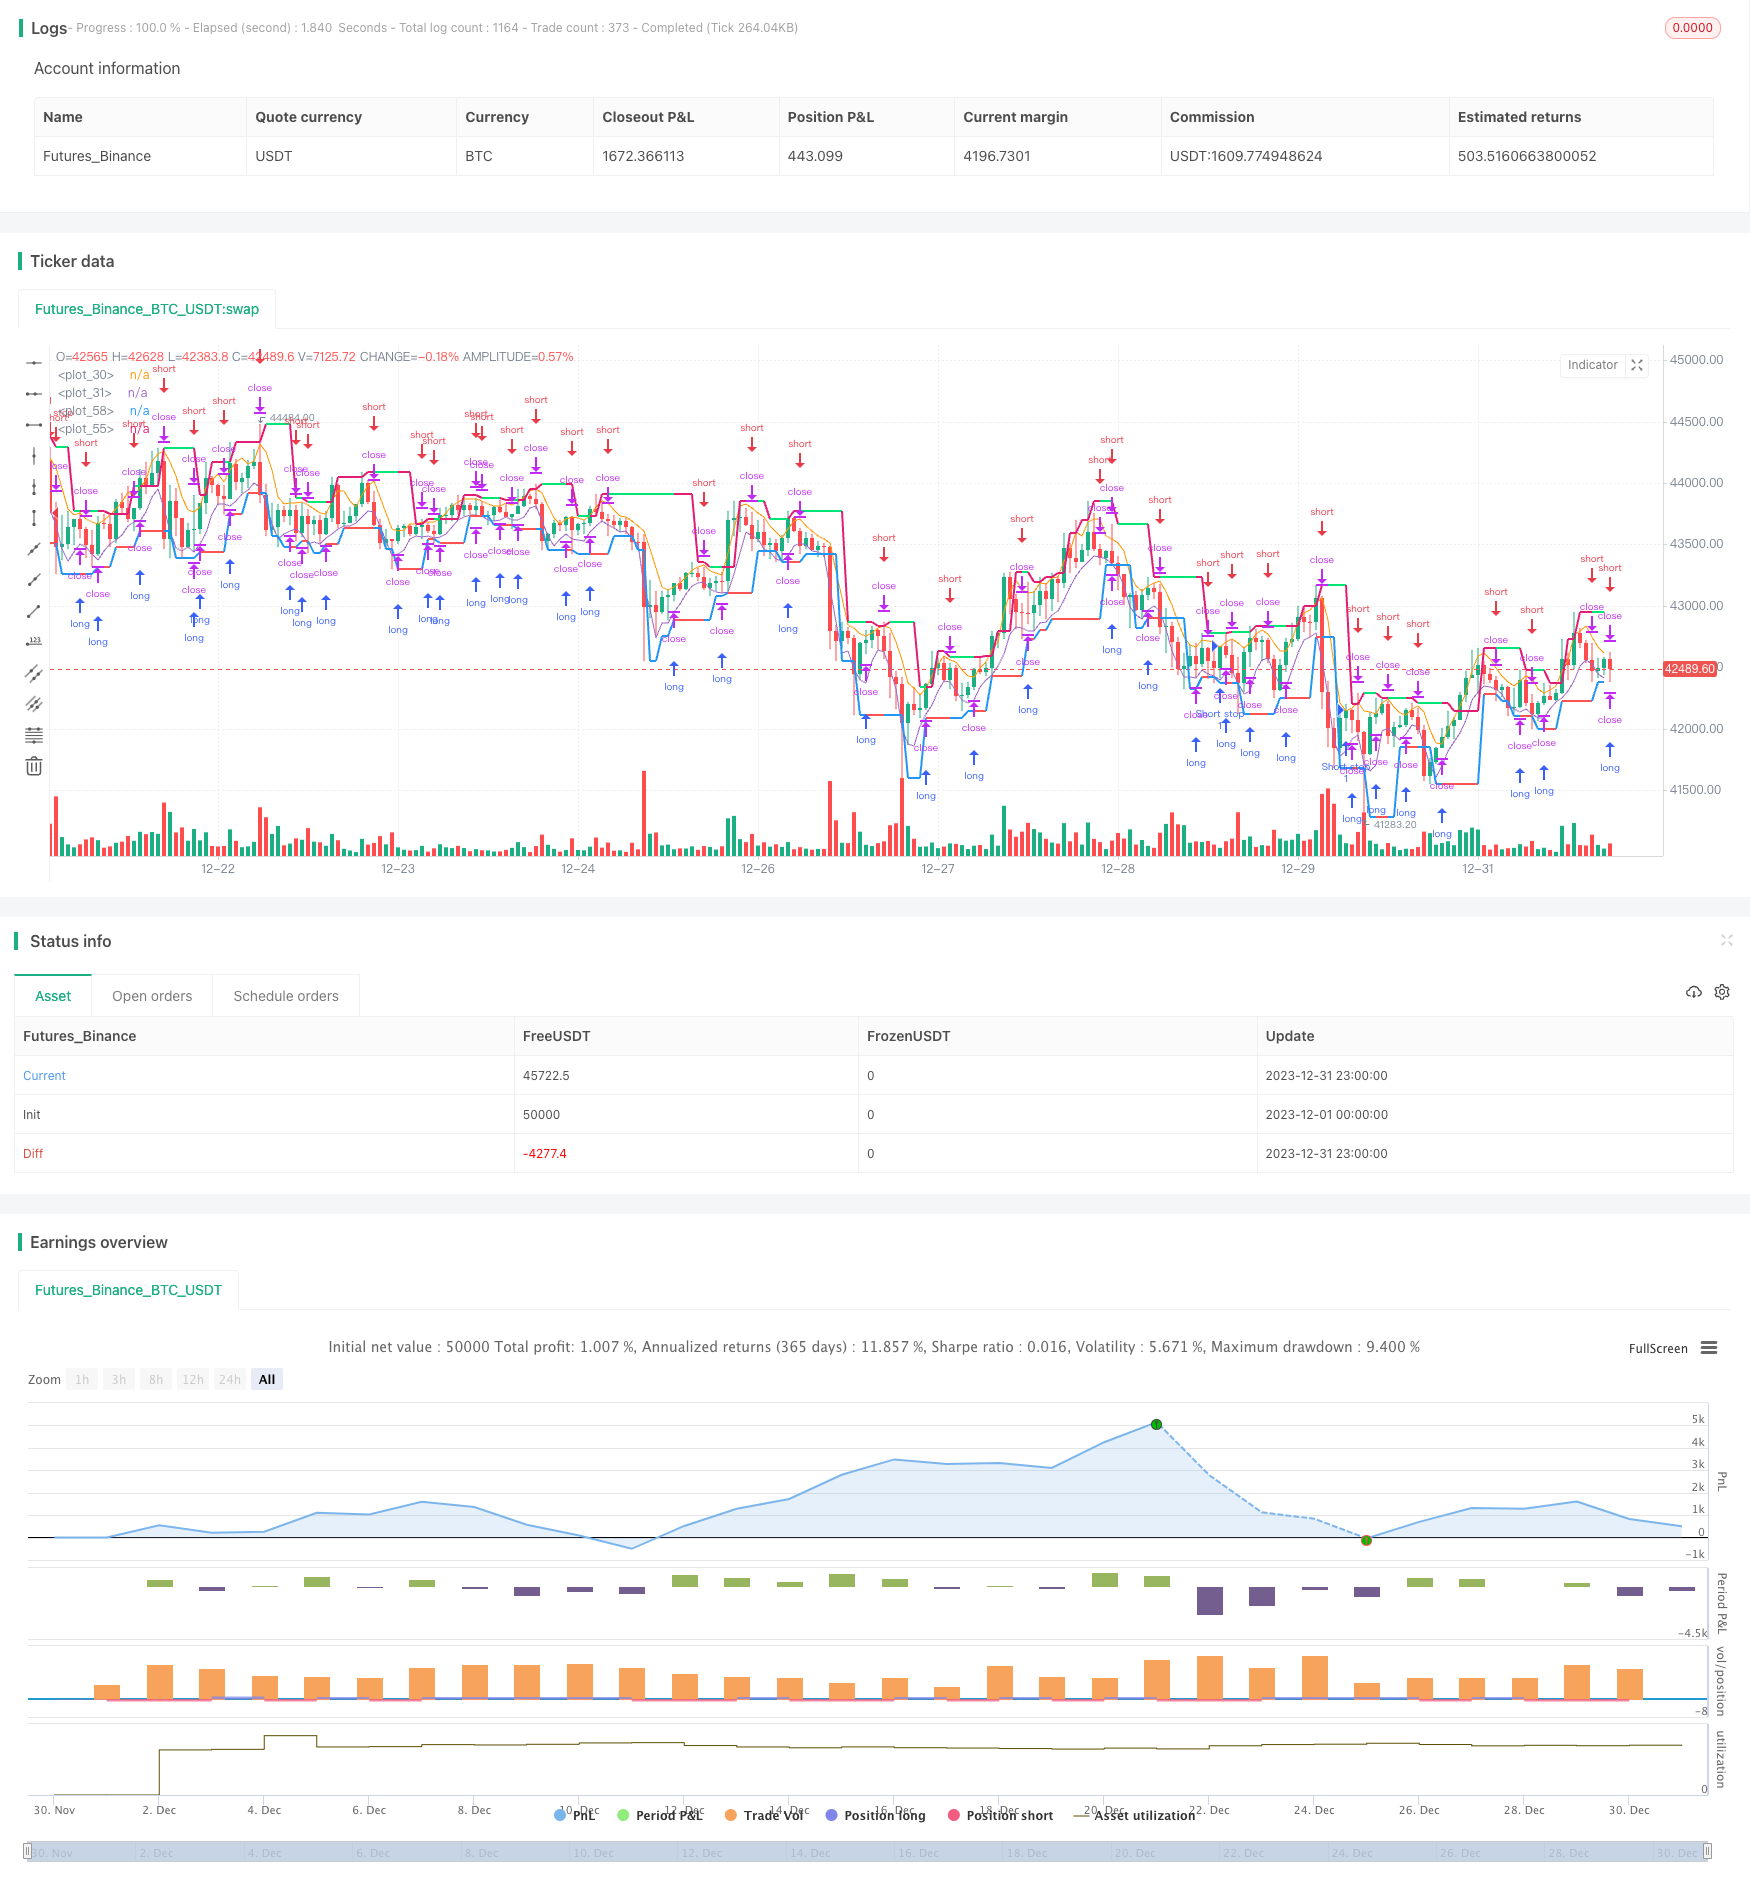
Overview
The trend tracking reversal strategy is a trend trading strategy based on moving averages and price extremes. The strategy uses two moving averages to track price trends and opens reverse positions when the trends reverse. At the same time, it also calculates a price channel based on the highest and lowest prices of recent K-lines to stop loss when prices approach the channel boundaries, further controlling risks.
Strategy Logic
The strategy uses 3-period high and low point moving averages hma and lma to track price trends. When prices cross above hma, it is interpreted as bullish; when prices fall below lma, it is interpreted as bearish.
The strategy also calculates the upper and lower rails (uplevel and dnlevel) of the price channel based on the highest and lowest prices within the recent bars K-lines. uplevel is the highest price in recent bars K-lines plus a retracement coefficient corr upwards; dnlevel is the lowest price in recent bars K-lines minus a retracement coefficient corr downwards. This constitutes the price channel range.
When opening long positions, the stop loss price is set at the upper rail of the channel; when opening short positions, the stop loss price is set at the lower rail of the channel. This effectively controls the risk of losses from price reversals.
When a reverse signal appears, the strategy will immediately reverse open positions to track the new price trend. This is the principle behind tracking reversals.
Advantages
- The strategy takes full advantage of moving averages to track trends and capture price moves quickly.
- It applies price channels and reverse opening positions to control risks and lock in profits effectively.
- The strategy logic is simple and clear, easy to understand and implement.
- Customizable parameters such as trend judgment length, retracement coefficients, etc. adapt to different products.
- Support same-direction pyramiding, fully capture trend opportunities.
Risks
- Prone to false signals during price consolidations.
- Trend reversals may not always trigger stop loss, maximum loss cannot be controlled.
- Improper parameter settings may cause too sensitive or slow reactions.
- Proper products and time frames need to be selected for best results.
Improvements:
- Filter out invalid signals with other indicators;
- Add moving stop loss to lock profits and limit maximum drawdown;
- Test and optimize parameters for different products and cycles.
Optimization Directions
There is room for further optimization:
Other indicators can be introduced to filtrate some invalid signals, such as MACD, KD, etc.
Adaptive stop loss logic can be added, such as moving stop loss, balance stop loss, etc. to further control risks.
Test the impact of different parameters on strategy performance and optimize parameter combinations, such as MA cycle lengths, retracement coefficient sizes, etc.
The strategy currently trades in timed sessions. It can also be adjusted to all-day trading. This may require additional filtering rules.
Conclusion
In summary, this is a trend reversal trading strategy combining price channels and moving averages. By tracking trends and timely reverse opening positions, it can effectively follow price movements. At the same time, the risk control measures of price channels and reverse opening also enable it to effectively control single losses. The strategy idea is simple and clear, and is worth further testing and optimization in live trading.
Parameters
| Name | Default | What it controls |
|---|---|---|
| v_input_1 | true | Long |
| v_input_2 | true | Short |
| v_input_3 | 100 | Capital, % |
| v_input_4 | false | Correction, % |
| v_input_5 | true | bars |
| v_input_6 | false | revers |
| v_input_7 | true | Show Levels |
| v_input_8 | true | Show Levels one side |
| v_input_9 | false | Show Levels continuous line |
| v_input_10 | false | Show Background |
| v_input_11 | false | Show Arrows |
| v_input_12 | 1900 | From Year |
| v_input_13 | 2100 | To Year |
| v_input_14 | true | From Month |
| v_input_15 | 12 | To Month |
| v_input_16 | true | From day |
| v_input_17 | 31 | To day |
| v_input_18 | 3 | len |
Source Pine Script
/*backtest
start: 2023-12-01 00:00:00
end: 2023-12-31 23:59:59
period: 1h
basePeriod: 15m
exchanges: [{"eid":"Futures_Binance","currency":"BTC_USDT"}]
*/

//Noro
//2019

//@version=3
strategy(title = "Noro's 3Bars Strategy by Larry Williams", shorttitle = "3Bars", overlay = true, default_qty_type = strategy.percent_of_equity, default_qty_value = 100, pyramiding = 0)

//Settings
needlong = input(true, defval = true, title = "Long")
needshort = input(true, defval = true, title = "Short")
capital = input(100, defval = 100, minval = 1, maxval = 10000, title = "Capital, %")
corr = input(0.0, title = "Correction, %")
bars = input(1, minval = 1)
revers = input(false, defval = false, title = "revers")
showll = input(true, defval = true, title = "Show Levels")
showos = input(true, defval = true, title = "Show Levels one side")
showcl = input(false, defval = false, title = "Show Levels continuous line")
showbg = input(false, defval = false, title = "Show Background")
showar = input(false, defval = false, title = "Show Arrows")
fromyear = input(1900, defval = 1900, minval = 1900, maxval = 2100, title = "From Year")
toyear = input(2100, defval = 2100, minval = 1900, maxval = 2100, title = "To Year")
frommonth = input(01, defval = 01, minval = 01, maxval = 12, title = "From Month")
tomonth = input(12, defval = 12, minval = 01, maxval = 12, title = "To Month")
fromday = input(01, defval = 01, minval = 01, maxval = 31, title = "From day")
today = input(31, defval = 31, minval = 01, maxval = 31, title = "To day")

len = input(3)

hma = sma(high, len)
lma = sma(low, len)
plot(hma)
plot(lma)

//Levels
hbar = 0
hbar := high > high[1] ? 1 : high < high[1] ? -1 : 0
lbar = 0
lbar := low > low[1] ? 1 : low < low[1] ? -1 : 0
uplevel = 0.0
dnlevel = 0.0
hh = highest(high, bars + 1)
ll = lowest(low, bars + 1)
uplevel := hbar == -1 and sma(hbar, bars)[1] == 1 ? hh + ((hh / 100) * corr) : uplevel[1]
dnlevel := lbar == 1 and sma(lbar, bars)[1] == -1 ? ll - ((ll / 100) * corr) : dnlevel[1]

//Background
size = strategy.position_size
trend = 0
trend := size > 0 ? 1 : size < 0 ? -1 : high >= uplevel ? 1 : low <= dnlevel ? -1 : trend[1]
col = showbg == false ? na : trend == 1 ? lime : trend == -1 ? red : na
bgcolor(col)

//Lines
upcol = na
upcol := showll == false ? na : uplevel != uplevel[1] and showcl == false ? na : showos and trend[1] == 1 ? na : lime
plot(uplevel, color = upcol, linewidth = 2)
dncol = na
dncol := showll == false ? na : dnlevel != dnlevel[1] and showcl == false ? na : showos and trend[1] == -1 ? na : red
plot(dnlevel, color = dncol, linewidth = 2)

//Arrows
longsignal = false
shortsignal = false
longsignal := size > size[1]
shortsignal := size < size[1]
plotarrow(longsignal and showar and needlong ? 1 : na, colorup = blue, colordown = blue, transp = 0)
plotarrow(shortsignal and showar and needshort ? -1 : na, colorup = blue, colordown = blue, transp = 0)

//Trading
lot = 0.0
lot := size != size[1] ? strategy.equity / close * capital / 100 : lot[1]
if uplevel > 0 and dnlevel > 0 and revers == false
    strategy.entry("Long", strategy.long, needlong == false ? 0 : lot, stop = uplevel)
    strategy.entry("Long stop", strategy.short, 0, stop = lma)
    strategy.entry("Short", strategy.short, needshort == false ? 0 : lot, stop = dnlevel)
    strategy.entry("Short stop", strategy.long, 0, stop = hma)

// if time > timestamp(toyear, tomonth, today, 23, 59)
// strategy.close_all()Published by ChaoZhang on the FMZ strategy square · last modified 2024-01-03. Collected in the Quant Trading Vault. Unvalidated research: re-test with your own data and costs before trusting it.
Build this with AgenKit
A spec is not a trading system. Paste this into your coding agent and AgenKit runs a specialist team — architecture, test-first build, risk gates, review — with paper trading on by default.
/agenkit build a production-grade trading bot with a backtest engine, risk controls and paper trading by default from strategies/Trend-Tracking-Reversal-Strategy-437549.md- npx agenkit install engineering-kit in your project
- Paste the command into your agent and approve each phase
- Get tests, backtest, risk controls and a paper-trading switch
Understand it first
Before you run this, read the lesson behind the idea and how to backtest it honestly. Specs like this one are the survivors of an unknown number of trials; deflate their results accordingly.
Related specs
- 3 10 Oscillator Profile Flagging StrategyPine Script · Mean reversion · 1d
- A Trend Reversal Strategy Based on Moving Averages Price Patterns and VolumePine Script · Mean reversion · 1d
- Adaptive Mean Reversion Trading Strategy Based on Chande Momentum OscillatorPine Script · Mean reversion · 1d
- Adaptive Trading Strategy Combining Dynamic Trend Reversal and Stochastic IndicatorPine Script · Mean reversion · 1d
- Advanced 15 Minute Chart Trading Signal StrategyPine Script · Mean reversion · 3h
- Advanced Momentum EMA Trend Following with RSI Overbought Oversold Trading StrategyPine Script · Mean reversion · 1d