Strategy vault / Mean reversion
Trend Tracking Reversal Strategy
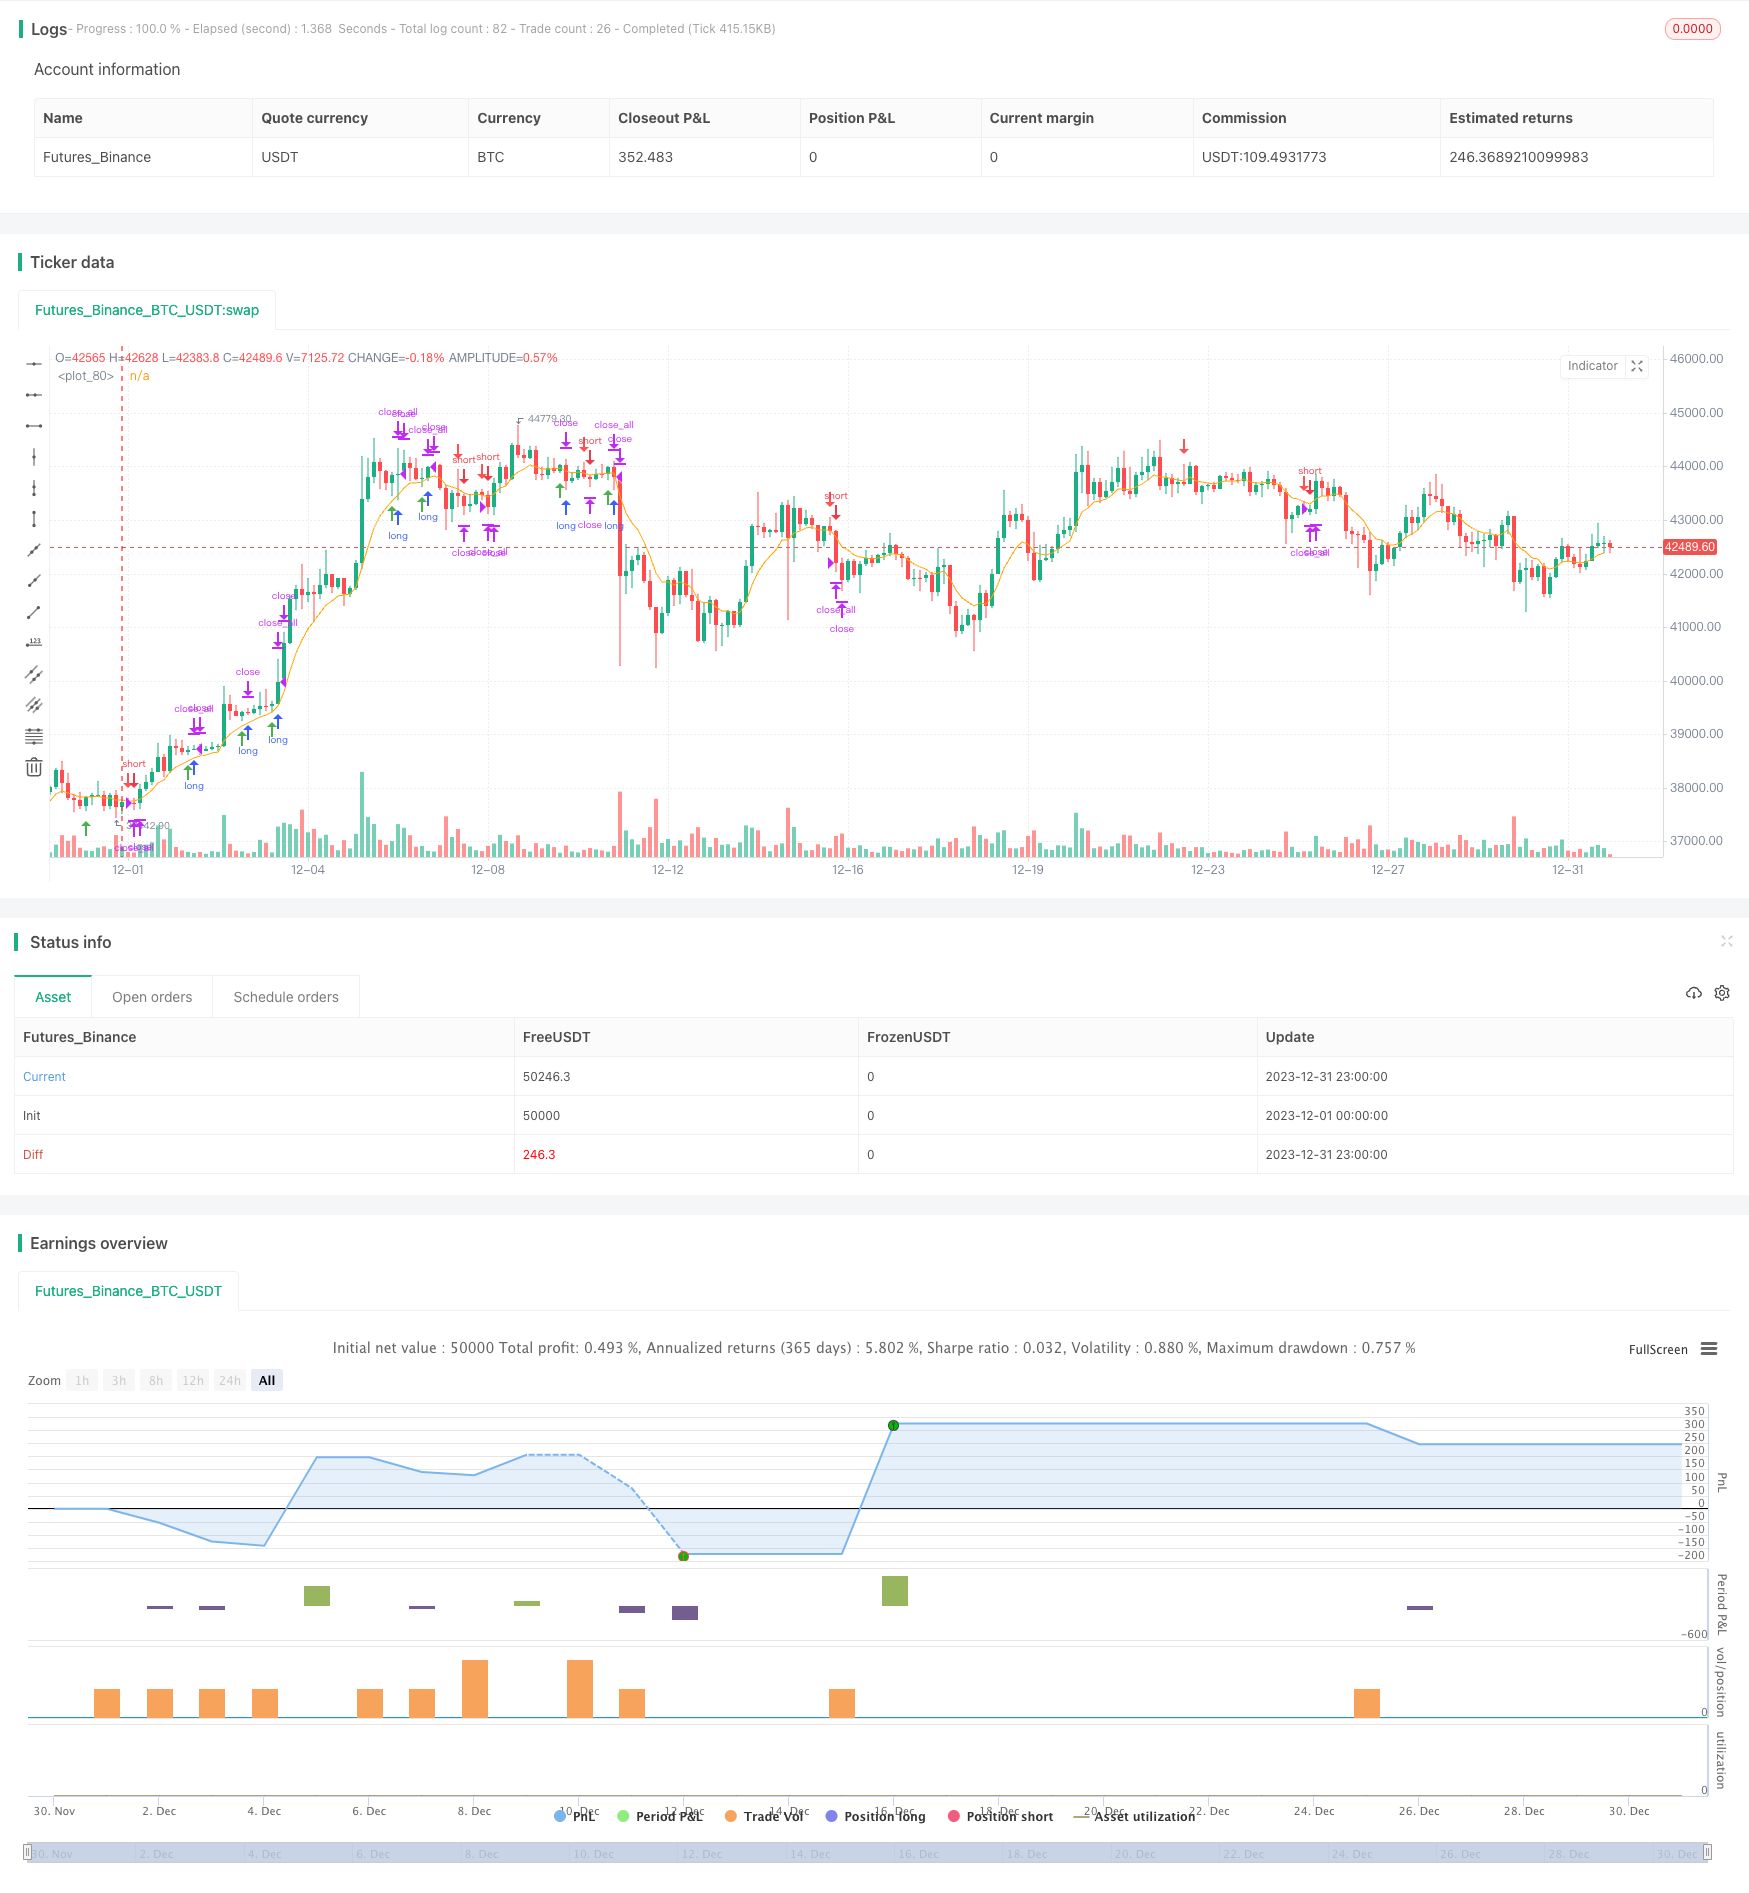
The Trend Tracking Reversal strategy is a short-term trend trading strategy based on 15-minute NQ futures. It identifies trading opportunities through trend filtering and reversal pattern recognition. This simple yet…
Overview
The Trend Tracking Reversal strategy is a short-term trend trading strategy based on 15-minute NQ futures. It identifies trading opportunities through trend filtering and reversal pattern recognition. This simple yet effective strategy suits active short-term traders.
Strategy Logic
The strategy mainly operates on the following principles:
Use an 8-period EMA as the main trend filter, with long signals above EMA and short signals below EMA.
Identify specific candlestick reversal patterns as entry signals, including long green candles followed by short red candles for long signals, and long red candles followed by short green candles for short signals. These patterns suggest a potential trend reversal.
Entry points are set near the high/low of the reversal candle, with stop loss levels at the high/low of the reversal candle itself, allowing efficient risk/reward ratios.
Validate reversal signals using candlestick relationship rules e.g. the open price of the red candle is above the last green candle's body, body fully engulfs etc to filter noise.
Only operate the strategy during specific trading hours, avoiding volatile periods around major contract rollovers etc, to prevent unnecessary losses from abnormal price action.
Advantage Analysis
The main advantages of this strategy include:
Simple and effective signal logic that is easy to grasp and execute.
Trend and reversal based, avoiding whipsaws from raging bull and bear markets.
Good risk control with reasonable stop loss placement for capital preservation.
Low data needs fit various platforms and tools.
High trading frequency suits active short-term trading style.
Risks & Solutions
There are some risks to note:
Insufficient reversal opportunities and limited signals. Relax reversal criteria to allow more signals.
Occasional false breakouts. Add more filters for combinational logic.
Volatility in overnight and non-main sessions. Restrict strategy operation to US trading hours.
Limited optimization flexibility. Consider machine learning for better parameter tuning.
Enhancement Opportunities
There is room for optimization:
Test longer EMA periods to improve trend definition.
Add equity index filters as supplemental trend filters.
Use machine learning techniques to auto-tune entry and stop loss levels.
Introduce volatility adjusted position sizing and dynamic stops.
Explore cross-asset arbitrage to diversify single-asset systemic risks.
Conclusion
The Trend Tracking Reversal Strategy offers a very practical short-term strategy framework that is simple to implement with limited parameters and good personal risk control. It suits active short-term traders on day trading forums. With further R&D, it can potentially be applicable for medium-long term algorithmic trading, demonstrating strong versatility and development potential.
Parameters
| Name | Default | What it controls |
|---|---|---|
| v_input_1 | 0930-1415 | Trading Session |
| v_input_2 | 1515-1558 | Close All Open Trades |
| v_input_color_1 | orange | EMA Color |
| v_input_int_1 | 8 | EMA Length |
| v_input_string_1 | 0 | Sell Entry Shape: Arrow | Triangle |
| v_input_string_2 | 0 | Buy Entry Shape: Arrow | Triangle |
| v_input_3 | timestamp(2018-12-24T00:00:00) | (?ALL STRATEGY SETTINGS BELOW)startDate |
| v_input_4 | timestamp(2029-02-26T00:00:00) | finishDate |
| v_input_5 | true | (?TP/SL CONDITION INPUTS HERE)Enter RR |
Source Pine Script
/*backtest
start: 2023-12-01 00:00:00
end: 2023-12-31 23:59:59
period: 3h
basePeriod: 15m
exchanges: [{"eid":"Futures_Binance","currency":"BTC_USDT"}]
*/

// This Pine Script™ code is subject to the terms of the Mozilla Public License 2.0 at https://mozilla.org/MPL/2.0/
// © bdrex95

//@version=5

// Rob Reversal Strategy - Official
// Using Rob Reversal Indicator: Original
// Description
// This indicator is based on the strategy created by Trader Rob on the NQ 15m chart.
//
// Timeframe for trading is 8:30am-1:15pm Central.
//
// Above the EMA line, look for a long position. You will have a short candle, then a long candle that opens below the short candle. It will have a lower high and a lower low. Once the long candle closes, your entry will be 1 tick above the wick (green line) and stop loss will be at the bottom of the bottom wick (red line).
//
// Below the EMA line, look for a short position. You will have a long candle, then a short candle that opens above the long candle. It will have a higher high and a higher low. Once the short candle closes, your entry will be 1 tick below the wick (green line) and stop loss will be at the top of the top wick (red line).
//

strategy("Trader Rob Reversal Strategy NQ 15min", shorttitle="Official Rob Rev Strat", overlay=true)


//--- Session Input ---
sess = input(defval = "0930-1415", title="Trading Session")
t = time(timeframe.period, sess)
sessionOpen = na(t) ? false : true

flat_time = input(defval = "1515-1558", title="Close All Open Trades")
ft = time(timeframe.period, flat_time)
flatOpen = na(ft) ? false : true


// Calculate start/end date and time condition
startDate = input(timestamp('2018-12-24T00:00:00'),group = "ALL STRATEGY SETTINGS BELOW")
finishDate = input(timestamp('2029-02-26T00:00:00'),group = "ALL STRATEGY SETTINGS BELOW")
time_cond = true


emaColor = input.color(color.orange, title="EMA Color")
emaLength = input.int(8, title="EMA Length")


emaInd = ta.ema(close, emaLength)


rr = input(1.0,"Enter RR",group = "TP/SL CONDITION INPUTS HERE")


sellShapeInput = input.string("Arrow", title="Sell Entry Shape", options=["Arrow", "Triangle"])
buyShapeInput = input.string("Arrow", title="Buy Entry Shape", options=["Arrow", "Triangle"])


sellShapeOption = switch sellShapeInput
    "Arrow" => shape.arrowdown
    "Triangle" => shape.triangledown

buyShapeOption = switch buyShapeInput
    "Arrow" => shape.arrowup
    "Triangle" => shape.triangleup


O = open
C = close
H = high
L = low


sellEntry = (C[1] > O[1]) and (C < O) and (H[1] < H) and (C < H[1]) and (C > L[1]) and (L > L[1]) and (C < emaInd) and sessionOpen and time_cond
buyEntry = (C[1] < O[1]) and (C > O) and (H[1] > H) and (L[1] > L) and (C < H[1]) and (C > L[1]) and (C > emaInd) and sessionOpen and time_cond


sellEntry_index = ta.valuewhen(sellEntry,bar_index,0)
sellEntry_hi = ta.valuewhen(sellEntry,high,0)
sellEntry_low = ta.valuewhen(sellEntry,low,0)
buyEntry_index = ta.valuewhen(buyEntry,bar_index,0)
buyEntry_hi = ta.valuewhen(buyEntry,high,0)
buyEntry_lo = ta.valuewhen(buyEntry,low,0)


plotshape(buyEntry, color = color.green, location = location.belowbar, style = buyShapeOption, size = size.small)
plotshape(sellEntry, color = color.red, location = location.abovebar, style = sellShapeOption, size = size.small)
plot(emaInd, color=emaColor)


// Risk Management
entry_price_long = (buyEntry_hi + syminfo.mintick)
entry_price_short = (sellEntry_low - syminfo.mintick)
long_sl_price = (buyEntry_lo-syminfo.mintick)
short_sl_price = (sellEntry_hi + syminfo.mintick)
long_tp_price = ((entry_price_long - long_sl_price)*rr) + entry_price_long
short_tp_price = entry_price_short - ((short_sl_price - entry_price_short)*rr)


long_sl_ticks = (entry_price_long - long_sl_price) / syminfo.mintick
short_sl_ticks = (short_sl_price - entry_price_short) / syminfo.mintick


long_tp_ticks = (long_tp_price - entry_price_long) / syminfo.mintick
short_tp_ticks = (entry_price_short - short_tp_price) / syminfo.mintick


// Positions
if (buyEntry)
    strategy.entry("Long", strategy.long,stop = H + syminfo.mintick)
if strategy.position_size > 0
    strategy.exit("Long Ex","Long", loss = long_sl_ticks, profit = long_tp_ticks, comment_loss = "SL Long", comment_profit = "TP Long")


if (sellEntry)
    strategy.entry("Short", strategy.short,stop = L - syminfo.mintick)
if strategy.position_size < 0
    strategy.exit("Short Ex","Short",loss = short_sl_ticks, profit = short_tp_ticks, comment_loss = "SL Short", comment_profit = "TP Short")


// Cancel order if close beyond ema
if (C < emaInd)
    strategy.cancel("Long")


if (C > emaInd)
    strategy.cancel("Short")


// Go flat at close (for futures funded account)
if strategy.position_size > 0 and flatOpen
    strategy.close_all(comment = "EOD Flat")
if strategy.position_size < 0 and flatOpen
    strategy.close_all(comment = "EOD Flat")

//ENDPublished by ChaoZhang on the FMZ strategy square · last modified 2024-01-16. Collected in the Quant Trading Vault. Unvalidated research: re-test with your own data and costs before trusting it.
Build this with AgenKit
A spec is not a trading system. Paste this into your coding agent and AgenKit runs a specialist team — architecture, test-first build, risk gates, review — with paper trading on by default.
/agenkit build a production-grade trading bot with a backtest engine, risk controls and paper trading by default from strategies/Trend-Tracking-Reversal-Strategy.md- npx agenkit install engineering-kit in your project
- Paste the command into your agent and approve each phase
- Get tests, backtest, risk controls and a paper-trading switch
Understand it first
Before you run this, read the lesson behind the idea and how to backtest it honestly. Specs like this one are the survivors of an unknown number of trials; deflate their results accordingly.
Related specs
- 1 2 3 Pattern Quantitative Trading Strategy with EMAs MACD and 4th Candle ExtensionPine Script · Mean reversion · 1h
- ATR and EMA based Dynamic Take Profit and Stop Loss Adaptive StrategyPine Script · Mean reversion · 1h
- Advanced 15 Minute Chart Trading Signal StrategyPine Script · Mean reversion · 3h
- Advanced Momentum EMA Trend Following with RSI Overbought Oversold Trading StrategyPine Script · Mean reversion · 1d
- Advanced Quantitative Trading Strategy Combining RSI Divergence and Moving AveragesPine Script · Mean reversion · 1h
- Advanced Quantitative Trend Following and Cloud Reversal Composite Trading StrategyPine Script · Mean reversion · 1d