Strategy vault / Trend following
Trend Tracking Strategy Based on Dynamic Pivot Bands
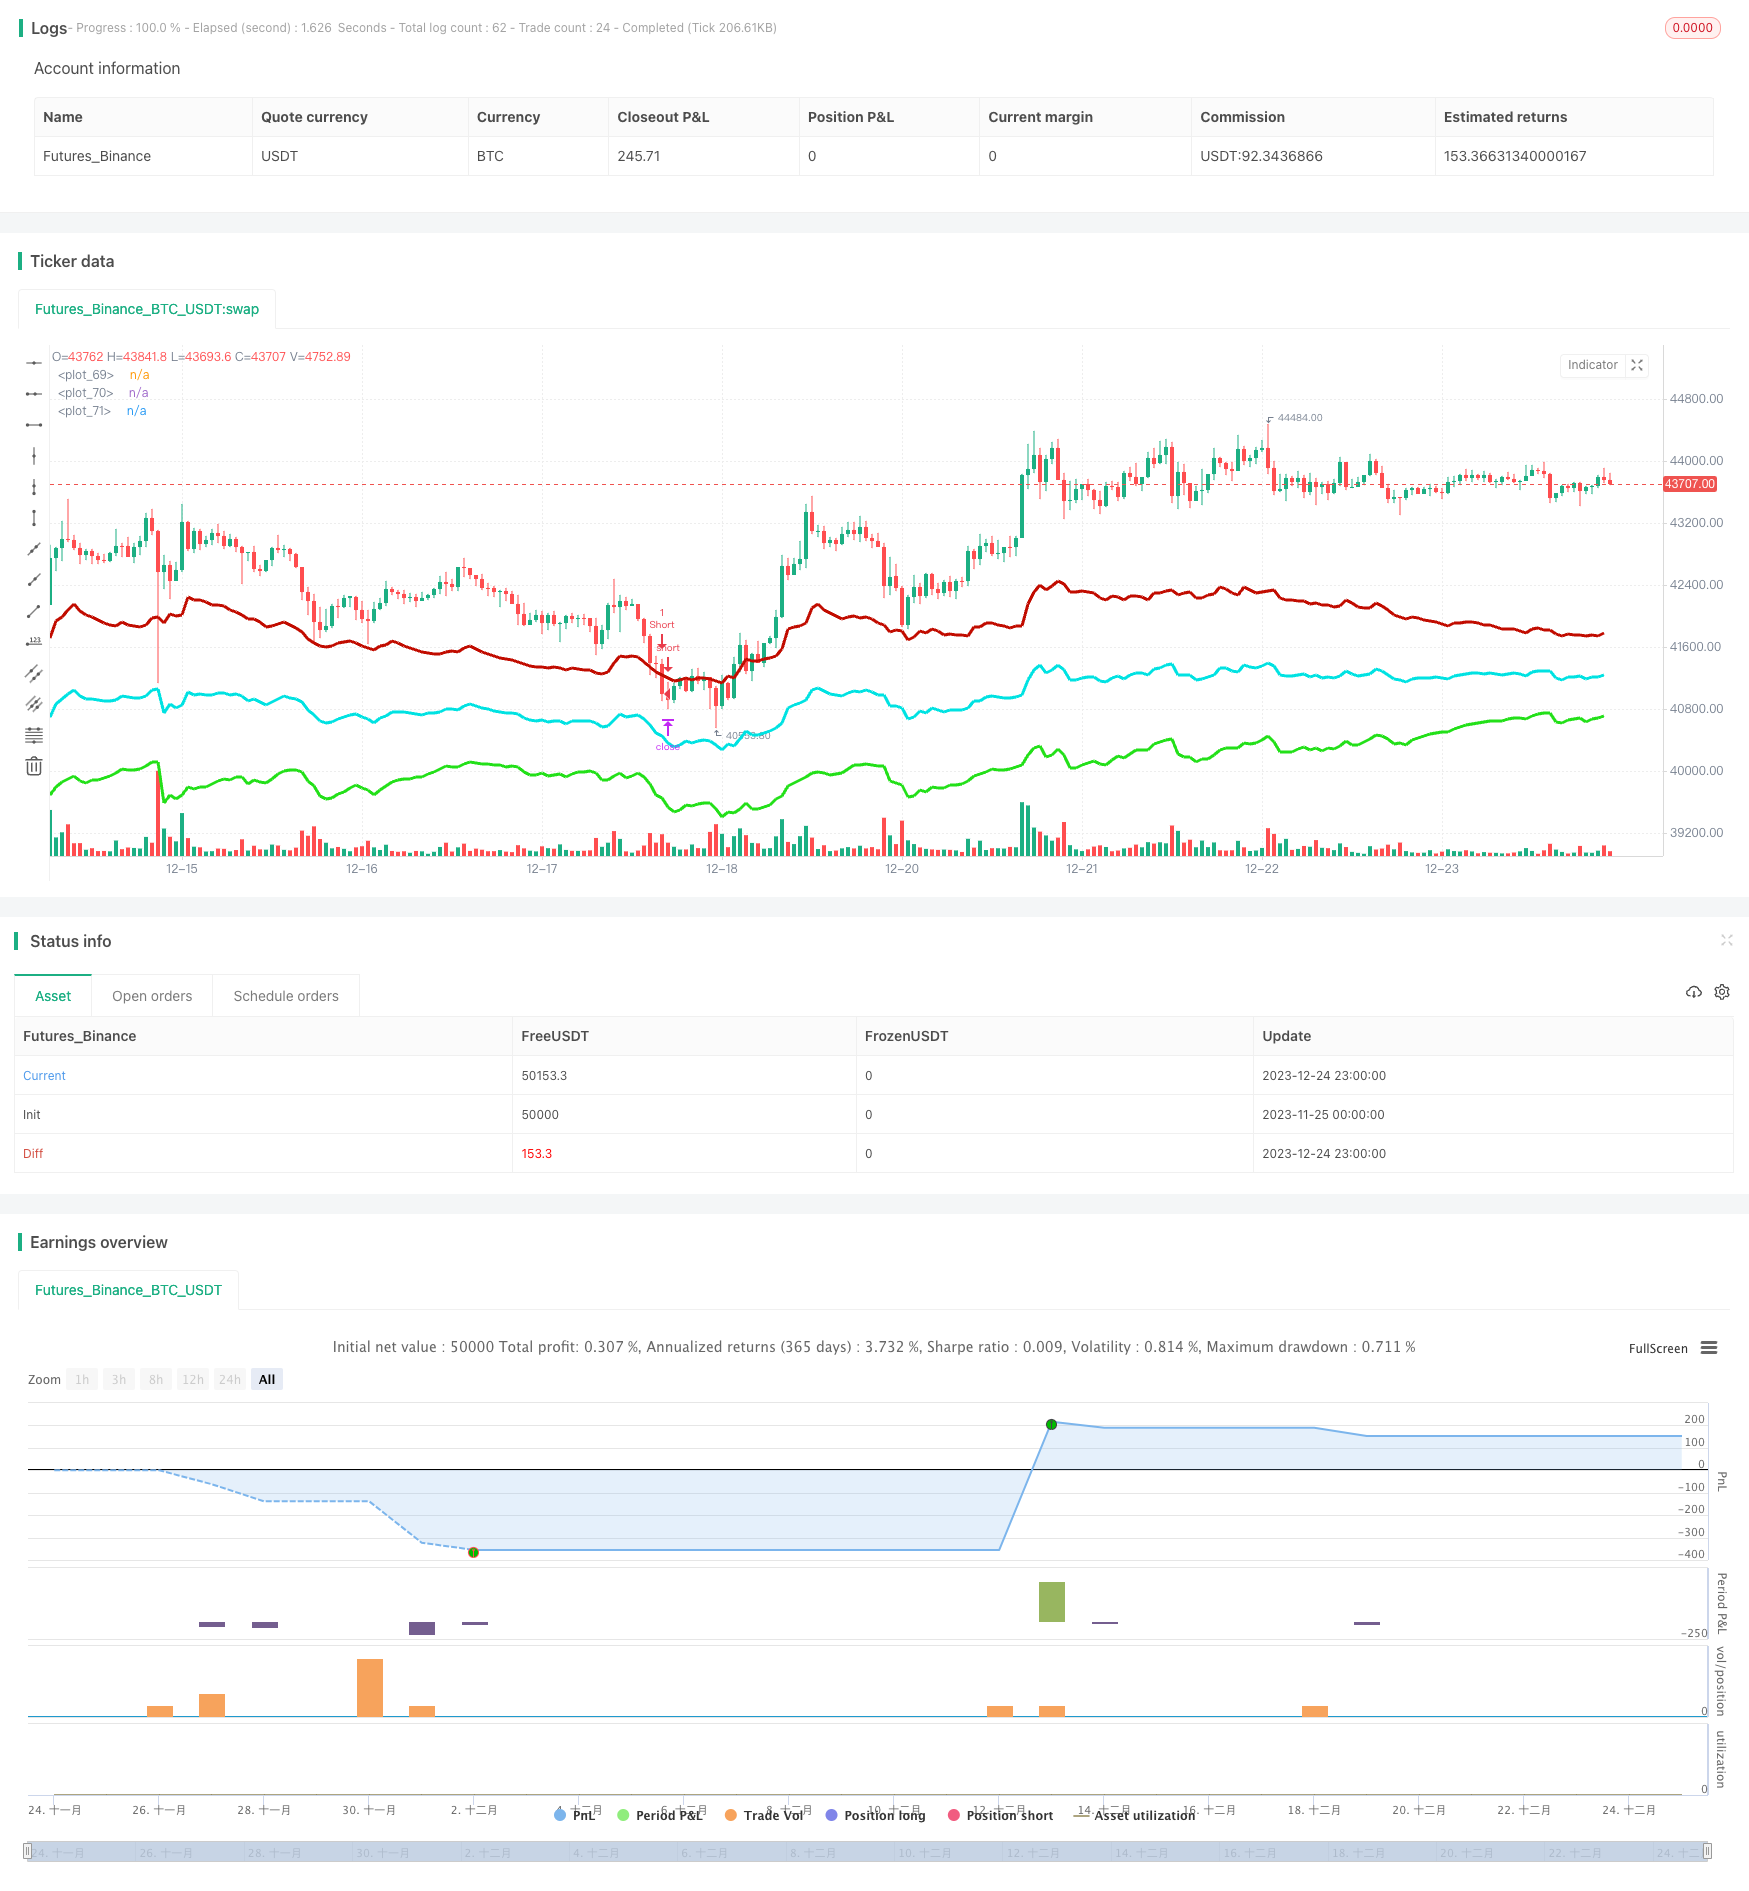
This strategy calculates the recent highest and lowest prices over a certain period, combined with the current price, to form a dynamic middle line. Red downside channel and green upside channel are then generated…
Overview
This strategy calculates the recent highest and lowest prices over a certain period, combined with the current price, to form a dynamic middle line. Red downside channel and green upside channel are then generated based on recent volatility. The three channel lines form a tradable range. When the price approaches the channel boundaries, reverse operations are carried out targeting profits back to the middle line. Meanwhile, there is a trend calculation inside the strategy to filter trades against the trend and avoid being destroyed by the major trend.
Strategy Logic
- Calculate dynamic middle line with recent highest price, lowest price and current close price
- Generate dynamic bands based on ATR and multiplier, width changes with market volatility
- Go long when price bounces off the bottom band, go short when bounces off the top band
- Have take profit and stop loss logic targeting middle line
- Meanwhile calculate trend index to filter trades against trend
Advantage Analysis
- Dynamic bands adapt to real-time market volatility
- High probability of trading along trend
- Stop loss controls single loss
Risk Analysis
- Improper parameter optimization may lead to overtrading
- Unable to completely eliminate counter-trend trades under major trends
- One-sided breakout may continue running
Optimization Direction
- Adjust parameters of bands to fit different products
- Fine tune trend index parameters to improve trend-trading probability
- Introduce machine learning elements for dynamic parameter optimization
Summary
This strategy mainly relies on the oscillation of the market to make profits. By capturing price reversal points dynamically with the bands, combined with trend filtering, it can effectively profit from mean-reversion while controlling risks. The key lies in parameter tuning to make the bands responsive yet not oversensitive. The trend index also needs proper periods to play its role. With theoretical favorable trend and stops, this strategy can achieve decent returns through optimization.
Parameters
| Name | Default | What it controls |
|---|---|---|
| v_input_1 | 24 | Pivot Length, defines lookback for highs and lows to make pivots |
| v_input_2 | 22 | ATR lookback (Lower = bands more responsive to recent price action) |
| v_input_3 | 3 | ATR multiplier (Lower = wider bands) |
| v_input_4 | 2 | Momentum Period |
| v_input_5 | 20 | Slow Period |
| v_input_6 | 5 | Fast Period |
| v_input_7 | 3 | Smoothing Period |
| v_input_8 | 4 | Signal Period |
| v_input_9 | 50 | Extreme Value |
| v_input_10 | false | Take Profit (In Market MinTick Value) |
| v_input_11 | 100 | Stop Loss (In Market MinTick Value) |
Source Pine Script
/*backtest
start: 2023-11-25 00:00:00
end: 2023-12-25 00:00:00
period: 1h
basePeriod: 15m
exchanges: [{"eid":"Futures_Binance","currency":"BTC_USDT"}]
*/

//@version=4
strategy(title="Strategy - Bobo PAPATR", overlay=true, default_qty_type = strategy.fixed, default_qty_value = 1, initial_capital = 10000)

// === STRATEGY RELATED INPUTS AND LOGIC ===
len = input(24, minval=1, title="Pivot Length, defines lookback for highs and lows to make pivots")
length = input(title="ATR lookback (Lower = bands more responsive to recent price action)", type=input.integer, defval=22)
myatr = atr(length)
dailyatr = myatr[1]
atrmult = input(title="ATR multiplier (Lower = wider bands)", type=input.float, defval=3)
pivot0 = (high[1] + low[1]  + close[1]) / 3

// PIVOT CALC
h = highest(len)
h1 = dev(h, len) ? na : h
hpivot = fixnan(h1)
l = lowest(len)
l1 = dev(l, len) ? na : l
lpivot = fixnan(l1)
pivot = (lpivot + hpivot + pivot0) / 3
upperband1 = (dailyatr * atrmult) + pivot
lowerband1 = pivot - (dailyatr * atrmult)
middleband = pivot

// == TREND CALC ===
i1=input(2, "Momentum Period", minval=1) //Keep at 2 usually
i2=input(20, "Slow Period", minval=1)
i3=input(5, "Fast Period", minval=1)
i4=input(3, "Smoothing Period", minval=1)
i5=input(4, "Signal Period", minval=1)
i6=input(50, "Extreme Value", minval=1)
hiDif = high - high[1]
loDif = low[1] - low
uDM = hiDif > loDif and hiDif > 0 ? hiDif : 0
dDM =  loDif > hiDif and loDif > 0 ? loDif : 0
ATR = rma(tr(true), i1)
DIu = 100 * rma(uDM, i1) / ATR
DId = 100 * rma(dDM, i1) / ATR
HLM2 =  DIu - DId
DTI = (100 * ema(ema(ema(HLM2, i2), i3), i4)) /  ema(ema(ema(abs(HLM2), i2), i3), i4)
signal = ema(DTI, i5)


// === RISK MANAGEMENT INPUTS ===
inpTakeProfit   = input(defval = 0, title = "Take Profit (In Market MinTick Value)", minval = 0)
inpStopLoss     = input(defval = 100, title = "Stop Loss (In Market MinTick Value)", minval = 0)

// === RISK MANAGEMENT VALUE PREP ===
// if an input is less than 1, assuming not wanted so we assign 'na' value to disable it.
useTakeProfit   = inpTakeProfit  >= 1 ? inpTakeProfit  : na
useStopLoss     = inpStopLoss    >= 1 ? inpStopLoss    : na

// === STRATEGY - LONG POSITION EXECUTION ===
enterLong = (((low<=lowerband1) and (close >lowerband1)) or ((open <= lowerband1) and (close > lowerband1))) and (strategy.opentrades <1) and (atr(3) > atr(50)) and (signal>signal[3])
exitLong = (high > middleband)
strategy.entry(id = "Long", long = true, when = enterLong)
strategy.close(id = "Long", when = exitLong)

// === STRATEGY - SHORT POSITION EXECUTION ===
enterShort = (((high>=upperband1) and (close < upperband1)) or ((open >= upperband1) and (close < upperband1))) and (strategy.opentrades <1) and (atr(3) > atr(50)) and (signal<signal[3])
exitShort = (low < middleband)
strategy.entry(id = "Short", long = false, when = enterShort)
strategy.close(id = "Short", when = exitShort)

// === STRATEGY RISK MANAGEMENT EXECUTION ===
strategy.exit("Exit Long", from_entry = "Long", profit = useTakeProfit, loss = useStopLoss)
strategy.exit("Exit Short", from_entry = "Short", profit = useTakeProfit, loss = useStopLoss)

// === CHART OVERLAY ===
plot(upperband1, color=#C10C00, linewidth=3)
plot(lowerband1, color=#23E019, linewidth=3)
plot(middleband, color=#00E2E2, linewidth=3)
//plot(strategy.equity, title="equity", color=red, linewidth=2, style=areabr)Published by ChaoZhang on the FMZ strategy square · last modified 2023-12-26. Collected in the Quant Trading Vault. Unvalidated research: re-test with your own data and costs before trusting it.
Build this with AgenKit
A spec is not a trading system. Paste this into your coding agent and AgenKit runs a specialist team — architecture, test-first build, risk gates, review — with paper trading on by default.
/agenkit build a production-grade trading bot with a backtest engine, risk controls and paper trading by default from strategies/Trend-Tracking-Strategy-Based-on-Dynamic-Pivot-Bands.md- npx agenkit install engineering-kit in your project
- Paste the command into your agent and approve each phase
- Get tests, backtest, risk controls and a paper-trading switch
Understand it first
Before you run this, read the lesson behind the idea and how to backtest it honestly. Specs like this one are the survivors of an unknown number of trials; deflate their results accordingly.
Related specs
- Fixed Range Volume Profile And Anchored VWAP Trend Identification Strategy With Dynamic Stop LossPine Script · Trend following · 1h
- Multi Factor Trend Price Action Strategy with Dynamic Risk Management SystemPine Script · Trend following · 2h
- Multi Indicator Dynamic Trend Following Strategy Based on EMA and SMAPine Script · Trend following · 1d
- Trend Following Strategy Based on PMax IndicatorPine Script · Trend following · 5m
- Trend Tracking and Short term Trading Strategy Based on ADX IndicatorPine Script · Trend following · 1d
- Triple Supertrend Ichimoku Cloud Quantitative Trading StrategyPine Script · Trend following · 1d