Triangle Breakout with RSI Momentum Strategy
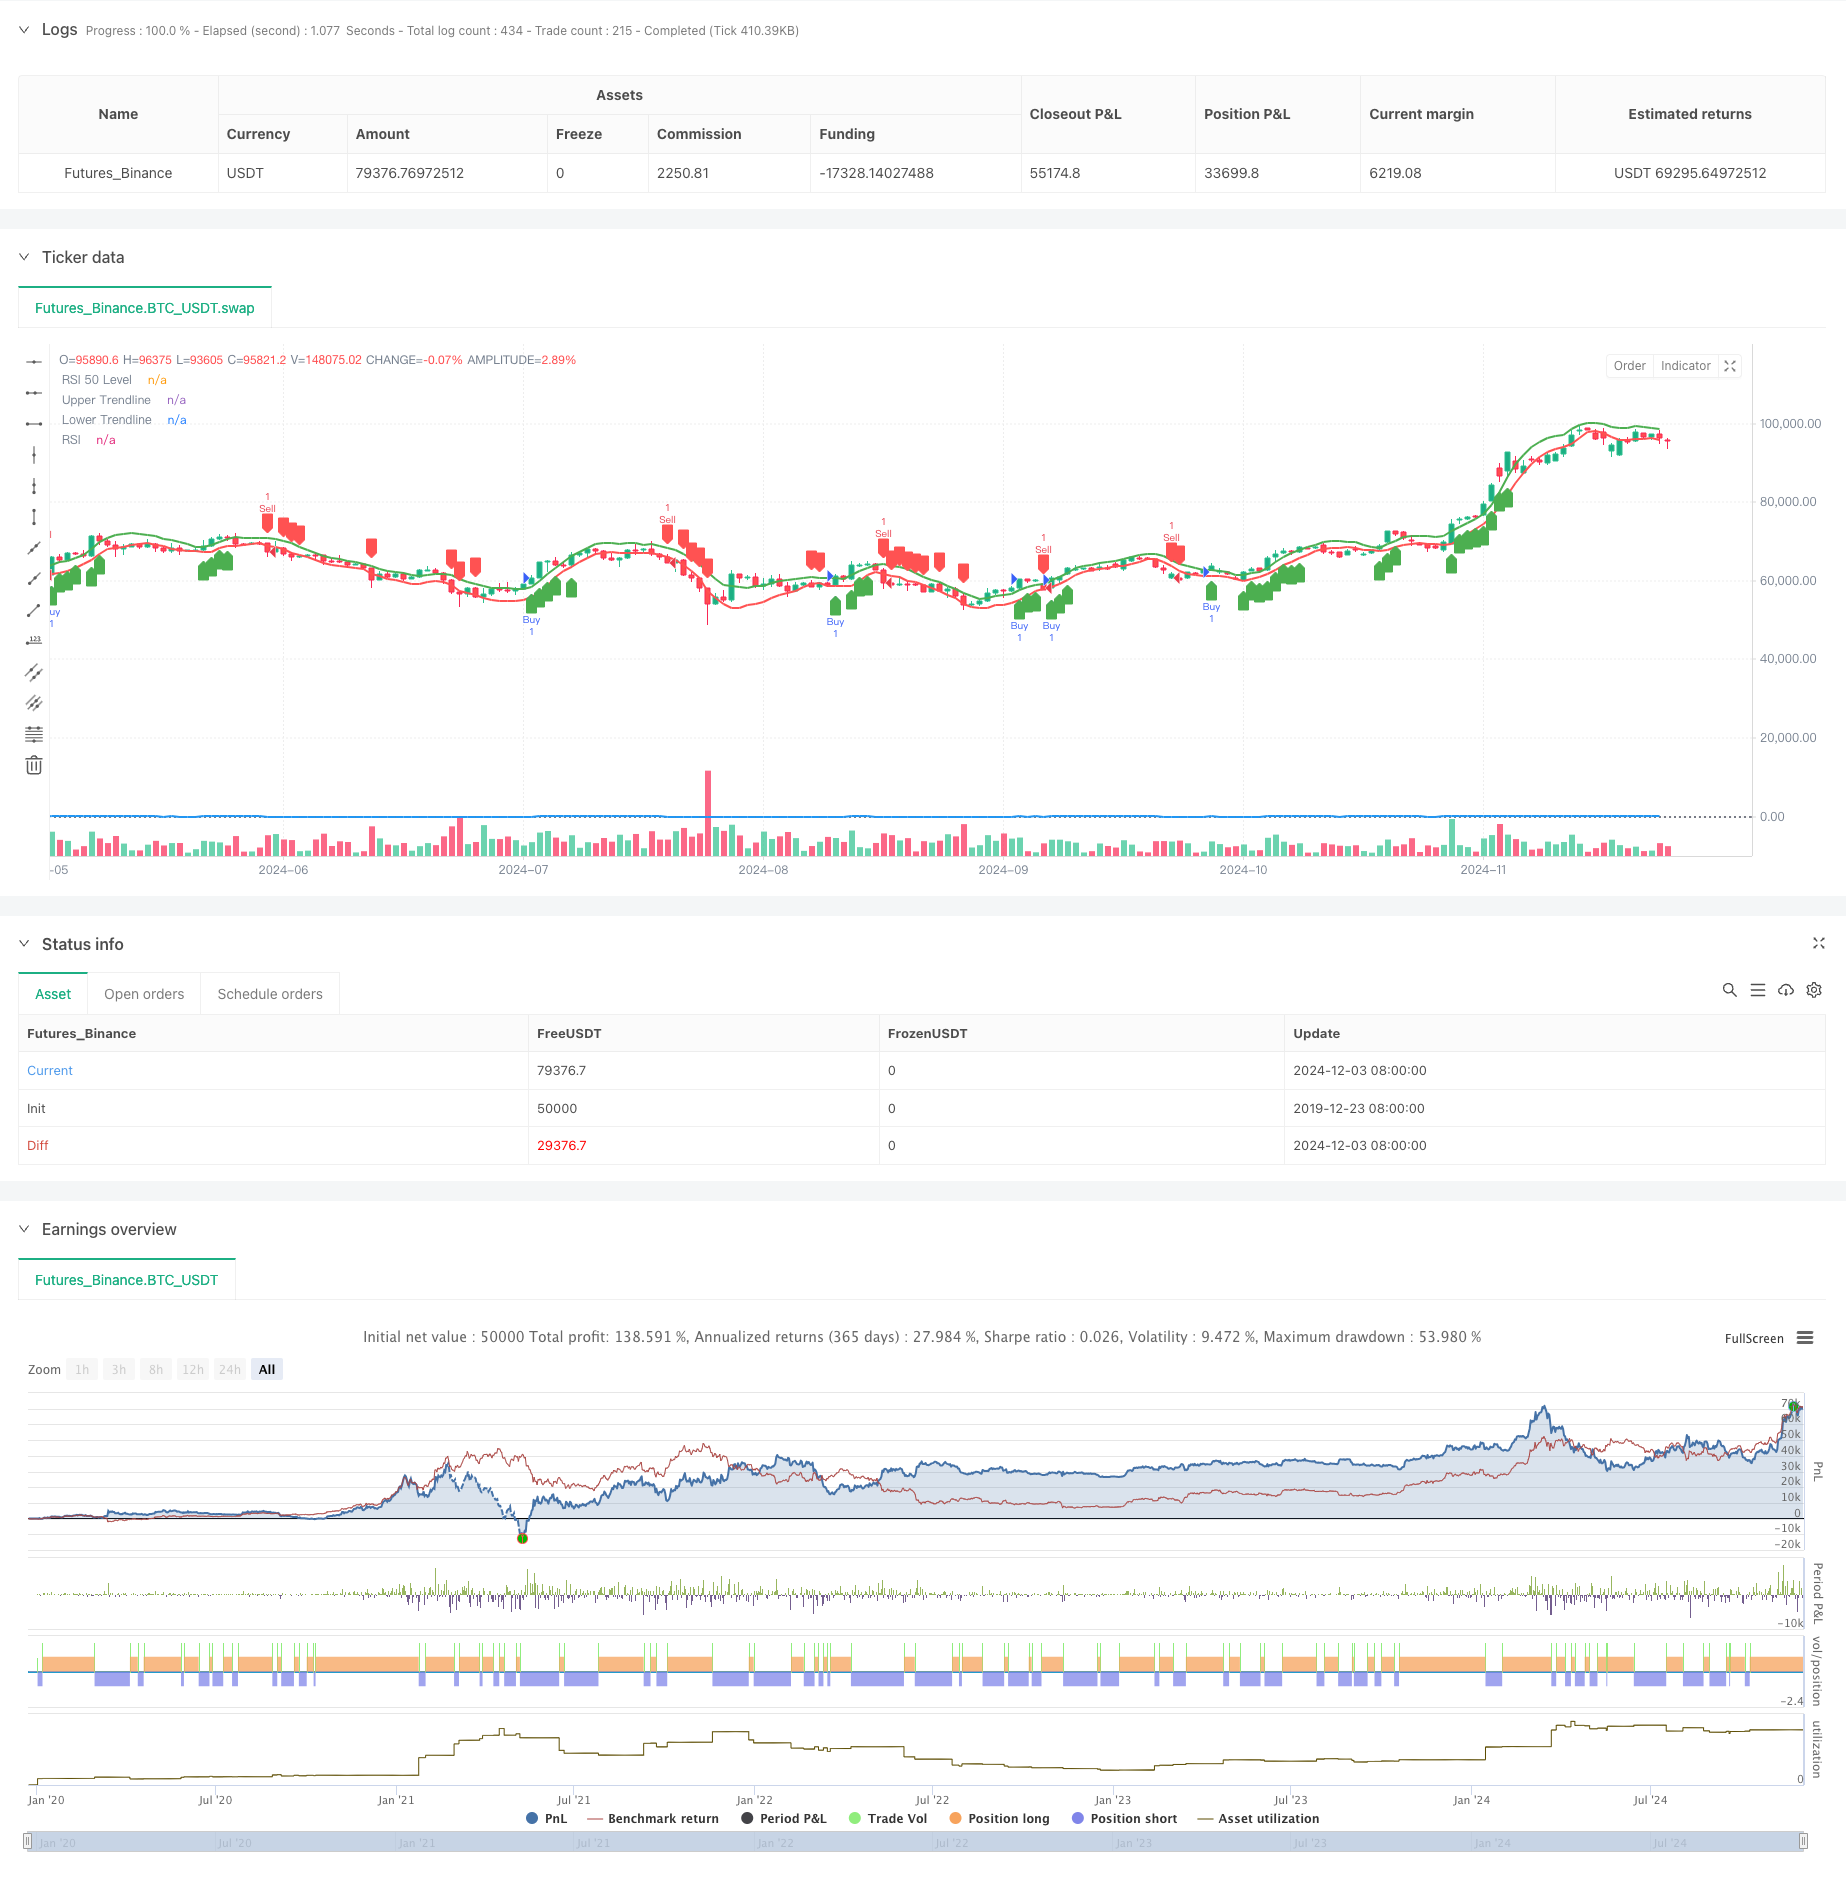
This strategy is a quantitative trading system that combines price pattern and technical indicators. It primarily identifies triangle pattern breakouts and confirms trades using RSI momentum. The strategy uses linear…
Overview
This strategy is a quantitative trading system that combines price pattern and technical indicators. It primarily identifies triangle pattern breakouts and confirms trades using RSI momentum. The strategy uses linear regression to construct upper and lower trendlines, determining trading signals through price breakouts and RSI positions, achieving an organic combination of pattern and momentum analysis.
Strategy Principle
The core logic consists of two main components: triangle pattern recognition and RSI momentum confirmation. First, it uses linear regression to calculate recent N-period highs and lows, constructing upper and lower trendlines to form a triangle. When price breaks above the upper trendline and RSI is above 50, it triggers a buy signal; when price breaks below the lower trendline and RSI is below 50, it triggers a sell signal. The strategy features adjustable parameters for triangle length and RSI period, providing strong adaptability.
Strategy Advantages
- Clear Structure: The strategy organically combines pattern analysis and momentum analysis, improving trading reliability through double confirmation.
- Flexible Parameters: Provides adjustable triangle length and RSI period parameters, facilitating optimization for different market characteristics.
- Strong Visualization: Clearly displays trendlines and trading signals on charts, facilitating strategy monitoring and backtesting analysis.
- Controlled Risk: Uses RSI as a filter to effectively reduce risks from false breakouts.
Strategy Risks
- May generate frequent trades in choppy markets, increasing transaction costs.
- Trendline calculations based on historical data may lag in rapidly volatile markets.
- RSI indicator may generate false signals under certain market conditions.
- Strategy lacks stop-loss mechanism, potentially bearing significant losses during extreme market volatility.
Strategy Optimization Directions
- Introduce Stop-Loss Mechanism: Recommend adding fixed or trailing stop-loss for risk control.
- Optimize Entry Timing: Consider adding volume confirmation to improve breakout signal reliability.
- Enhance Signal Filtering: Can add trend filters to avoid frequent trading in ranging markets.
- Dynamic Parameter Optimization: Suggest dynamically adjusting triangle length and RSI thresholds based on market volatility.
Conclusion
The Triangle Breakout with RSI Momentum Strategy is a complete and logically clear quantitative trading system. Through the dual confirmation mechanism of pattern and momentum, it effectively improves trading signal reliability. While certain risks exist, the strategy has good practical value through reasonable parameter optimization and risk control measures. Traders are advised to conduct thorough parameter optimization and backtesting verification based on specific market characteristics before live trading.
Source Pine Script
/*backtest
start: 2019-12-23 08:00:00
end: 2024-12-04 00:00:00
period: 1d
basePeriod: 1d
exchanges: [{"eid":"Futures_Binance","currency":"BTC_USDT"}]
*/

//@version=5
strategy("Triangle Breakout with RSI", overlay=true)

// Input parameters
len = input.int(15, title="Triangle Length")
rsiPeriod = input.int(14, title="RSI Period")
rsiThresholdBuy = input.int(50, title="RSI Threshold for Buy")
rsiThresholdSell = input.int(50, title="RSI Threshold for Sell")

// Calculate the RSI
rsi = ta.rsi(close, rsiPeriod)

// Calculate highest high and lowest low for triangle pattern
highLevel = ta.highest(high, len)
lowLevel = ta.lowest(low, len)

// Create trendlines for the triangle
upperTrend = ta.linreg(high, len, 0)
lowerTrend = ta.linreg(low, len, 0)

// Plot the trendlines on the chart
plot(upperTrend, color=color.green, linewidth=2, title="Upper Trendline")
plot(lowerTrend, color=color.red, linewidth=2, title="Lower Trendline")

// Detect breakout conditions
breakoutUp = close > upperTrend
breakoutDown = close < lowerTrend

// Confirm breakout with RSI
buyCondition = breakoutUp and rsi > rsiThresholdBuy
sellCondition = breakoutDown and rsi < rsiThresholdSell

// Plot breakout signals with confirmation from RSI
plotshape(series=buyCondition, title="Buy Signal", location=location.belowbar, color=color.green, style=shape.labelup, size=size.small)
plotshape(series=sellCondition, title="Sell Signal", location=location.abovebar, color=color.red, style=shape.labeldown, size=size.small)

// Strategy: Buy when triangle breaks upwards and RSI is above 50; Sell when triangle breaks downwards and RSI is below 50
if (buyCondition)
    strategy.entry("Buy", strategy.long)

if (sellCondition)
    strategy.entry("Sell", strategy.short)

// Plot RSI on the bottom pane
hline(50, "RSI 50 Level", color=color.gray, linestyle=hline.style_dotted)
plot(rsi, color=color.blue, linewidth=2, title="RSI")
Published by ChaoZhang on the FMZ strategy square · last modified 2024-12-05. Collected in the Quant Trading Vault. Unvalidated research: re-test with your own data and costs before trusting it.
Build this with AgenKit
A spec is not a trading system. Paste this into your coding agent and AgenKit runs a specialist team — architecture, test-first build, risk gates, review — with paper trading on by default.
/agenkit build a production-grade trading bot with a backtest engine, risk controls and paper trading by default from strategies/Triangle-Breakout-with-RSI-Momentum-Strategy.md- npx agenkit install engineering-kit in your project
- Paste the command into your agent and approve each phase
- Get tests, backtest, risk controls and a paper-trading switch
Understand it first
Before you run this, read the lesson behind the idea and how to backtest it honestly. Specs like this one are the survivors of an unknown number of trials; deflate their results accordingly.
Related specs
- Multi Filter Trend Breakthrough Smart Moving Average Trading StrategyPine Script · Breakout · 1h
- Multi Indicator Momentum Breakout with Smoothed Candlestick Trading StrategyPine Script · Breakout · 6h
- Multi Indicator Trend Breakout Strategy with Dynamic Stop LossPine Script · Breakout · 1d
- Multi Technical Indicator Dynamic Wave Trading StrategyPine Script · Breakout · 1h
- Multi factor Intelligent Trading StrategyPine Script · Breakout · 1d
- Stochastic RSI and Volume Based Trading StrategyPine Script · Breakout · 2h