Triple Overlapping Stochastic Momentum Strategy
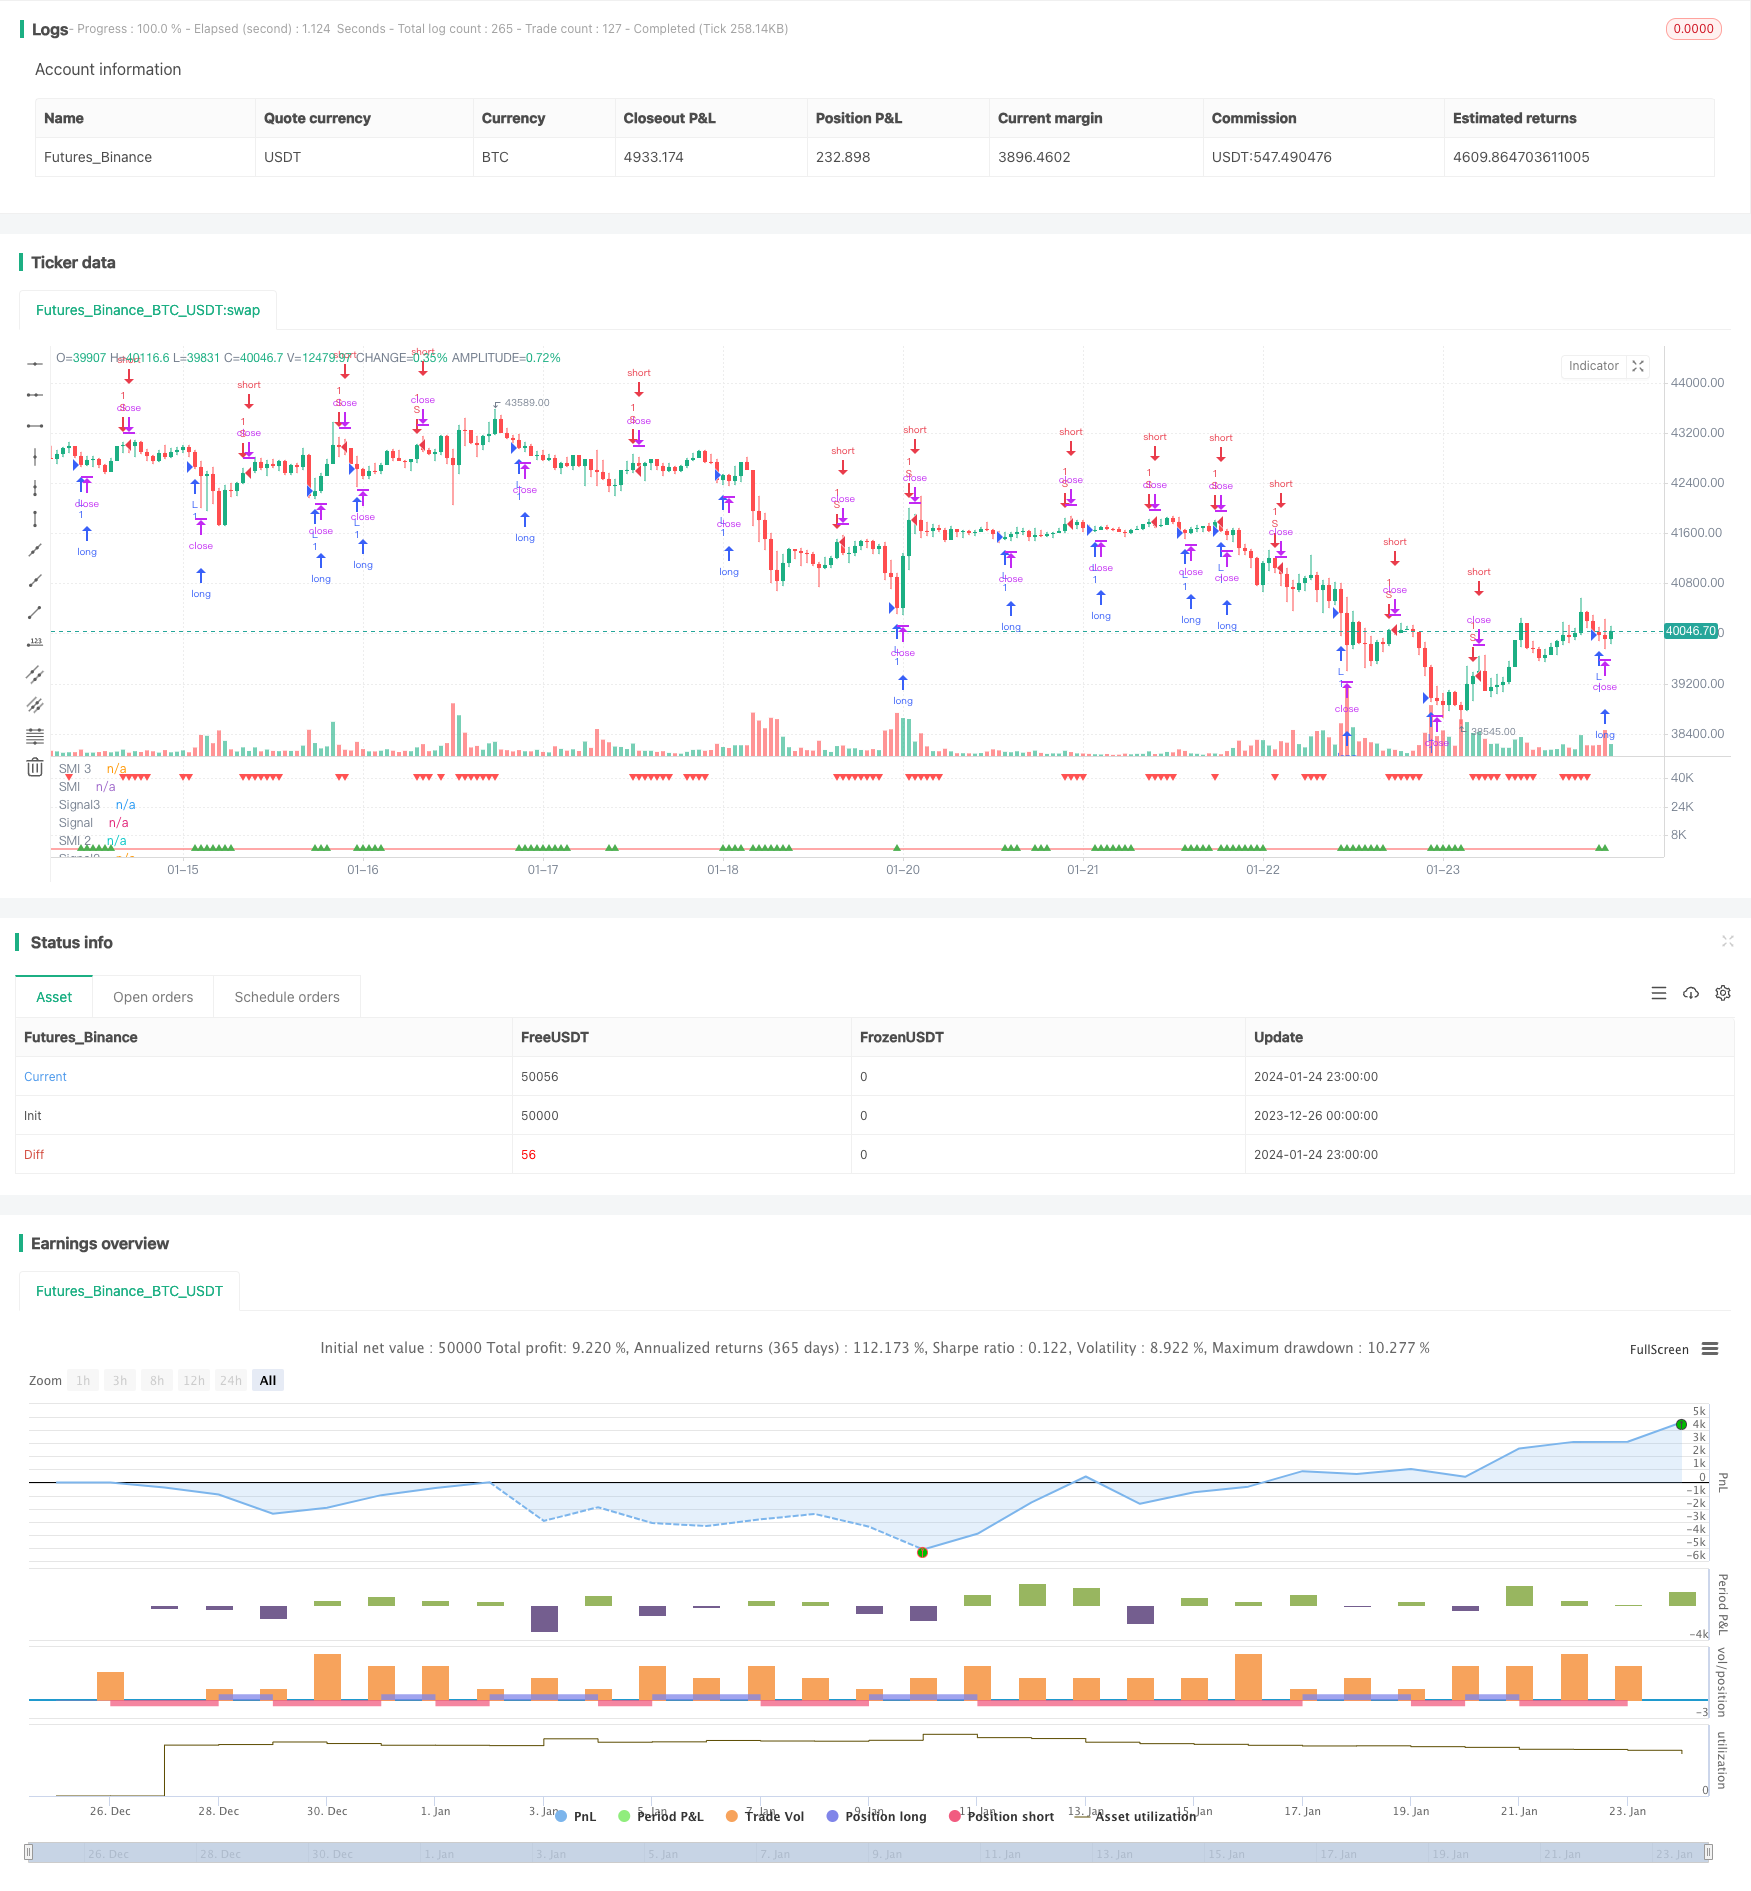
The Triple Overlapping Stochastic Momentum strategy is a typical short-term trading strategy. It calculates three Stochastic Momentum Index (SMI) indicators with different parameter settings and generates trading…
Overview
The Triple Overlapping Stochastic Momentum strategy is a typical short-term trading strategy. It calculates three Stochastic Momentum Index (SMI) indicators with different parameter settings and generates trading signals when all three show overbought or oversold conditions simultaneously. By combining multi-timeframe analysis, this strategy can effectively filter market noise and improve signal quality.
Strategy Logic
The core indicator of this strategy is the Stochastic Momentum Index (SMI). The SMI is calculated as follows:
SMI = 100 * EMA(EMA(Close - Midpoint of High-Low Range, N1), N2) / 0.5 * EMA(EMA(High - Low, N1), N2)
Where N1 and N2 are the parameter lengths. The SMI oscillates between -100 and 100. Values above 0 indicate the close is in the upper half of the daily range, while values below 0 indicate the close is in the lower half.
Similar to the traditional Stochastic Oscillator, overbought (e.g. 40)/oversold (e.g. -40) levels indicate potential reversal signals. Bullish and bearish signals are generated when the SMI crosses above/below its moving average line.
The strategy employs three SMI indicators with different parameter sets, specifically:
- SMI1: %K Period 10, %K Slowing Period 3
- SMI2: %K Period 20, %K Slowing Period 3
- SMI3: %K Period 5, %K Slowing Period 3
Trading signals are generated when all three SMIs concurrently show overbought or oversold conditions. This filters out false signals and improves reliability.
Advantages
- Multi-timeframe analysis for robust signals
- SMI enhances usability over traditional Stochastic
- Triple overlay improves reliability over single indicator
- Flexible parameters for optimization
- Well suited for short-term/high frequency trading
Risks
- Multiple indicators may lag signals
- High trading frequency increases costs
- Backtest overfitting
- Parameters may fail with market regime changes
Risk Mitigations:
- Optimize parameters to reduce lag
- Adjust holding period to lower trading costs
- Perform statistical testing to validate robustness
- Dynamically adapt parameters
Enhancements
- Test different SMI parameter combinations
- Add statistical metrics to evaluate parameter stability
- Incorporate supporting indicators like volume, Bollinger Bands etc.
- Dynamic parameter switching based on environment
- Optimize stop loss strategies
Conclusion
The Triple Overlapping Stochastic Momentum strategy combines robust signal generation across multiple timeframes by overlaying three SMI indicators with unique parameters. Compared to single oscillators, this multi-indicator approach filters more noise and improves consistency. Further refinements can be made going forward through parameter optimization, statistical validation, auxiliary indicators etc. to enhance strategy robustness.
Parameters
| Name | Default | What it controls |
|---|---|---|
| v_input_1 | 10 | %K Length |
| v_input_2 | 3 | %K Smoothing Length |
| v_input_3 | 3 | %K Double Smoothing Length |
| v_input_4 | 10 | Signal Length |
| v_input_5 | ema | Signal MA Type |
| v_input_6 | 40 | Overbought Level |
| v_input_7 | -40 | Oversold Level |
| v_input_8 | 20 | %K Length 2 |
| v_input_9 | 3 | %K Smoothing Length 2 |
| v_input_10 | 3 | %K Double Smoothing Length 2 |
| v_input_11 | 10 | Signal Length 2 |
| v_input_12 | ema | Signal MA Type 2 |
| v_input_13 | 40 | Overbought Level 2 |
| v_input_14 | -40 | Oversold Level 2 |
| v_input_15 | 5 | %K Length 3 |
| v_input_16 | 3 | %K Smoothing Length 3 |
| v_input_17 | 3 | %K Double Smoothing Length 3 |
| v_input_18 | 10 | Signal Length 3 |
| v_input_19 | ema | Signal MA Type 3 |
| v_input_20 | 40 | Overbought Level 3 |
| v_input_21 | -40 | Oversold Level 3 |
| v_input_22 | 8 | From Month |
| v_input_23 | true | From Day |
| v_input_24 | 2018 | From Year |
| v_input_25 | 12 | To Month |
| v_input_26 | 31 | To Day |
| v_input_27 | 2018 | To Year |
Source Pine Script
/*backtest
start: 2023-12-26 00:00:00
end: 2024-01-25 00:00:00
period: 1h
basePeriod: 15m
exchanges: [{"eid":"Futures_Binance","currency":"BTC_USDT"}]
*/

//@version=2
strategy("Stochastic Momentum multi strategy", "Stochastic Momentum Index multi strategy", overlay=false)

q = input(10, title="%K Length")
r = input(3, title="%K Smoothing Length")
s = input(3, title="%K Double Smoothing Length")
nsig = input(10, title="Signal Length")
matype = input("ema", title="Signal MA Type")  // possible: ema, sma, wma, trima, hma, dema, tema, zlema
overbought = input(40, title="Overbought Level", type=float)
oversold = input(-40, title="Oversold Level", type=float)

trima(src, length) => sma(sma(src,length),length)
hma(src, length) => wma(2*wma(src, length/2)-wma(src, length), round(sqrt(length)))
dema(src, length) => 2*ema(src,length) - ema(ema(src,length),length)
tema(src, length) => (3*ema(src,length) - 3*ema(ema(src,length),length)) + ema(ema(ema(src,length),length),length)
zlema(src, length) => ema(src,length) + (ema(src,length) - ema(ema(src,length),length))

smi = 100 * ema(ema(close-0.5*(highest(q)+lowest(q)),r),s) / (0.5 * ema(ema(highest(q)-lowest(q),r),s))
sig = matype=="ema" ? ema(smi,nsig) : matype=="sma" ? sma(smi,nsig) : matype=="wma" ? wma(smi,nsig) : matype=="trima" ? trima(smi,nsig) : matype=="hma" ? hma(smi,nsig) : matype=="dema" ? dema(smi,nsig) : matype=="tema" ? tema(smi,nsig) : matype=="zlema" ? zlema(smi,nsig) : ema(smi,nsig)

p_smi = plot(smi, title="SMI", color=aqua)
p_sig = plot(sig, title="Signal", color=red)

// plotchar(crossover(smi, sig), title= "low", location=location.bottom, color=green, char="▲", size= size.tiny)
// plotchar(crossunder(smi, sig), title= "high", location=location.top, color=red, char="▼", size= size.tiny)

/////////////////////////////2
q2 = input(20, title="%K Length 2")
r2 = input(3, title="%K Smoothing Length 2")
s2 = input(3, title="%K Double Smoothing Length 2")
nsig2 = input(10, title="Signal Length 2")
matype2 = input("ema", title="Signal MA Type 2")  // possible: ema, sma, wma, trima, hma, dema, tema, zlema
overbought2 = input(40, title="Overbought Level 2", type=float)
oversold2 = input(-40, title="Oversold Level 2", type=float)

trima2(src2, length2) => sma(sma(src2,length2),length2)
hma2(src2, length2) => wma(2*wma(src2, length2/2)-wma(src2, length2), round(sqrt(length2)))
dema2(src2, length2) => 2*ema(src2,length2) - ema(ema(src2,length2),length2)
tema2(src2, length2) => (3*ema(src2,length2) - 3*ema(ema(src2,length2),length2)) + ema(ema(ema(src2,length2),length2),length2)
zlema2(src2, length2) => ema(src2,length2) + (ema(src2,length2) - ema(ema(src2,length2),length2))

smi2 = 100 * ema(ema(close-0.5*(highest(q2)+lowest(q2)),r2),s2) / (0.5 * ema(ema(highest(q2)-lowest(q2),r2),s2))
sig2 = matype2=="ema" ? ema(smi2,nsig2) : matype2=="sma 2" ? sma(smi2,nsig2) : matype2=="wma 2" ? wma(smi2,nsig2) : matype2=="trima 2" ? trima2(smi2,nsig2) : matype2=="hma 2" ? hma2(smi2,nsig2) : matype=="dema 2" ? dema2(smi2,nsig2) : matype2=="tema 2" ? tema2(smi2,nsig2) : matype2=="zlema 2" ? zlema2(smi2,nsig2) : ema(smi2,nsig2)

p_smi2 = plot(smi2, title="SMI 2", color=aqua)
p_sig2 = plot(sig2, title="Signal2", color=red)

// plotchar(crossover(smi2, sig2), title= "low2", location=location.bottom, color=green, char="▲", size= size.tiny)
// plotchar(crossunder(smi2, sig2), title= "high2", location=location.top, color=red, char="▼", size= size.tiny)

/////////////////////////////3
q3 = input(5, title="%K Length 3")
r3 = input(3, title="%K Smoothing Length 3")
s3 = input(3, title="%K Double Smoothing Length 3")
nsig3 = input(10, title="Signal Length 3")
matype3 = input("ema", title="Signal MA Type 3")  // possible: ema, sma, wma, trima, hma, dema, tema, zlema
overbought3 = input(40, title="Overbought Level 3", type=float)
oversold3 = input(-40, title="Oversold Level 3", type=float)

trima3(src3, length3) => sma(sma(src3,length3),length3)
hma3(src3, length3) => wma(2*wma(src3, length3/2)-wma(src3, length3), round(sqrt(length3)))
dema3(src3, length3) => 2*ema(src3,length3) - ema(ema(src3,length3),length3)
tema3(src3, length3) => (3*ema(src3,length3) - 3*ema(ema(src3,length3),length3)) + ema(ema(ema(src3,length3),length3),length3)
zlema3(src3, length3) => ema(src3,length3) + (ema(src3,length3) - ema(ema(src3,length3),length3))

smi3 = 100 * ema(ema(close-0.5*(highest(q3)+lowest(q3)),r3),s3) / (0.5 * ema(ema(highest(q3)-lowest(q3),r3),s3))
sig3 = matype3=="ema" ? ema(smi3,nsig3) : matype3=="sma 3" ? sma(smi3,nsig3) : matype3=="wma 3" ? wma(smi3,nsig3) : matype3=="trima 3" ? trima3(smi3,nsig3) : matype3=="hma 3" ? hma3(smi3,nsig3) : matype=="dema 3" ? dema3(smi3,nsig3) : matype3=="tema 3" ? tema3(smi3,nsig3) : matype3=="zlema 3" ? zlema3(smi3,nsig3) : ema(smi3,nsig3)

p_smi3 = plot(smi3, title="SMI 3", color=aqua)
p_sig3 = plot(sig3, title="Signal3", color=red)

// plotchar(crossover(smi3, sig3) and crossover(smi2, sig2) and crossover(smi, sig), title= "low3", location=location.bottom, color=green, char="▲", size= size.tiny)
// plotchar(crossunder(smi3, sig3) and crossunder(smi2, sig2) and crossunder(smi, sig), title= "high3", location=location.top, color=red, char="▼", size= size.tiny)
plotchar (((smi3 < sig3) and (smi2 < sig2) and (smi < sig)), title= "low3", location=location.bottom, color=green, char="▲", size= size.tiny)
plotchar (((smi3 > sig3) and (smi2 > sig2) and (smi > sig)), title= "high3", location=location.top, color=red, char="▼", size= size.tiny)

// === BACKTEST RANGE ===
FromMonth = input(defval = 8, title = "From Month", minval = 1, maxval = 12)
FromDay   = input(defval = 1, title = "From Day", minval = 1, maxval = 31)
FromYear  = input(defval = 2018, title = "From Year", minval = 2014)
ToMonth   = input(defval = 12, title = "To Month", minval = 1, maxval = 12)
ToDay     = input(defval = 31, title = "To Day", minval = 1, maxval = 31)
ToYear    = input(defval = 2018, title = "To Year", minval = 2014)

longCondition = ((smi3 < sig3) and (smi2 < sig2) and (smi < sig))
shortCondition = ((smi3 > sig3) and (smi2 > sig2) and (smi > sig))

// buy = longCondition == 1 and longCondition[1] == 1 ? longCondition : na
buy = longCondition == 1 ? longCondition : na
sell = shortCondition == 1? shortCondition : na

// === ALERTS ===
strategy.entry("L", strategy.long, when=buy)

strategy.entry("S", strategy.short, when=sell)

alertcondition(((smi3 < sig3) and (smi2 < sig2) and (smi < sig)), title='Low Fib.', message='Low Fib. Buy')
alertcondition(((smi3 > sig3) and (smi2 > sig2) and (smi > sig)), title='High Fib.', message='High Fib. Low')
Published by ChaoZhang on the FMZ strategy square · last modified 2024-01-26. Collected in the Quant Trading Vault. Unvalidated research: re-test with your own data and costs before trusting it.
Build this with AgenKit
A spec is not a trading system. Paste this into your coding agent and AgenKit runs a specialist team — architecture, test-first build, risk gates, review — with paper trading on by default.
/agenkit build a production-grade trading bot with a backtest engine, risk controls and paper trading by default from strategies/Triple-Overlapping-Stochastic-Momentum-Strategy.md- npx agenkit install engineering-kit in your project
- Paste the command into your agent and approve each phase
- Get tests, backtest, risk controls and a paper-trading switch
Understand it first
Before you run this, read the lesson behind the idea and how to backtest it honestly. Specs like this one are the survivors of an unknown number of trials; deflate their results accordingly.
Related specs
- Multi Indicator Comprehensive Analysis Quantitative Trading Strategy Trend Momentum and Volatility Collaborative Prediction ModelPine Script · Momentum · 3m
- Momentum Indicator Aggregation Trading StrategyPine Script · Momentum · 1h
- Multi Indicator Trend Momentum Trading Strategy An Optimized Quantitative Trading System Based on Bollinger Bands Fibonacci and ATRPine Script · Momentum · 1h
- Momentum Trading Strategy Based on Multi factor ModelPine Script · Momentum · 1d
- Momentum Trend Following Oscillation StrategyPine Script · Momentum · 1h
- Multi factor Fusion Strategy Multi factor Fusion StrategyPine Script · Momentum · 3h