Strategy vault / Mean reversion
Triple SMA Auto Tracking Strategy
The Triple SMA strategy is a trend-following strategy based on three simple moving averages (SMA) of different periods for trend identification and entries. It can automatically track trends and add positions during…
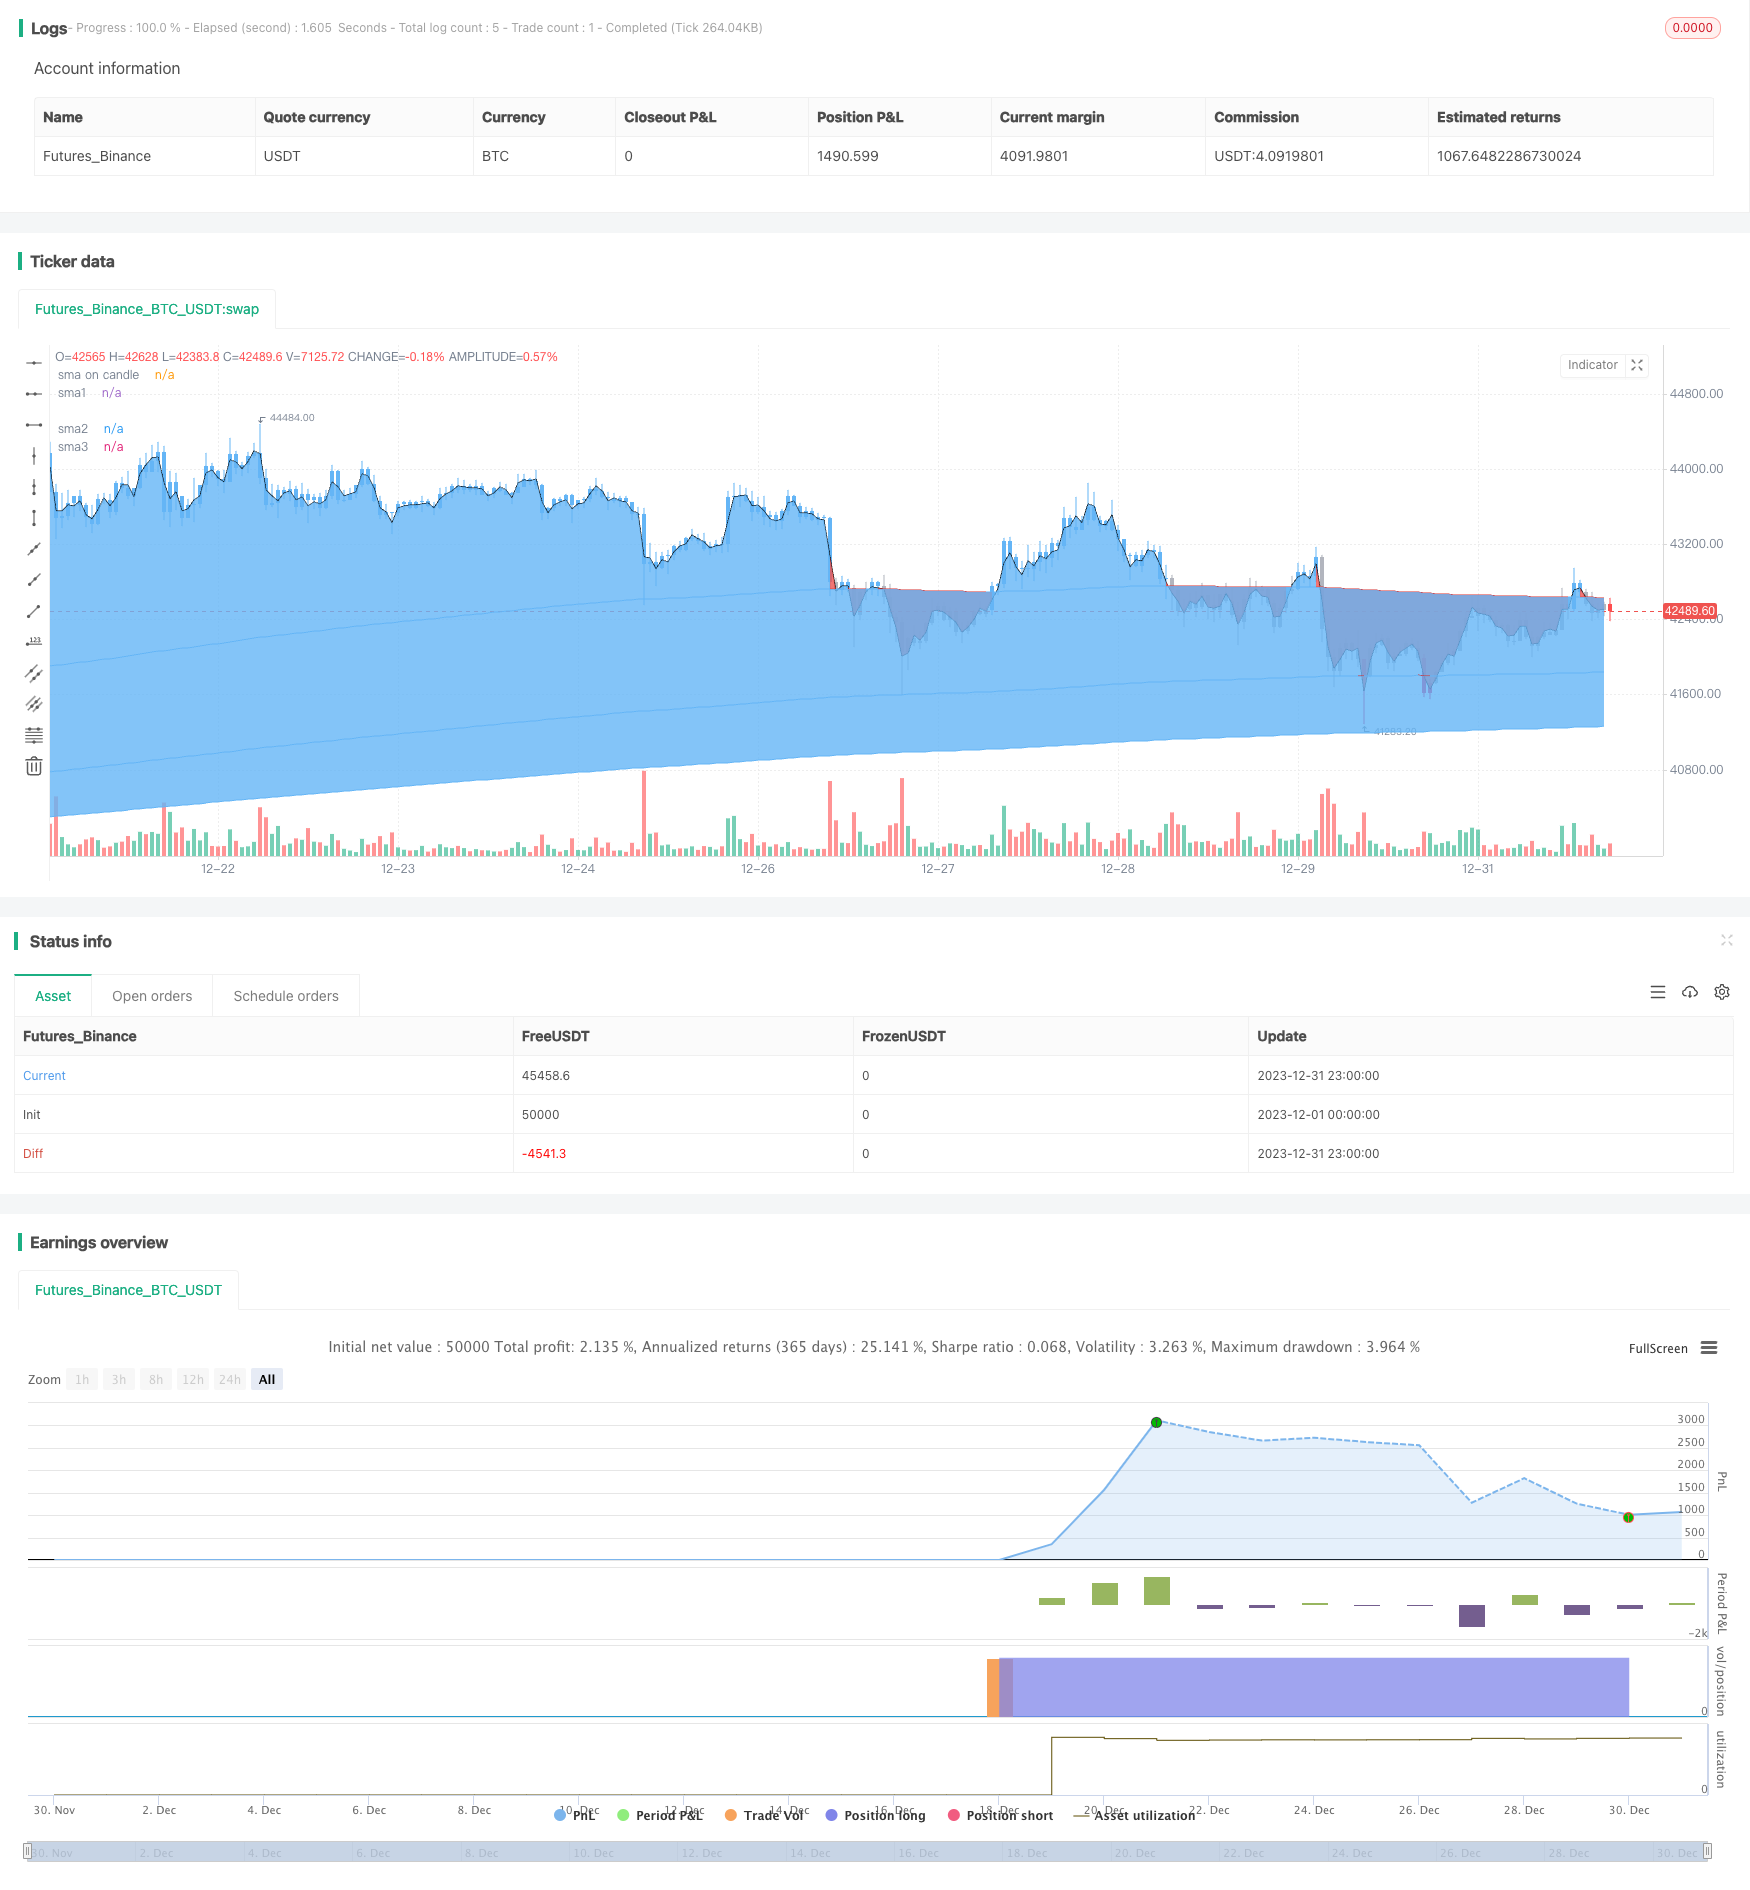
Overview
The Triple SMA strategy is a trend-following strategy based on three simple moving averages (SMA) of different periods for trend identification and entries. It can automatically track trends and add positions during pullbacks in trends.
Strategy Logic
The strategy uses three SMAs of different periods as the main trend indicator, including 200-, 400-, and 600-period SMAs. When price is above all three SMAs, it indicates an upward trend, and vice versa for downtrend.
For entries, the strategy combines the use of close price and StochClose oscillator. Signals are generated only when price aligns with the triple SMAs' direction. StochClose identifies overbought/oversold levels and gives long signal when crossing above 95 and short signal when crossing below 5.
The stop loss is set to price crossing below the slowest SMA.
The strategy allows pyramiding up to 10 times. Three take profit levels are built-in at 1%, 2% and 6% profits.
Advantage Analysis
The biggest advantage of the Triple SMA strategy is that by combining three SMAs of different periods, it can better identify trend direction and strength. It has stronger capabilities of filtering out false signals than single SMA strategies.
Additionally, incorporating StochClose for overbought/oversold analysis avoids taking signals around potential trend reversal points.
The stop loss based on the slowest SMA also maximizes the strategy's capability of riding trends while minimizing premature stop outs.
Allowing pyramiding enables the strategy to continously participate in trends.
Risk Analysis
The main risk of this strategy is that the triple SMAs may not completely filter out all false signals. If price fails to form a trend after breaking through the SMAs and pulls back soon, losses can occur. This often happens around major support/resistance levels.
Also, StochClose itself may generate incorrect signals, leading to inappropriate entries, especially in ranging markets.
To mitigate these risks, parameters like SMA periods can be adjusted. More indicators can be added, like KDJ and MACD, to improve signal quality.
Optimization Directions
The strategy can be optimized in the following aspects:
Add/tune SMA periods to find optimal values fitting specific products
Add additional indicators like KDJ and MACD for combo filtering and better entries
Optimize stop loss and take profit standards to better fit market volatility ranges
Optimize pyramiding settings to find ideal pyramiding strategies
Test across different products and make parameters adaptive to more products
Conclusion
In conclusion, the Triple SMA strategy is a very practical trend-following approach. By combining triple SMAs and StochClose, it achieves solid trend identification and avoids false signals. Allowing pyramiding also enables tracking trends. With parameter tuning and optimizations, it can become a powerful trend tracker.
Parameters
| Name | Default | What it controls |
|---|---|---|
| v_input_1 | 200 | sma 1 length |
| v_input_2 | 400 | sma 2 length |
| v_input_3 | 600 | sma 3 length |
| v_input_4_close | 0 | Source: close | high | low | open | hl2 | hlc3 | hlcc4 | ohlc4 |
| v_input_5 | 50 | length for the oscillator |
| v_input_6 | 5 | oscillator smoothing |
| v_input_7 | 95 | signal when oscillator crosses above |
| v_input_8 | 5 | signal when oscillator crosses below |
| v_input_9 | 2500 | max orders filled on a day |
| v_input_10 | true | take profit level 1 |
| v_input_11 | 2 | take profit level 2 |
| v_input_12 | 6 | take profit level 3 |
| v_input_13 | 30 | take profit quantity first |
| v_input_14 | 30 | take profit quantity second |
| v_input_15 | 30 | take profit quantity third |
Source Pine Script
/*backtest
start: 2023-12-01 00:00:00
end: 2023-12-31 23:59:59
period: 1h
basePeriod: 15m
exchanges: [{"eid":"Futures_Binance","currency":"BTC_USDT"}]
*/

//@version=4
strategy(title="Tripla Sma with entries based on sma price closes ", shorttitle="TRIPLE SMA STRATEGY", overlay=true) ////resolution=""
len = input(200, minval=1, title="sma 1 length")
len1 = input(400, minval=1, title="sma 2 length")
len2 = input(600, minval=1, title="sma 3 length")
src = input(close, title="Source")
////////////////////////////////////////////
smma = 0.0
smma := na(smma[1]) ? sma(src, len) : (smma[1] * (len - 1) + src) / len

up = smma > smma [1]
down =smma < smma[1]
mycolor = up ? #64b5f6 : down ? #d32f2f : na
fastma = sma(hl2, 1)

fastplot = plot(fastma, color=#000000, transp=100, title='sma on candle')
slowplot = plot(smma, color=mycolor, transp=55, title='sma1')

////////////////////////////////////////////
smma1 = 0.0
smma1 := na(smma1[1]) ? sma(src, len1) : (smma1[1] * (len1 - 1) + src) / len1

up2 = smma1 > smma1 [1]
down2 =smma1 < smma1[1]

mycolor2 = up2 ? #64b5f6 : down2 ? #d32f2f : na
slowplot2 = plot(smma1, color=mycolor2, transp=45, title='sma2')

////////////////////////////////////////////
smma2 = 0.0
smma2 := na(smma2[1]) ? sma(src, len2) : (smma2[1] * (len2 - 1) + src) / len2

up3 = smma2 > smma2 [1]
down3 =smma2 < smma2[1]

mycolor3 = up3 ? #64b5f6 : down3 ? #d32f2f : na
slowplot3 = plot(smma2, color=mycolor3, transp=35, title='sma3')

////////////////////////////////////////////////////////////////////////////////////////
//Fill gaps
fillData = smma > fastma
fillData2 = smma < fastma

fillDtat = smma1 > smma
fillDtat2 = smma1 < smma

fillDat = smma2 > smma1
fillDat2 = smma2 < smma1


fillCol1 = fillData ? #ef5350 : fillData2 ? #64b5f6 : na
fillCol2 = fillDtat ? #ef5350 : fillDtat2 ? #64b5f6 : na
fillCol3 = fillDat ? #ef5350 : fillDat2 ? #64b5f6 : na


fill(slowplot, fastplot, color=fillCol1, transp=90, title="sma1 fill")
fill(slowplot, slowplot2, color=fillCol2, transp=80, title="sma2 fill")
fill(slowplot2, slowplot3, color=fillCol3, transp=60, title="sma3 fill")

uc = (close > smma) and (close > smma1)
dc = (close < smma) and (close < smma1)

barColor = uc ? #64b5f6 : dc ? #e91e63 : #b2b5be
barcolor(color=barColor)
////////////////////////////////////////////////////////////////////////////////////////////////////////////////////////////////////////////////////////////////////////////////
//StochClose from @trendinvestpro
periods = input(50, minval=1, title="length for the oscillator")
smooth = input(5, minval=1, title="oscillator smoothing")
hhc=highest(close,periods)
llc=lowest(close,periods)
StochClose = sma((close-llc)/(hhc-llc)*100, smooth)

shortline = input(95, minval=0, title="signal when oscillator crosses above")
longline = input(5, minval=0, title="signal when oscillator crosses below")

////////////////////////////////////////////////////////////////////////////////////////////////////////////////////////////////////////////////////////////////////////////////
longs = close > smma2
shorts = close < smma2


long = longs == true and crossunder(StochClose, longline)
short = shorts == true and crossover(StochClose, shortline)

stoplong = close < smma and close < smma1 and close < smma2
stopshort = close > smma and close > smma1 and close > smma2

p1 = strategy.position_avg_price / 100 / syminfo.mintick

maxx = input(2500, title="max orders filled on a day", minval=0)
takeprofit1 = input(1, title="take profit level 1", minval=0)
takeprofit2 = input(2, title="take profit level 2", minval=0)
takeprofit3 = input(6, title="take profit level 3", minval=0)

takeprofitqt1 = input(30, title="take profit quantity first", minval=0)
takeprofitqt2 = input(30, title="take profit quantity second", minval=0)
takeprofitqt3 = input(30, title="take profit quantity third", minval=0)
//////////////////////////////////////////////////////////////////////////////////////////////////////////////////////////////////////////////////////////////////////////////////
/////////////////////////////////////////////////////////////////////////////////////////Strategy entries/////////////////////////////////////////////////////////////////////////////////////////
// strategy.risk.max_intraday_filled_orders(maxx)
strategy.entry("long", strategy.long, when=long)
strategy.exit("tpl1", "long", qty_percent = takeprofitqt1, profit = takeprofit1 * p1)
strategy.exit("tpl2", "long", qty_percent = takeprofitqt2, profit = takeprofit2 * p1)
strategy.exit("tpl3", "long", qty_percent = takeprofitqt3, profit = takeprofit3 * p1)
strategy.close("long", when=stoplong == true)


strategy.entry("short", strategy.short, when=short)
strategy.exit("tpl1", "short", qty_percent = takeprofitqt1, profit = takeprofit1 * p1)
strategy.exit("tpl2", "short", qty_percent = takeprofitqt2, profit = takeprofit2 * p1)
strategy.exit("tpl3", "short", qty_percent = takeprofitqt3, profit = takeprofit3 * p1)
strategy.close("short", when=stopshort == true)
Published by ChaoZhang on the FMZ strategy square · last modified 2024-01-26. Collected in the Quant Trading Vault. Unvalidated research: re-test with your own data and costs before trusting it.
Build this with AgenKit
A spec is not a trading system. Paste this into your coding agent and AgenKit runs a specialist team — architecture, test-first build, risk gates, review — with paper trading on by default.
/agenkit build a production-grade trading bot with a backtest engine, risk controls and paper trading by default from strategies/Triple-SMA-Auto-Tracking-Strategy.md- npx agenkit install engineering-kit in your project
- Paste the command into your agent and approve each phase
- Get tests, backtest, risk controls and a paper-trading switch
Understand it first
Before you run this, read the lesson behind the idea and how to backtest it honestly. Specs like this one are the survivors of an unknown number of trials; deflate their results accordingly.
Related specs
- Trend Reversal Momentum Indicators Crossover Tracking StrategyPine Script · Mean reversion · 1h
- Multi Timeframe Gold Reversal Tracking StrategyPine Script · Mean reversion · 2h
- MACD RSI and EMA StrategyPine Script · Mean reversion · 1d
- Mean Reversion Trading Strategy Based on Bollinger Bands and Golden RatioPine Script · Mean reversion · 1h
- RSI Indicator Long Short Separation Trading StrategyPine Script · Mean reversion · 3h
- scillator Profile Reversal Strategy Based on Multi Timeframe MACD Zero crossingPine Script · Mean reversion · 1d