Strategy vault / Trend following
Triple Supertrend Ichimoku Cloud Quantitative Trading Strategy
This strategy is a quantitative trading strategy that combines triple supertrend indicator, Ichimoku cloud indicator, average true range (ATR) indicator and exponential moving average (EMA). It uses triple supertrend…
Summary
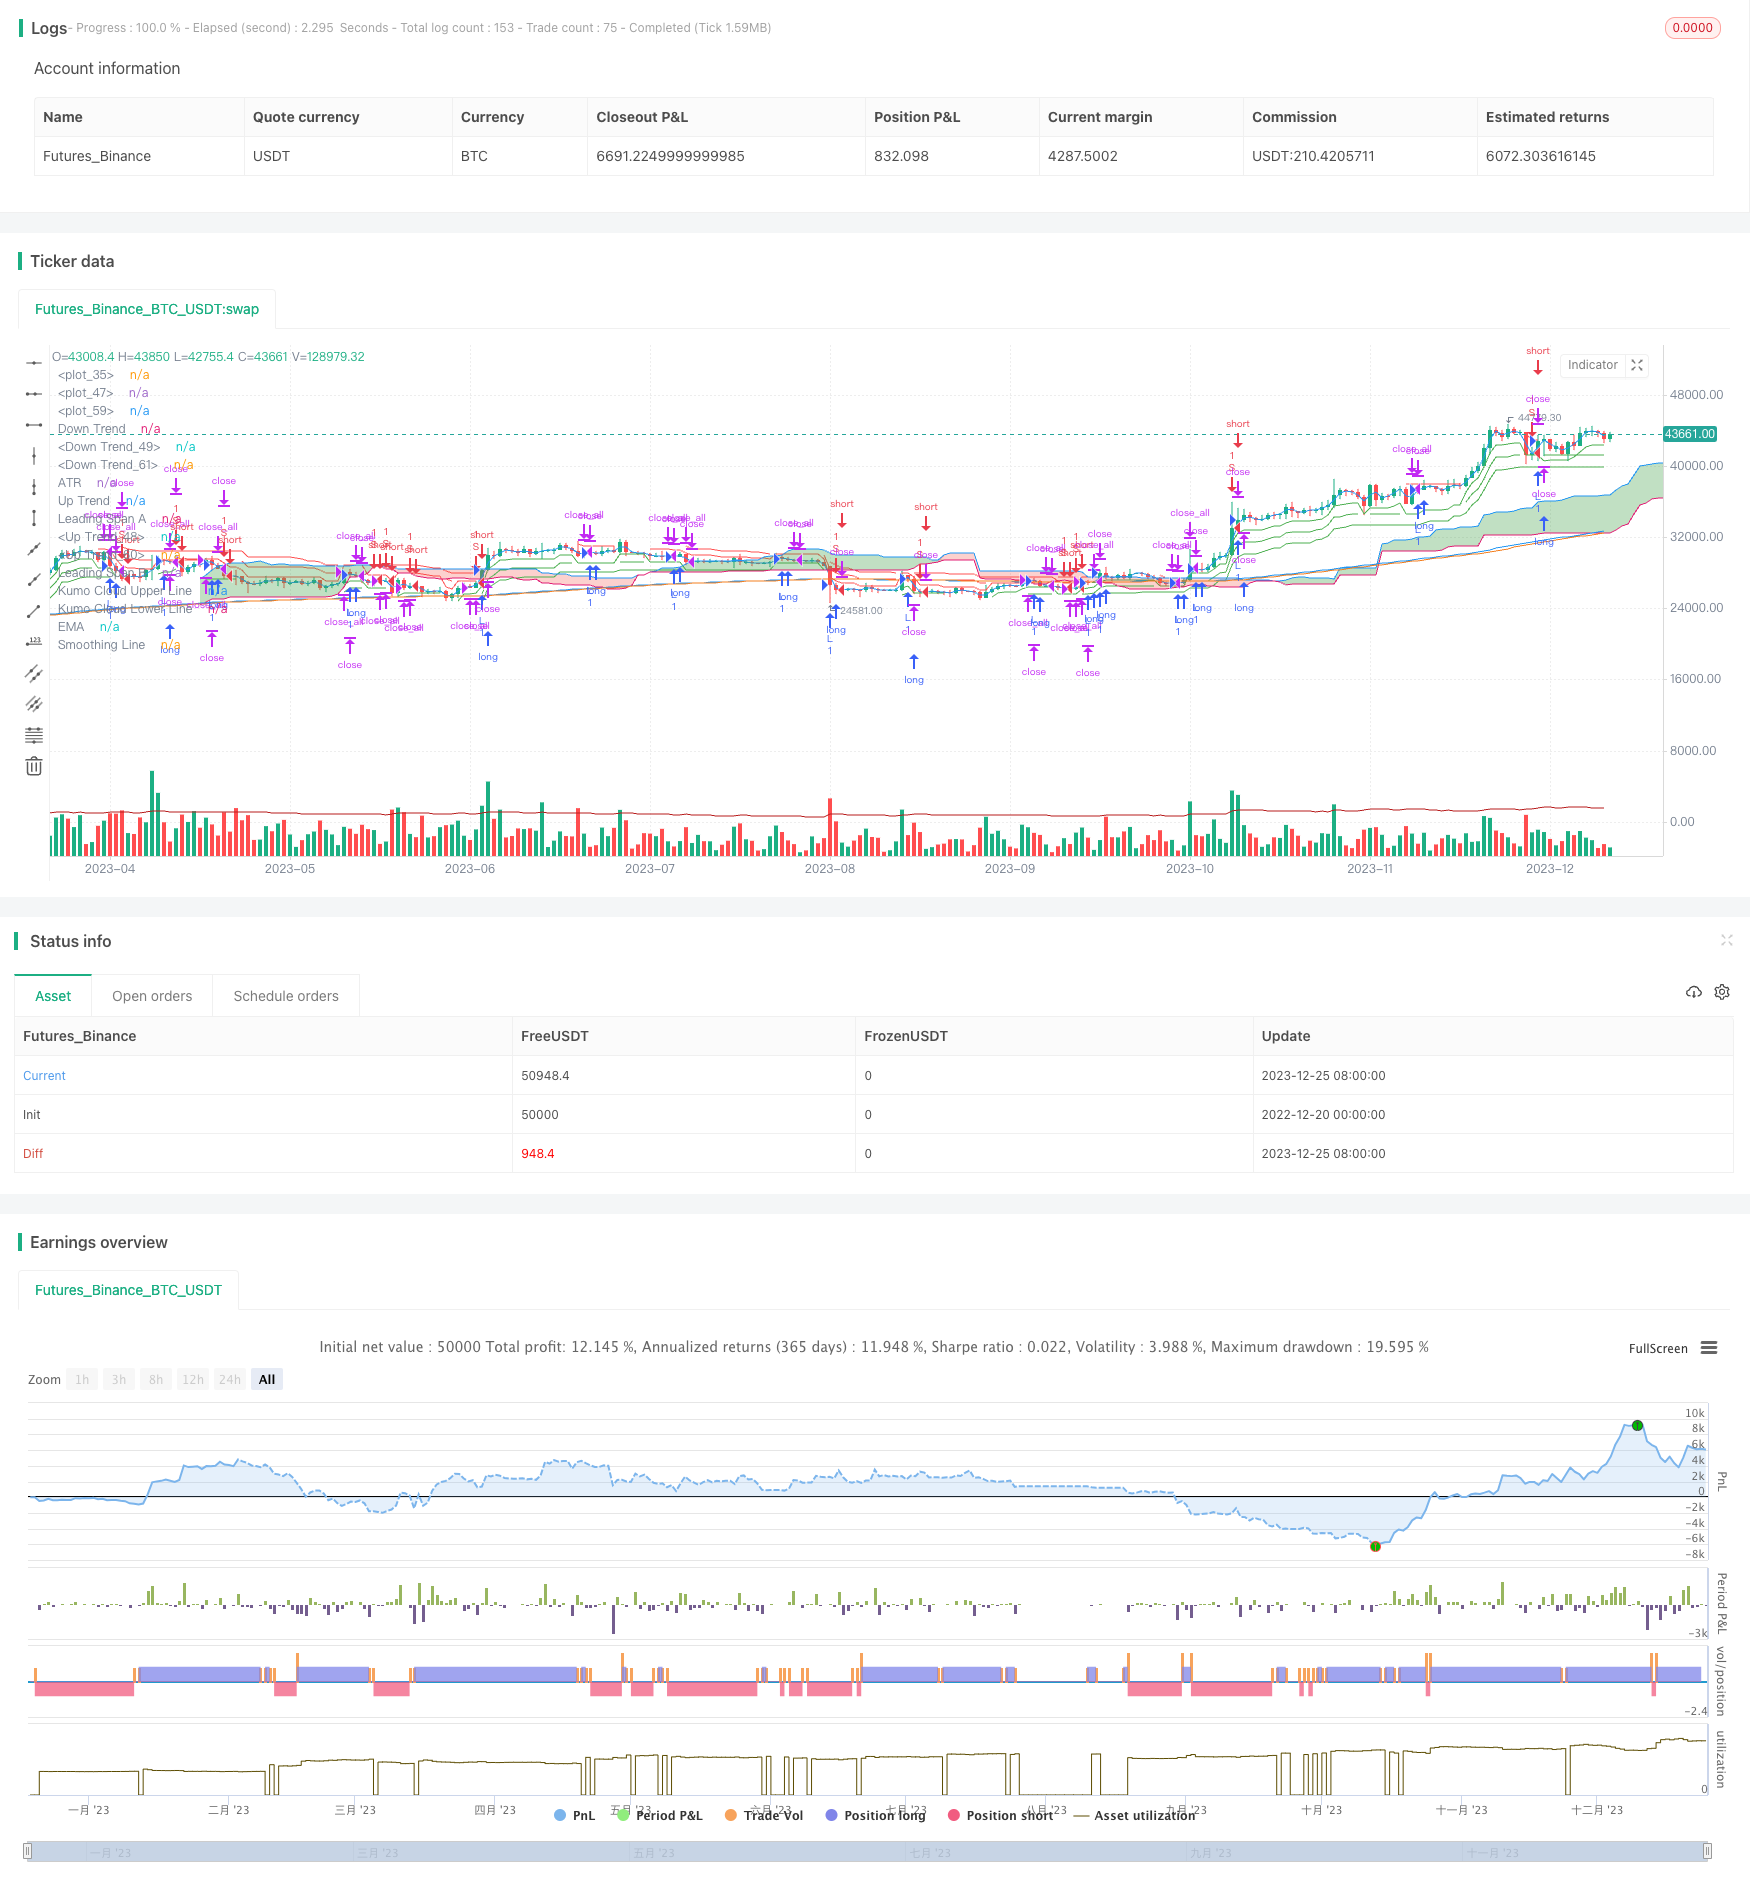
This strategy is a quantitative trading strategy that combines triple supertrend indicator, Ichimoku cloud indicator, average true range (ATR) indicator and exponential moving average (EMA). It uses triple supertrend to determine market trend, Ichimoku cloud for support and resistance, ATR for stop loss, EMA for trend confirmation to form a relatively complete trading system.
Strategy Principle
The core logic of this strategy is based on the triple supertrend indicator. The supertrend indicator determines the trend direction by comparing the price with the average true range within a certain period. When the price is above the upper band, it is a bullish signal, and when the price is below the lower band, it is a bearish signal. This strategy adopts three supertrend indicators with different parameters. Trading signals are generated when all three give buy or sell signals at the same time.
In addition, the Ichimoku cloud thickness helps determine the strength of the current trend to filter out some false signals. The ATR indicator is used to set the stop loss. The EMA indicator confirms the intermediate and long term trends.
Specifically, go long when the price is above the upper band of all three supertrend indicators, and go short when below the lower band of all three. Also require the price to be above or below the Ichimoku cloud to filter uncertain signals. The stop loss is set to entry price minus the ATR value for a dynamic trailing stop.
Advantages
The triple supertrend indicators with different settings can effectively filter market noise and determine trend direction more accurately.
Ichimoku cloud determines trend strength to avoid false breakouts. ATR stop loss setting is reasonable to avoid huge losses to the maximum extent.
EMA assists in confirming intermediate and long term trend direction, verifying signals from supertrend, further improving reliability.
Combining multiple indicators, the signals are more reliable as they can verify each other when determining market trend.
Risks
Although Ichimoku cloud is added, there is still risk of entering invalid zone if cloud thickness is penetrated. The ATR would cap losses to some extent.
When volatility is high, stop loss set by ATR could be triggered directly, thus increasing loss rate. Parameters can be adjusted or stop loss range increased.
Invalid signals may occur frequently if supertrend parameters are set inappropriately. A lot of backtests are needed to find optimum combination.
Enhancement
More indicators like volatility index, Bollinger Bands can be added to assist filtering signals and improve reliability.
Improve ATR calculation to dynamically adjust stop loss range during huge swings to lower loss rate.
Add machine learning model trained on historical data to judge trading signals instead of manual parameter setting. Signal accuracy can be improved.
Conclusion
This strategy combines four parts including triple supertrend, Ichimoku cloud, ATR and EMA. Signals are verified across indicators when determining market trend. Ichimoku cloud and ATR stop loss control risk. EMA confirms intermediate and long term trend. Signals from this strategy is relatively reliable for intermediate to long term holding. Stop loss can be further optimized and more assisting indicators can be added to obtain better strategy performance.
Parameters
| Name | Default | What it controls |
|---|---|---|
| v_input_int_1 | 2 | percent of portfo per order |
| v_input_int_2 | 9 | (?ichimoku)Conversion Line Length |
| v_input_int_3 | 26 | Base Line Length |
| v_input_int_4 | 52 | Leading Span B Length |
| v_input_int_5 | 26 | Lagging Span |
| v_input_1 | 10 | (?SuperTrend)ATR Length1 |
| v_input_float_1 | true | Factor1 |
| v_input_2 | 11 | ATR Length2 |
| v_input_float_2 | 2 | Factor2 |
| v_input_3 | 12 | ATR Length2 |
| v_input_float_3 | 3 | Factor2 |
| v_input_int_6 | 14 | (?ATR)Length (ATR) |
| v_input_string_1 | 0 | Smoothing (ATR): RMA | SMA | EMA | WMA |
| v_input_int_7 | 200 | (?EMA)Length of EMA |
| v_input_4_close | 0 | Source of EMA: close | high | low | open | hl2 | hlc3 | hlcc4 | ohlc4 |
| v_input_int_8 | false | Offset (EMA) |
| v_input_string_2 | 0 | Method (EMA): SMA | EMA | SMMA (RMA) | WMA | VWMA |
| v_input_int_9 | 5 | Smoothing Length (EMA) |
Source Pine Script
/*backtest
start: 2022-12-20 00:00:00
end: 2023-12-26 00:00:00
period: 1d
basePeriod: 1h
exchanges: [{"eid":"Futures_Binance","currency":"BTC_USDT"}]
*/

//@version=5
strategy(title="HyperTrend", shorttitle="HyperTrend", overlay=true )

//
float percent_of_portfo = input.int(2, title = "percent of portfo per order", minval = 0, maxval = 100) / 100

// ichimoku Cloud
conversionPeriods = input.int(9, minval=1, title="Conversion Line Length", group = "ichimoku")
basePeriods = input.int(26, minval=1, title="Base Line Length", group = "ichimoku")
laggingSpan2Periods = input.int(52, minval=1, title="Leading Span B Length", group = "ichimoku")
displacement = input.int(26, minval=1, title="Lagging Span", group = "ichimoku")
donchian(len) => math.avg(ta.lowest(len), ta.highest(len))
conversionLine = donchian(conversionPeriods)
baseLine = donchian(basePeriods)
leadLine1 = math.avg(conversionLine, baseLine)
leadLine2 = donchian(laggingSpan2Periods)
p1 = plot(leadLine1, offset = displacement - 1, color=#A5D6A7,
	 title="Leading Span A", display = display.none)
p2 = plot(leadLine2, offset = displacement - 1, color=#ef9a9a,
	 title="Leading Span B", display = display.none)
plot(leadLine1 > leadLine2 ? leadLine1 : leadLine2, offset = displacement - 1, title = "Kumo Cloud Upper Line", display = display.none)
plot(leadLine1 < leadLine2 ? leadLine1 : leadLine2, offset = displacement - 1, title = "Kumo Cloud Lower Line", display = display.none)
fill(p1, p2, color = leadLine1 > leadLine2 ? color.rgb(67, 160, 72, 59) : color.rgb(244, 67, 54, 70))


// three supertrend

//1
atrPeriod1 = input(10, "ATR Length1", group="SuperTrend")
factor1 = input.float(1.0, "Factor1", step = 0.01, group="SuperTrend")

[supertrend1, direction1] = ta.supertrend(factor1, atrPeriod1)
supertrend1 := barstate.isfirst ? na : supertrend1

bodyMiddle1 = plot(barstate.isfirst ? na : (open + close) / 2, display = display.none)
upTrend1 =    plot(direction1 < 0 ? supertrend1 : na, "Up Trend",   color = color.green, style = plot.style_linebr)
downTrend1 =  plot(direction1 < 0 ? na : supertrend1, "Down Trend", color = color.red,   style = plot.style_linebr)


//2
atrPeriod2 = input(11, "ATR Length2", group="SuperTrend")
factor2 = input.float(2.0, "Factor2", step = 0.01, group="SuperTrend")

[supertrend2, direction2] = ta.supertrend(factor2, atrPeriod2)
supertrend2 := barstate.isfirst ? na : supertrend2

bodyMiddle2 = plot(barstate.isfirst ? na : (open + close) / 2, display = display.none)
upTrend2 =    plot(direction2 < 0 ? supertrend2 : na, "Up Trend",   color = color.green, style = plot.style_linebr)
downTrend2 =  plot(direction2 < 0 ? na : supertrend2, "Down Trend", color = color.red,   style = plot.style_linebr)


//3
atrPeriod3 = input(12, "ATR Length2", group="SuperTrend")
factor3 = input.float(3.0, "Factor2", step = 0.01, group="SuperTrend")

[supertrend3, direction3] = ta.supertrend(factor3, atrPeriod3)
supertrend3 := barstate.isfirst ? na : supertrend3

bodyMiddle3 = plot(barstate.isfirst ? na : (open + close) / 2, display = display.none)
upTrend3 =    plot(direction3 < 0 ? supertrend3 : na, "Up Trend",   color = color.green, style = plot.style_linebr)
downTrend3 =  plot(direction3 < 0 ? na : supertrend3, "Down Trend", color = color.red,   style = plot.style_linebr)


// ATR
lengthATR = input.int(title="Length (ATR)", defval=14, minval=1, group="ATR")
smoothingATR = input.string(title="Smoothing (ATR)", defval="RMA", options=["RMA", "SMA", "EMA", "WMA"], group="ATR")
ma_function(sourceATR, lengthATR) =>
	switch smoothingATR
		"RMA" => ta.rma(sourceATR, lengthATR)
		"SMA" => ta.sma(sourceATR, lengthATR)
		"EMA" => ta.ema(sourceATR, lengthATR)
		=> ta.wma(sourceATR, lengthATR)
ATR = ma_function(ta.tr(true), lengthATR)
plot(ATR, title = "ATR", color=color.new(#B71C1C, 0), display = display.none)

// EMA
lenEMA = input.int(200, minval=1, title="Length of EMA", group="EMA")
srcEMA = input(close, title="Source of EMA", group="EMA")
offset = input.int(title="Offset (EMA)", defval=0, minval=-500, maxval=500, group="EMA")
outEMA = ta.ema(srcEMA, lenEMA)
plot(outEMA, title="EMA", color=color.blue, offset=offset, display = display.none)

ma(sourceEMA, lengthEMA, type) =>
    switch type
        "SMA" => ta.sma(sourceEMA, lengthEMA)
        "EMA" => ta.ema(sourceEMA, lengthEMA)
        "SMMA (RMA)" => ta.rma(sourceEMA, lengthEMA)
        "WMA" => ta.wma(sourceEMA, lengthEMA)
        "VWMA" => ta.vwma(sourceEMA, lengthEMA)

typeMA = input.string(title = "Method (EMA)", defval = "SMA", options=["SMA", "EMA", "SMMA (RMA)", "WMA", "VWMA"], group="EMA")
smoothingLengthEMA = input.int(title = "Smoothing Length (EMA)", defval = 5, minval = 1, maxval = 100, group="EMA")

smoothingLine = ma(outEMA, smoothingLengthEMA, typeMA)
plot(smoothingLine, title="Smoothing Line", color=#f37f20, offset=offset, display=display.none)


//logic


if (open + ATR > supertrend1) and (open + ATR > supertrend2) and (open + ATR > supertrend3)
	strategy.entry("L", strategy.long)
else if (open < supertrend1 + ATR) and (open < supertrend2 + ATR) and (open < supertrend3 + ATR)
	strategy.entry("S", strategy.short)
else
strategy.close_all("C")Published by ChaoZhang on the FMZ strategy square · last modified 2023-12-27. Collected in the Quant Trading Vault. Unvalidated research: re-test with your own data and costs before trusting it.
Build this with AgenKit
A spec is not a trading system. Paste this into your coding agent and AgenKit runs a specialist team — architecture, test-first build, risk gates, review — with paper trading on by default.
/agenkit build a production-grade trading bot with a backtest engine, risk controls and paper trading by default from strategies/Triple-Supertrend-Ichimoku-Cloud-Quantitative-Trading-Strategy.md- npx agenkit install engineering-kit in your project
- Paste the command into your agent and approve each phase
- Get tests, backtest, risk controls and a paper-trading switch
Understand it first
Before you run this, read the lesson behind the idea and how to backtest it honestly. Specs like this one are the survivors of an unknown number of trials; deflate their results accordingly.
Related specs
- TrendHunter w MF Multi Timeframe Trend StrategyPine Script · Trend following · 1h
- Multitimeframe Trend Hunter StrategyPine Script · Trend following · 1h
- Multi Indicator Dynamic Trend Following Strategy Based on EMA and SMAPine Script · Trend following · 1d
- Trend Following Strategy Based on PMax IndicatorPine Script · Trend following · 5m
- Trend Tracking and Short term Trading Strategy Based on ADX IndicatorPine Script · Trend following · 1d
- ADX Filtered SuperTrend Pivot Trading StrategyPine Script · Trend following · 1d