Strategy vault / Trend following
Triple SuperTrend Quantitative Trading Strategy
The Triple SuperTrend quantitative trading strategy combines three SuperTrend indicators for short-term trading such as intraday trading and scalping. It is suitable for high-frequency trading markets such as…
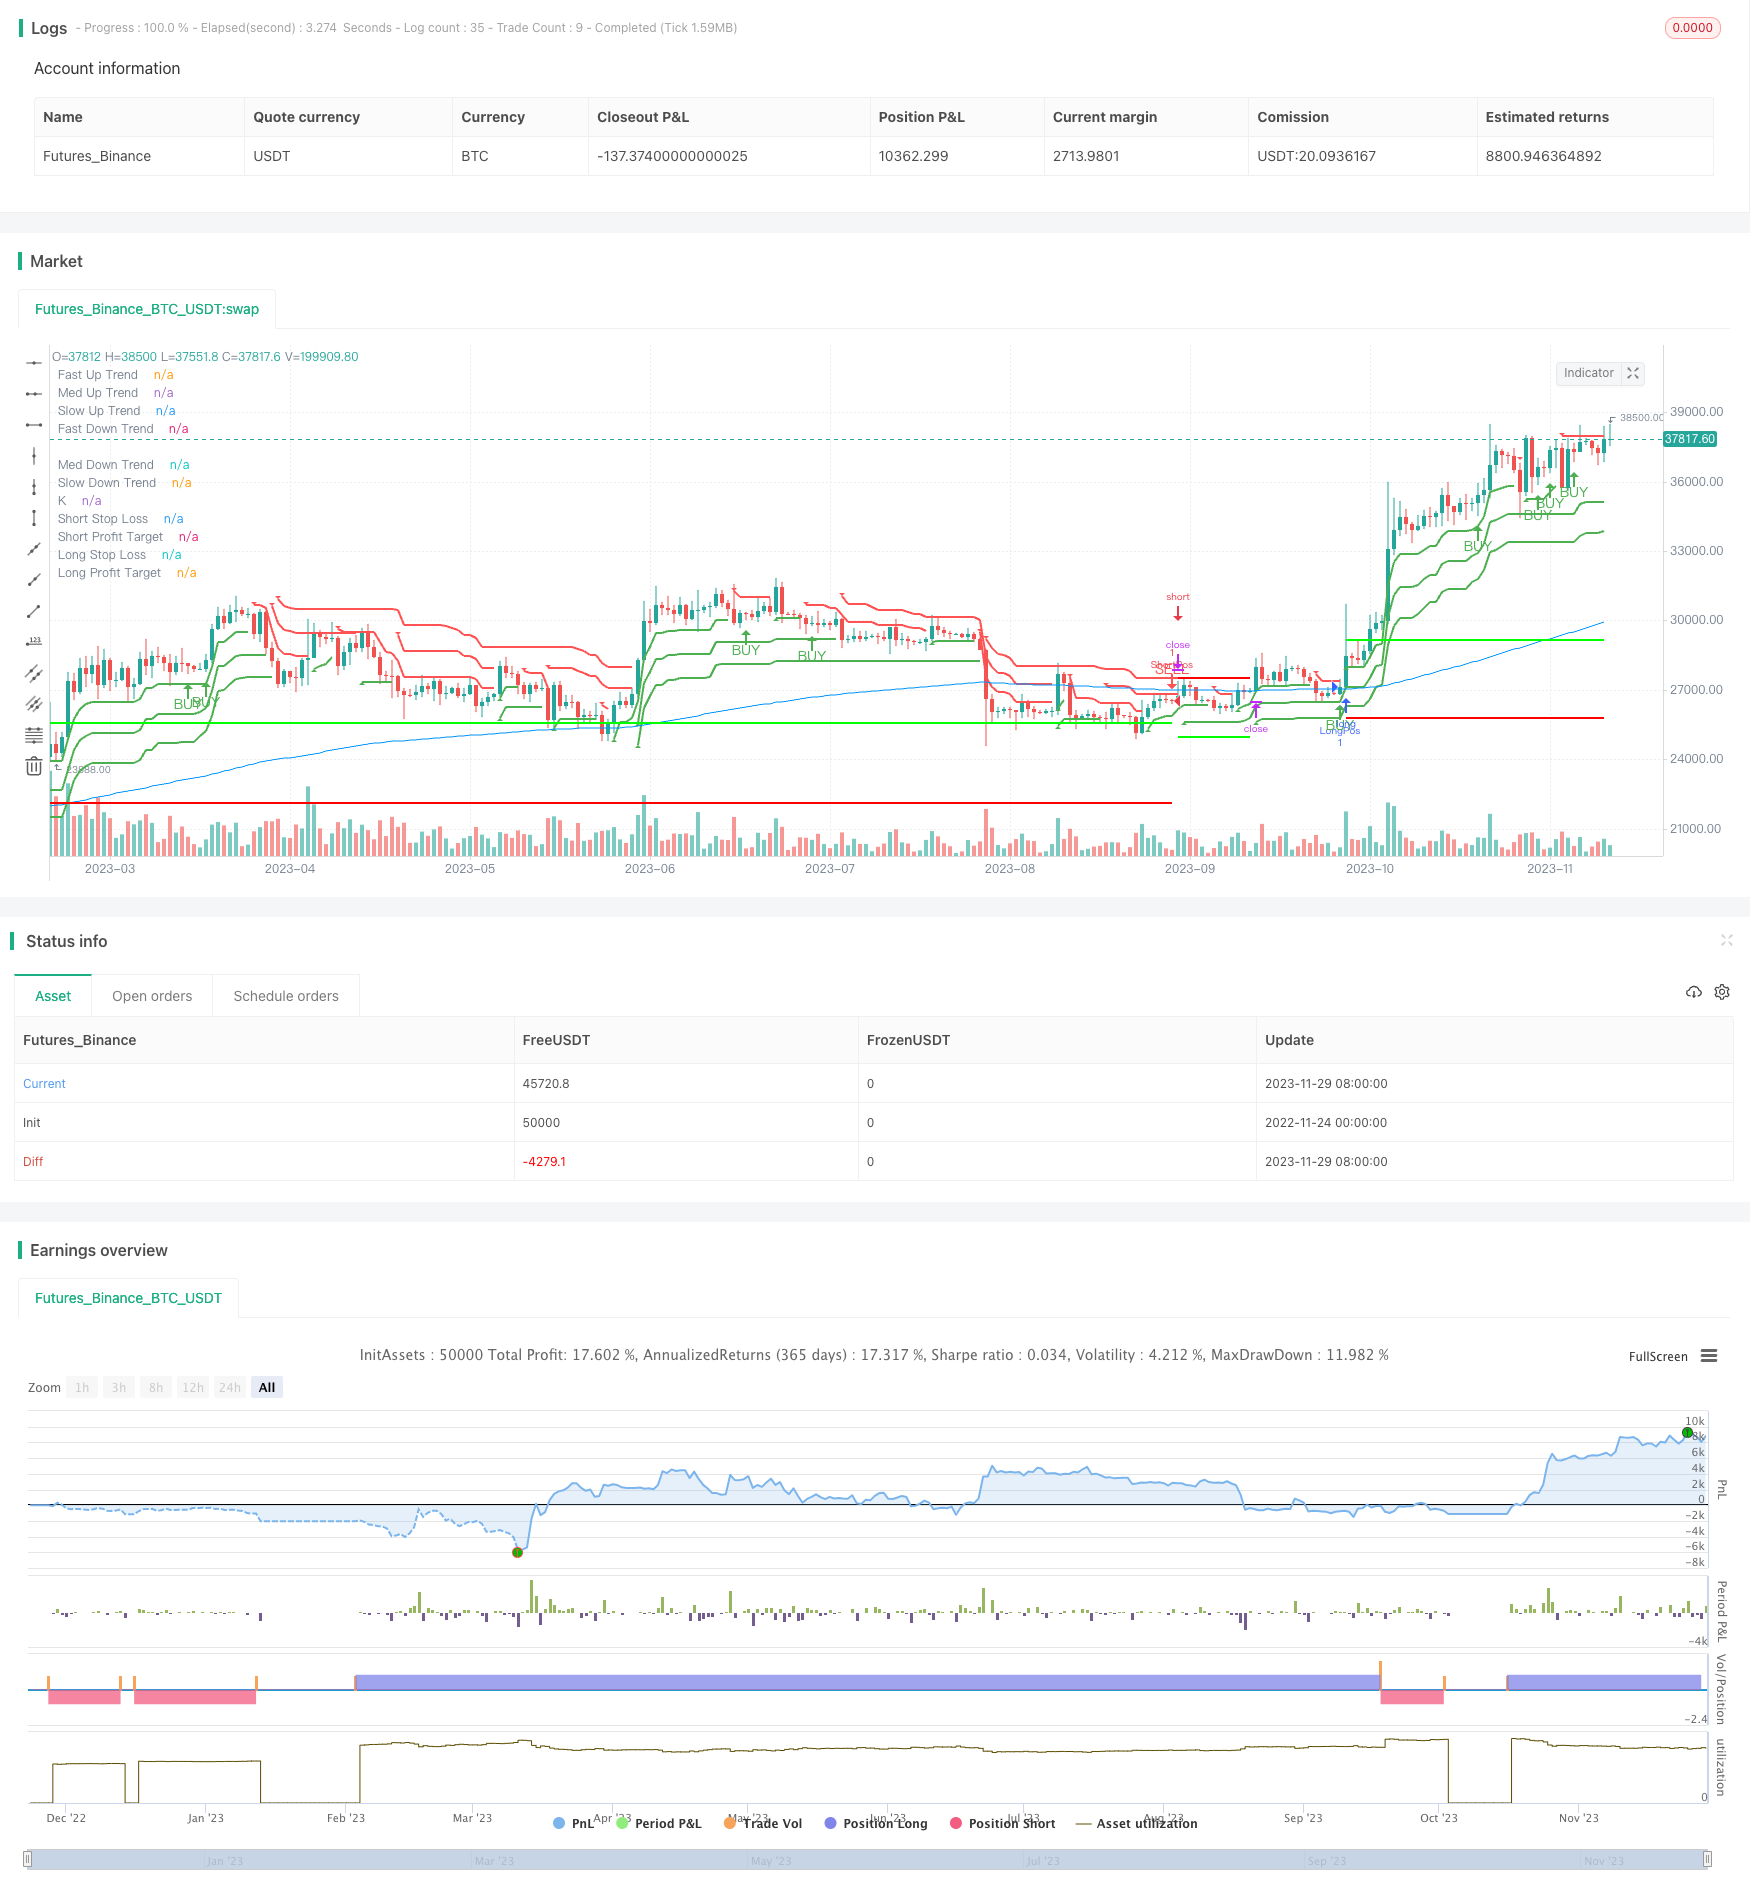
Overview
The Triple SuperTrend quantitative trading strategy combines three SuperTrend indicators for short-term trading such as intraday trading and scalping. It is suitable for high-frequency trading markets such as cryptocurrencies and forex.
Trading Logic
- Use the 200-day moving average to determine the overall market trend direction. Go long when price is above and go short when price is below.
- Use the triple SuperTrend indicators to determine the direction of the minor market trend. SuperTrend is accurate in judging bullish and bearish trends.
- Construct entry signals using the overbought and oversold Stoch RSI indicator with Bollinger Bands. Stoch RSI can identify reversal opportunities.
- Determine a risk-reward ratio of 1.5 based on SuperTrend stop loss and take profit.
Advantages
- Multiple trend verifications improve decision accuracy.
- Oversold and overbought indicators identify reversal opportunities.
- Stop loss and take profit control risk and reward proportions.
- Suitable for high-frequency short-term trading with high profit potential.
Risks
- Larger losses when major trend is unfavorable for short-term trading.
- Probability of failed reversal still exists leading to wrong decisions.
- Requires constant monitoring, not suitable for away-from-market trading.
Enhancements
- Optimize moving average parameters to adapt to longer periods.
- Optimize Stoch RSI parameters to reduce false signals.
- Optimize SuperTrend ATR periods to improve stops.
- Add position sizing to increase size on drawdowns.
Summary
The triple SuperTrend strategy improves decision accuracy through multiple trend verifications and controls risk/reward ratios using stops and limits. It is suitable for high-frequency short-term trading. Optimizing parameters can adapt it to longer periods, reduce false signals, and improve stops. Adding position sizing allows adding size during pullbacks to maximize profits.
Parameters
| Name | Default | What it controls |
|---|---|---|
| v_input_1 | 2020 | Backtest Start Year |
| v_input_2 | true | Backtest Start Month |
| v_input_3 | true | Backtest Start Day |
| v_input_4 | false | Strategy Direction |
| v_input_5 | 1.5 | P/L Ratio |
| v_input_6 | 200 | EMA Length |
| v_input_7 | 3 | K |
| v_input_8 | 3 | D |
| v_input_9 | 14 | Stoch RSI Length |
| v_input_10 | 14 | Stochastic Length |
| v_input_11_close | 0 | Stoch RSI Source: close | high | low | open | hl2 | hlc3 | hlcc4 | ohlc4 |
| v_input_12 | 20 | Stoch RSI Entry Thresh |
| v_input_13_hl2 | 0 | SuperTrend Source: hl2 | high | low | open | close | hlc3 | hlcc4 | ohlc4 |
| v_input_14 | 12 | Slow SuperTrend Length |
| v_input_15 | 3 | Slow SuperTrend Multiplier |
| v_input_16 | 11 | Med SuperTrend Length |
| v_input_17 | 2 | Med SuperTrend Multiplier |
| v_input_18 | 10 | Fast SuperTrend Length |
| v_input_19 | true | Fast SuperTrend Multiplier |
| v_input_20 | true | Alternate SuperTrend ATR Calculation? |
| v_input_21 | true | Show Open Profit/Loss Targets? |
| v_input_22 | true | Show Buy/Sell Indicators? |
Source Pine Script
/*backtest
start: 2022-11-24 00:00:00
end: 2023-11-30 00:00:00
period: 1d
basePeriod: 1h
exchanges: [{"eid":"Futures_Binance","currency":"BTC_USDT"}]
*/

//@version=4
strategy("3x SuperTrend Strategy (Mel0nTek) V1", calc_on_every_tick=true, overlay=true)

// ***************************************************
//  A Mel0nTek Project
//  Author: mel0n
//  Revision: 1.0 - Initial Release
// ***************************************************

// ***************************************************
//              Strategy & Rules
// ***************************************************
// === Sources ===
// Strategy Idea:
// Trade Pro - HIGHEST PROFIT Triple Supertrend Trading Strategy Proven 100 Trade Results
// https://www.youtube.com/watch?v=HpNZ2VpZzSE
//
// Combining SuperTrend with StochRSI is not a new idea by any means.
// However the method/criteria used in his video to apply them caught my interest.
// So I decided to code it up for myself to do some backtesting.
// The default values are the ones he uses in his video, however I found some tuning beneficial. YMMV
// Trade Pro makes some great content, the video is a good watch to get a better understanding of this strategy.
//
// Improved SuperTrend Calculation Method:
// SuperTrend by KivancOzbilgic

// === Indicators ===
// EMA
// @ 200
// Stoch RSI (default)
// @ 3, 3, 14, 14, close
// Supertrend slow
// @ 12, hl2, 3, change = true
// Supertrend med
// @ 11, hl2, 2, change = true
// Supertrend fast
// @ 10, hl2, 1, change = true

// === Rules ===
// long only
// - price above EMA200
// short only
// - price below EMA200
// Stop Loss = 2nd SuperTrend line above (short) or below(long) entry candle
// Profit = 1.5x SL/risk (Profit Ratio x Max Loss)

// === Entries ===
// LONG
// - long entry (Typical):
// - Stoch RSI below 20, cross up
// - 2nd SuperTrend line below close

// SHORT
// - short entry (Typical):
// - Stoch RSI above 80, cross down
// - 2nd SuperTrend line above close


// ***************************************************
// Backtest Parameters
// ***************************************************
testStartYear = input(2020, "Backtest Start Year")
testStartMonth = input(1, "Backtest Start Month")
testStartDay = input(1, "Backtest Start Day")
testPeriodStart = timestamp(testStartYear, testStartMonth, testStartDay, 0, 0)
timeCondition = time >= testPeriodStart
direction = input(0, title = "Strategy Direction", type=input.integer, minval=-1, maxval=1)
strategy.risk.allow_entry_in(direction == 0 ? strategy.direction.all : (direction < 0 ? strategy.direction.short : strategy.direction.long))

// ***************************************************
// Inputs
// ***************************************************
// P/L Ratio
plInput = input(1.5, title="P/L Ratio", step=0.1, minval=0.1)
// EMA
EMAInputlength = input(200, "EMA Length",step=100, minval=1)
// Stoch RSI
srsiInputSmoothK = input(3, "K", minval=1)
srsiInputSmoothD = input(3, "D", minval=1)
srsiInputLengthRSI = input(14, "Stoch RSI Length", minval=1)
srsiInputLengthStoch = input(14, "Stochastic Length", minval=1)
srsiInputSrc = input(close, title="Stoch RSI Source")
srsiInputThresh = input(20, title="Stoch RSI Entry Thresh", minval=1)
// SuperTrends
stInputSrc = input(hl2, title="SuperTrend Source")
stSlowInputLength = input(12, "Slow SuperTrend Length", minval=1)
stSlowInputMult = input(3, "Slow SuperTrend Multiplier", minval=1)
stMedInputLength = input(11, "Med SuperTrend Length", minval=1)
stMedInputMult = input(2, "Med SuperTrend Multiplier", minval=1)
stFastInputLength = input(10, "Fast SuperTrend Length", minval=1)
stFastInputMult = input(1, "Fast SuperTrend Multiplier", minval=1)
stInputchangeATR= input(title="Alternate SuperTrend ATR Calculation?", type=input.bool, defval=true)
// Toggles
showPLTargets = input(true, title="Show Open Profit/Loss Targets?")
showBuySell = input(true, title="Show Buy/Sell Indicators?")


// ***************************************************
// Indicator Functions
// ***************************************************
// SuperTrend Function
superTrend(period, src, mult, chgATR) =>
    stATRSmooth = sma(tr, period)                       // tr = true range
    stATR = chgATR ? atr(period) : stATRSmooth          // select ATR to use
    stUP = src - (mult * stATR)                         // up value
    stUP1 = nz(stUP[1], stUP)                           // prev candle value if not 0
    stUP := close[1] > stUP1 ? max(stUP,stUP1) : stUP   // select the larger up value if close is higher than previous up value
    stDN = src  + (mult * stATR)
    stDN1 = nz(stDN[1], stDN)
    stDN := close[1] < stDN1 ? min(stDN, stDN1) : stDN
    stTrend = 1
    stTrend := nz(stTrend[1], stTrend)
    stTrend := stTrend == -1 and close > stDN1 ? 1 : stTrend == 1 and close < stUP1 ? -1 : stTrend
    stBuySignal = stTrend == 1 and stTrend[1] == -1
    stSellSignal = stTrend == -1 and stTrend[1] == 1
    stChangeCond = stTrend != stTrend[1]
    [stUP, stDN, stTrend, stBuySignal, stSellSignal, stChangeCond]

// Stochastic RSI Function
stochRSI(smoothK, smoothD, lengthRSI, lengthStoch, src) =>
    rsiVal = rsi(src, lengthRSI)
    k = sma(stoch(rsiVal, rsiVal, rsiVal, lengthStoch), smoothK)
    d = sma(k, smoothD)
    [k, d]

// ***************************************************
// Data Calculation
// ***************************************************
// SuperTrend Slow
[stSlowUP, stSlowDN, stSlowTrend, stSlowBuy, stSlowSell, stSlowChanged] = superTrend(stSlowInputLength, stInputSrc, stSlowInputMult, stInputchangeATR)

// SuperTrend Medium
[stMedUP, stMedDN, stMedTrend, stMedBuy, stMedSell, stMedChanged] = superTrend(stMedInputLength, stInputSrc, stMedInputMult, stInputchangeATR)

// SuperTrend Fast
[stFastUP, stFastDN, stFastTrend, stFastBuy, stFastSell, stFastChanged] = superTrend(stFastInputLength, stInputSrc, stFastInputMult, stInputchangeATR)

// Stoch RSI
[srsiK, srsiD] = stochRSI(srsiInputSmoothK,srsiInputSmoothD,srsiInputLengthRSI,srsiInputLengthStoch,srsiInputSrc)

// EMA
emaVal = ema(close,EMAInputlength)

// ***************************************************
// Indicator Plots
// ***************************************************
// EMA
plot(emaVal, "K", color=#0094FF)

// SuperTrend Slow
plot(stSlowTrend == 1 ? stSlowUP : na, title="Slow Up Trend", style=plot.style_linebr, linewidth=2, color=color.green)
plotshape(stSlowBuy ? stSlowUP : na, title="Slow UpTrend Begins", location=location.absolute, style=shape.triangleup, size=size.tiny, color=color.green, transp=0)
plot(stSlowTrend == 1 ? na : stSlowDN, title="Slow Down Trend", style=plot.style_linebr, linewidth=2, color=color.red)
plotshape(stSlowSell ? stSlowDN : na, title="Slow DownTrend Begins", location=location.absolute, style=shape.triangledown, size=size.tiny, color=color.red, transp=0)

// SuperTrend Medium
plot(stMedTrend == 1 ? stMedUP : na, title="Med Up Trend", style=plot.style_linebr, linewidth=2, color=color.green)
plotshape(stMedBuy ? stMedUP : na, title="Med UpTrend Begins", location=location.absolute, style=shape.triangleup, size=size.tiny, color=color.green, transp=0)
plot(stMedTrend == 1 ? na : stMedDN, title="Med Down Trend", style=plot.style_linebr, linewidth=2, color=color.red)
plotshape(stMedSell ? stMedDN : na, title="Med DownTrend Begins", location=location.absolute, style=shape.triangledown, size=size.tiny, color=color.red, transp=0)

// SuperTrend Fast
plot(stFastTrend == 1 ? stFastUP : na, title="Fast Up Trend", style=plot.style_linebr, linewidth=2, color=color.green)
plotshape(stFastBuy ? stFastUP : na, title="Fast UpTrend Begins", location=location.absolute, style=shape.triangleup, size=size.tiny, color=color.green, transp=0)
plot(stFastTrend == 1 ? na : stFastDN, title="Fast Down Trend", style=plot.style_linebr, linewidth=2, color=color.red)
plotshape(stFastSell ? stFastDN : na, title="Fast DownTrend Begins", location=location.absolute, style=shape.triangledown, size=size.tiny, color=color.red, transp=0)

// Stoch RSI
// plot(srsiK, "K", color=#0094FF)
// plot(srsiD, "D", color=#FF6A00)
// h0 = hline(80, "Upper Band", color=#606060)
// h1 = hline(20, "Lower Band", color=#606060)
// fill(h0, h1, color=#9915FF, transp=80, title="Background")

// ***************************************************
// Conditional Logic
// ***************************************************
// common vars
float longStop = na
float longProfit = na
float shortStop = na
float shortProfit = na

// check EMA to determine long/short side trading
emaTrend = emaVal < close ? 1 : -1

// count how many supertrends are above/below
stCount = 0
stCount := stFastTrend + stMedTrend + stSlowTrend

// LONG
// - long entry (Typical):
// - Stoch RSI below 20, cross up
// - 2 ST's below close
stochLongCond = srsiK < srsiInputThresh and crossover(srsiK, srsiD)
stLongCond = stCount >= 1
longCondition = emaTrend > 0 and stochLongCond and stLongCond

tempStopLong = longCondition ? stCount == 3 ? stMedUP : stSlowUP : longStop
longStopDelta = abs(close - tempStopLong)
tempProfitLong = longCondition ? close + (plInput * longStopDelta) : longProfit

longStop := strategy.position_size <= 0 ? longCondition ? tempStopLong : na : longStop[1]
longProfit := strategy.position_size <= 0 ? longCondition ? tempProfitLong : na : longProfit[1]

// SHORT
// - short entry (Typical):
// - Stoch RSI above 80, cross down
// - 2 ST's above close
stochShortCond = srsiK > 100 - srsiInputThresh and crossunder(srsiK, srsiD)
stShortCond = stCount <= -1
shortCondition = emaTrend < 0 and stochShortCond and stShortCond

tempStopShort = shortCondition ? stCount == -3 ? stMedDN : stSlowDN : shortStop
shortStopDelta = abs(close - tempStopShort)
tempProfitShort = shortCondition ? close - (plInput * shortStopDelta) : shortProfit

shortStop := strategy.position_size >= 0 ? shortCondition ? tempStopShort : na : shortStop[1]
shortProfit := strategy.position_size >= 0 ? shortCondition ? tempProfitShort : na : shortProfit[1]

// ***************************************************
// Strategy Execution
// ***************************************************
strategy.exit("TP/SL", "LongPos", stop=longStop, limit=longProfit)
strategy.exit("TP/SL", "ShortPos", stop=shortStop, limit=shortProfit)

if (longCondition)
	strategy.entry("LongPos", strategy.long, stop=longStop, oca_name="3xST", comment="Long")
else
	strategy.cancel(id="LongPos")
if (shortCondition)
	strategy.entry("ShortPos", strategy.short, stop=shortStop, oca_name="3xST", comment="Short")
else
	strategy.cancel(id="ShortPos")

// ***************************************************
// Strategy Plotting
// ***************************************************
// profit/loss target lines
plot(showPLTargets ? strategy.position_size <= 0 ? na : longStop : na, title="Long Stop Loss", color=color.new(#ff0000, 0), style=plot.style_linebr, linewidth=2)
plot(showPLTargets ? strategy.position_size <= 0 ? na : longProfit : na, title="Long Profit Target", color=color.new(#00ff00, 0), style=plot.style_linebr, linewidth=2)
plot(showPLTargets ? strategy.position_size >= 0 ? na : shortStop : na, title="Short Stop Loss", color=color.new(#ff0000, 0), style=plot.style_linebr, linewidth=2)
plot(showPLTargets ? strategy.position_size >= 0 ? na : shortProfit : na, title="Short Profit Target", color=color.new(#00ff00, 0), style=plot.style_linebr, linewidth=2)
// buy/sell arrows
plotshape(showBuySell and longCondition ? true : na, title='Buy Arrow',  location=location.belowbar, color=color.green,   style=shape.arrowup,   text="BUY",  textcolor=color.green, transp=0, size=size.small)
plotshape(showBuySell and shortCondition ? true : na, title='Sell Arrow', location=location.abovebar, color=color.red,     style=shape.arrowdown, text="SELL", textcolor=color.red,   transp=0, size=size.small)

// ***************************************************
// Alerts (for use in a study)
// ***************************************************
alertcondition(longCondition, title="3xST Buy alert", message="Buy")
alertcondition(shortCondition, title="3xST SELL alert", message="Sell")
alertcondition(stSlowChanged, title="3xST Slow Trend alert", message="Slow Trend Changed")Published by ChaoZhang on the FMZ strategy square · last modified 2023-12-01. Collected in the Quant Trading Vault. Unvalidated research: re-test with your own data and costs before trusting it.
Build this with AgenKit
A spec is not a trading system. Paste this into your coding agent and AgenKit runs a specialist team — architecture, test-first build, risk gates, review — with paper trading on by default.
/agenkit build a production-grade trading bot with a backtest engine, risk controls and paper trading by default from strategies/Triple-SuperTrend-Quantitative-Trading-Strategy.md- npx agenkit install engineering-kit in your project
- Paste the command into your agent and approve each phase
- Get tests, backtest, risk controls and a paper-trading switch
Understand it first
Before you run this, read the lesson behind the idea and how to backtest it honestly. Specs like this one are the survivors of an unknown number of trials; deflate their results accordingly.
Related specs
- SuperTrend Trading Strategy with Multiple FiltersPine Script · Trend following · 1h
- Mini Pullback Supertrend StrategyPine Script · Trend following · 1h
- Triple SuperTrend and Stoch RSI StrategyPine Script · Trend following · 1d
- Dual directional Trailing Stop Moving Average Trend StrategyPine Script · Trend following · 1m
- Trend Following Strategy Based on Multiple IndicatorsPine Script · Trend following · 2h
- Multi Indicator Golden Swing Trading StrategyPine Script · Trend following · 45m