Strategy vault / Multi-timeframe
TSLA Quantitative Trading System Across Multiple Timeframes
The core idea of this strategy is to monitor both the price technical indicators of TSLA itself and the technical indicators of the US stock market index. It sends out trading signals when both sides reach the…
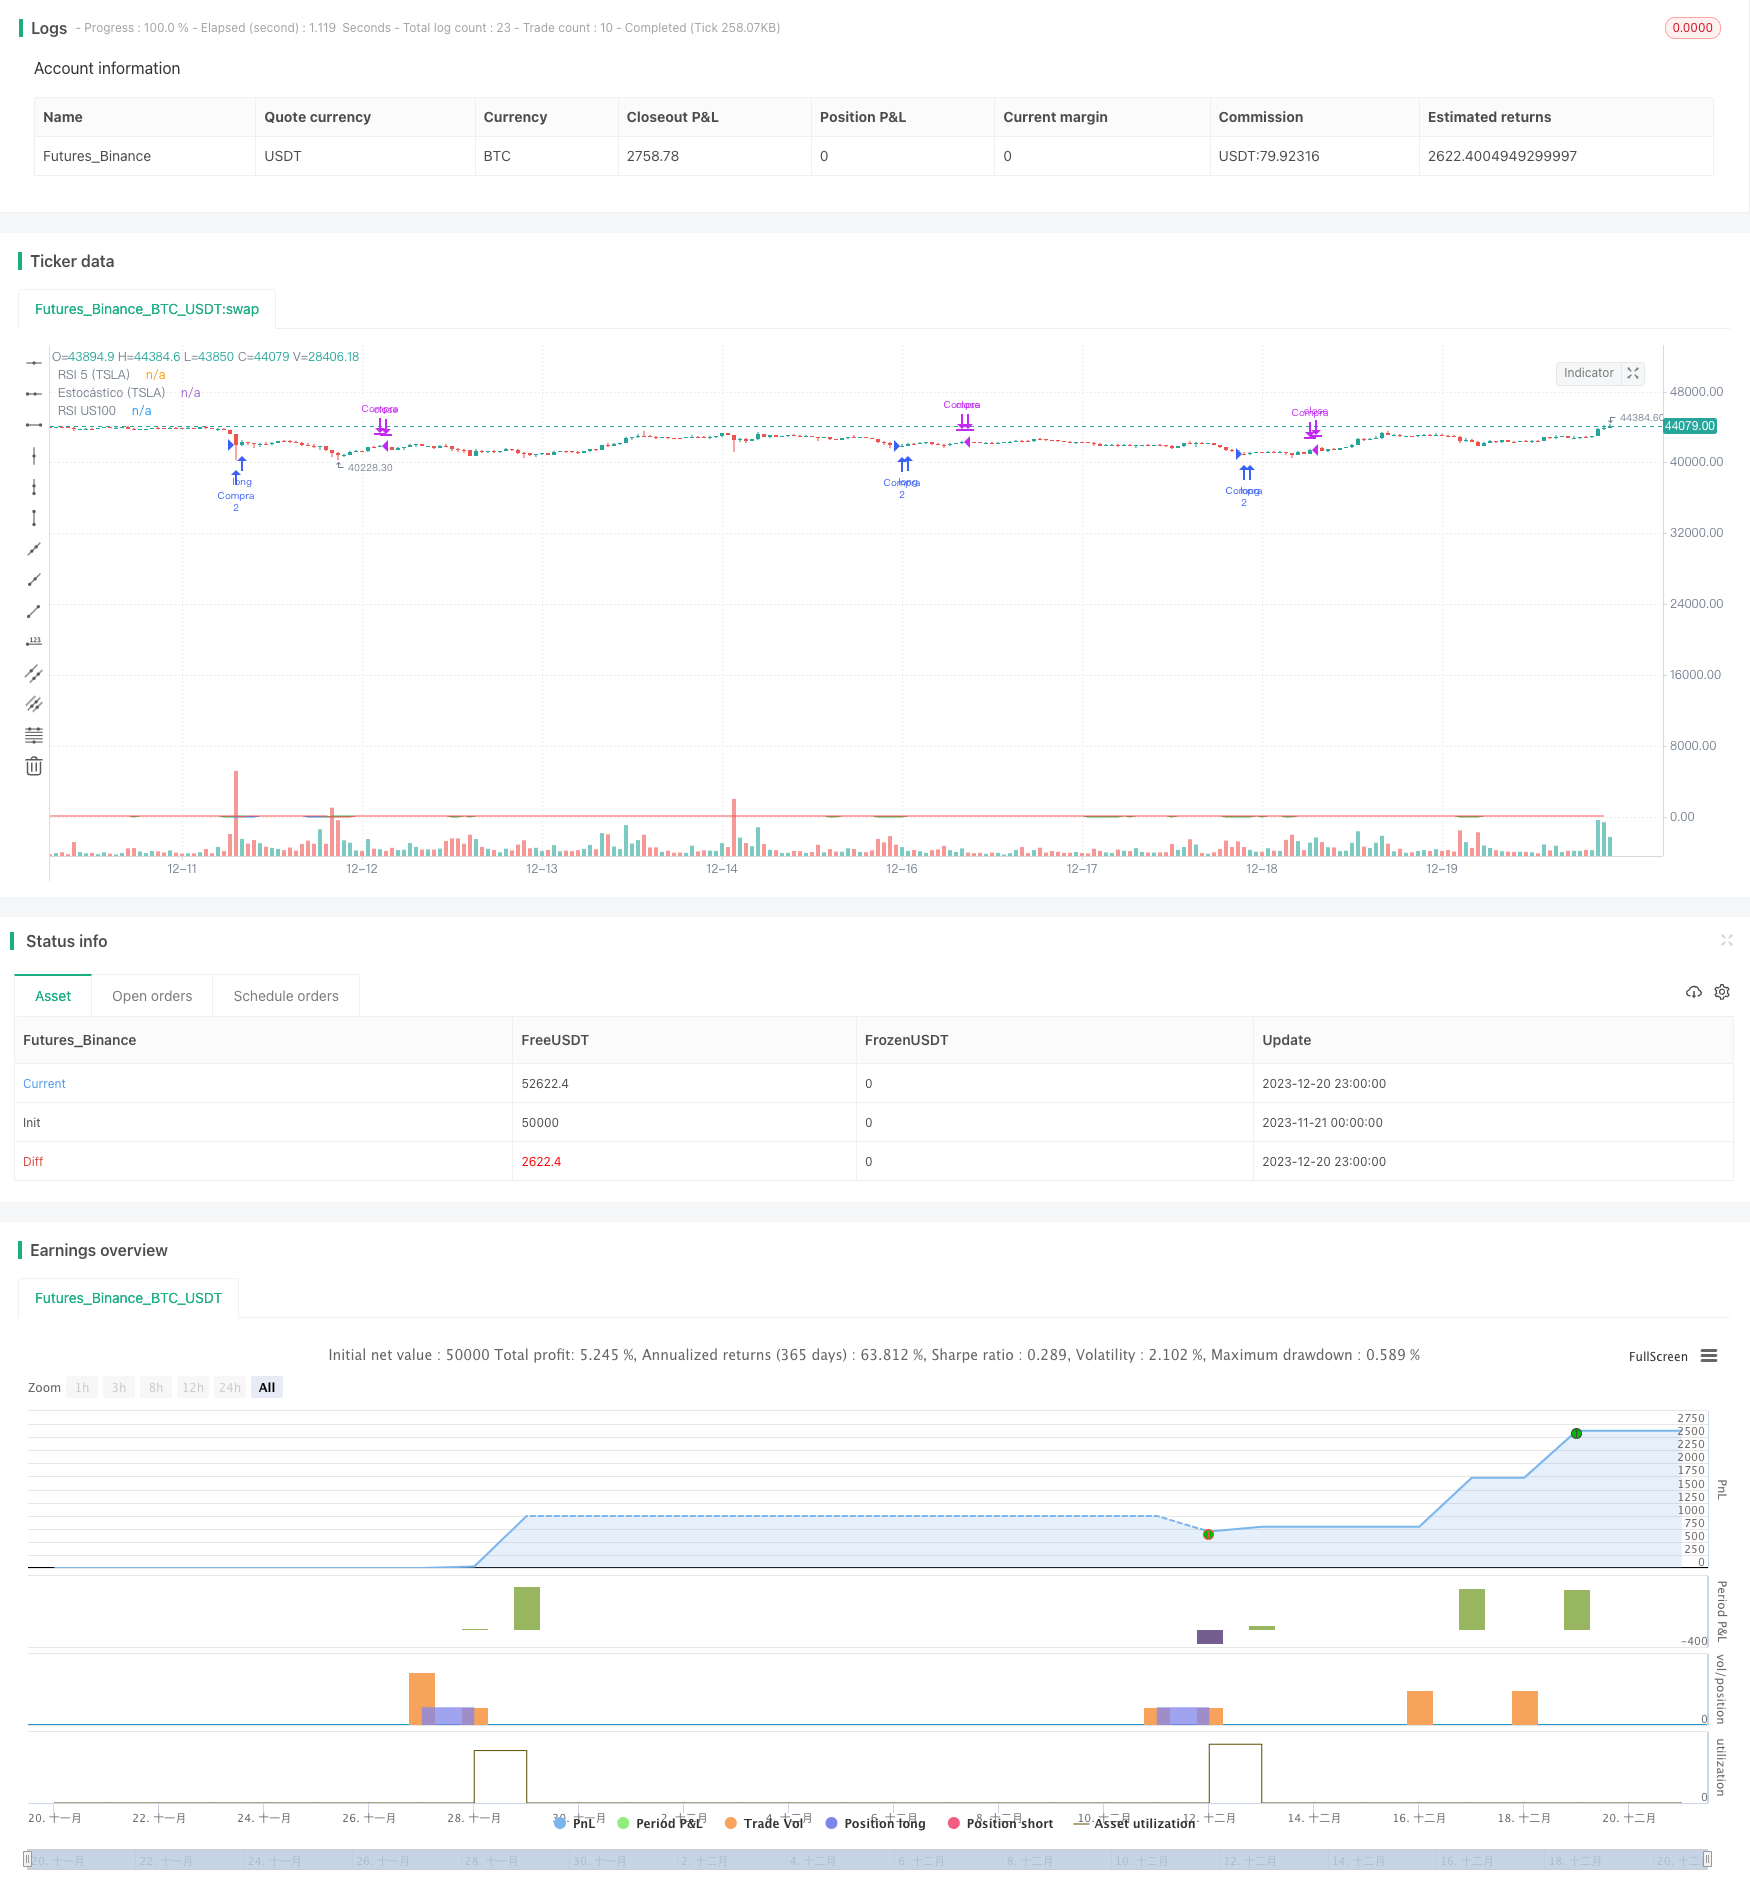
This strategy utilizes two different types of technical indicators, RSI and Estocastic, across the 5-minute chart of TSLA and 1-minute chart of S&P 100 index to design trading rules and build an automated trading system for TSLA stocks.
Strategy Overview
The core idea of this strategy is to monitor both the price technical indicators of TSLA itself and the technical indicators of the US stock market index. It sends out trading signals when both sides reach the extremely overbought or oversold status at the same time. The strategy adopts technical indicators across two timeframes, the 5-minute and 1-minute, which can help filter out some noisy trading signals effectively.
Strategy Logic
Firstly, the strategy calculates the 5-day RSI on the 5-minute chart of TSLA, and the 14-day RSI on the 1-minute chart of the S&P 100 index. When the 5-day RSI of TSLA is below 30 and the 14-day RSI of the S&P 100 index is below 30 at the same time, it is considered that TSLA price reaches an extremely oversold level and a buy signal is triggered.
After buying in, the strategy keeps monitoring the 14-day Estocastic indicator on the 1-minute chart of TSLA. When the Estocastic indicator surpasses 78, it is viewed as TSLA price bounces back to the upper band and a sell signal is triggered.
In addition, a 3% stop loss is set in the strategy. When the price drops below the stop loss level, the position will be closed with a stop loss.
Advantages of the Strategy
- Adopting multiple timeframes can help filter out noisy signals effectively
- RSI and Estocastic indicators verify each other and improve signal quality
- Stop loss mechanism limits the loss per trade
- Backtesting data includes the minute bars of TSLA and S&P 100 index which is representative
- The strategy logic is simple and easy to understand as well as optimize
Risks of the Strategy
- Combining multiple timeframes and indicators may miss some opportunities
- Overly aggressive stop loss setting may lead to unnecessary slippage loss
- S&P 100 index as a auxiliary tool also introduces some systemic risk
- The quality of backtesting data and changing market environments may influence the results
Directions for Strategy Optimization
- Test more parameter combinations to find the optimal indicator configuration
- Add adaptive stop loss algorithms
- Add position sizing module to lock in more profits
- Add machine learning algorithms to train indicator weights
- Search for trading turns in longer timeframes
Conclusion
To conclude, this is a typical mean-reversion strategy based on overbought and oversold signals, with additional features like multiple timeframe validation and stop loss to make it more robust. The advantage lies in its simplicity to understand and implement. The next step is to acquire more alpha while controlling risks, which requires custom optimization work around the indicators and models. Overall, this strategy establishes a solid foundation for building quantitative trading systems.
Source Pine Script
/*backtest
start: 2023-11-21 00:00:00
end: 2023-12-21 00:00:00
period: 1h
basePeriod: 15m
exchanges: [{"eid":"Futures_Binance","currency":"BTC_USDT"}]
*/

//@version=5
strategy("Estrategia de Trading TSLA", overlay=true)

// Condiciones de entrada
rsi5 = ta.rsi(close, 5) // RSI en el gráfico de TSLA de 5 minutos
rsiUS100 = ta.rsi(request.security(syminfo.tickerid, "1", close), 14) // RSI en el gráfico de US100 de 1 minuto

// Condiciones de entrada
condicion_entrada = rsi5 < 30 and rsiUS100 < 30

// Cantidad de acciones a comprar
cantidad_compra = 2

// Condiciones de salida
estocastico = ta.stoch(close, high, low, 14) // Estocástico en el gráfico de TSLA de 1 minuto
condicion_salida = estocastico > 78

// Stop loss
stop_loss = strategy.position_avg_price * 0.03

// Ejecutar la estrategia
if condicion_entrada
    strategy.entry("Compra", strategy.long, qty = cantidad_compra)

if condicion_salida or ta.highest(high, 10) <= stop_loss
    strategy.close("Compra")

// Mostrar indicadores en el gráfico
plot(rsi5, "RSI 5 (TSLA)", color=color.blue)
plot(rsiUS100, "RSI US100", color=color.red)
plot(estocastico, "Estocástico (TSLA)", color=color.green)
Published by ChaoZhang on the FMZ strategy square · last modified 2023-12-22. Collected in the Quant Trading Vault. Unvalidated research: re-test with your own data and costs before trusting it.
Build this with AgenKit
A spec is not a trading system. Paste this into your coding agent and AgenKit runs a specialist team — architecture, test-first build, risk gates, review — with paper trading on by default.
/agenkit build a production-grade trading bot with a backtest engine, risk controls and paper trading by default from strategies/TSLA-Quantitative-Trading-System-Across-Multiple-Timeframes.md- npx agenkit install engineering-kit in your project
- Paste the command into your agent and approve each phase
- Get tests, backtest, risk controls and a paper-trading switch
Understand it first
Before you run this, read the lesson behind the idea and how to backtest it honestly. Specs like this one are the survivors of an unknown number of trials; deflate their results accordingly.
Related specs
- Low Pyramid Risk Tracking StrategyPine Script · Multi-timeframe · 1d
- Multi Timeframe RSI SRSI Trading StrategyPine Script · Multi-timeframe · 1d
- Multi timeframe RSI and Moving Average Trading StrategyPine Script · Multi-timeframe · 1h
- Aggregated Multi timeframe MACD RSI CCI StochRSI MA Linear Trading StrategyPine Script · Multi-timeframe · 1m
- Multi Timeframe MACD StochRSI Combo StrategyPine Script · Multi-timeframe · 1h
- Multi Timeframe RSI and Stochastics StrategyPine Script · Multi-timeframe · 1h