Strategy vault / Machine learning
Two Year New High Retracement Moving Average Strategy
This strategy is based on the unique calculation of the two-year new high price and moving average of stocks. It generates a buy signal when the stock price retreats to the 13-day exponential moving average after…
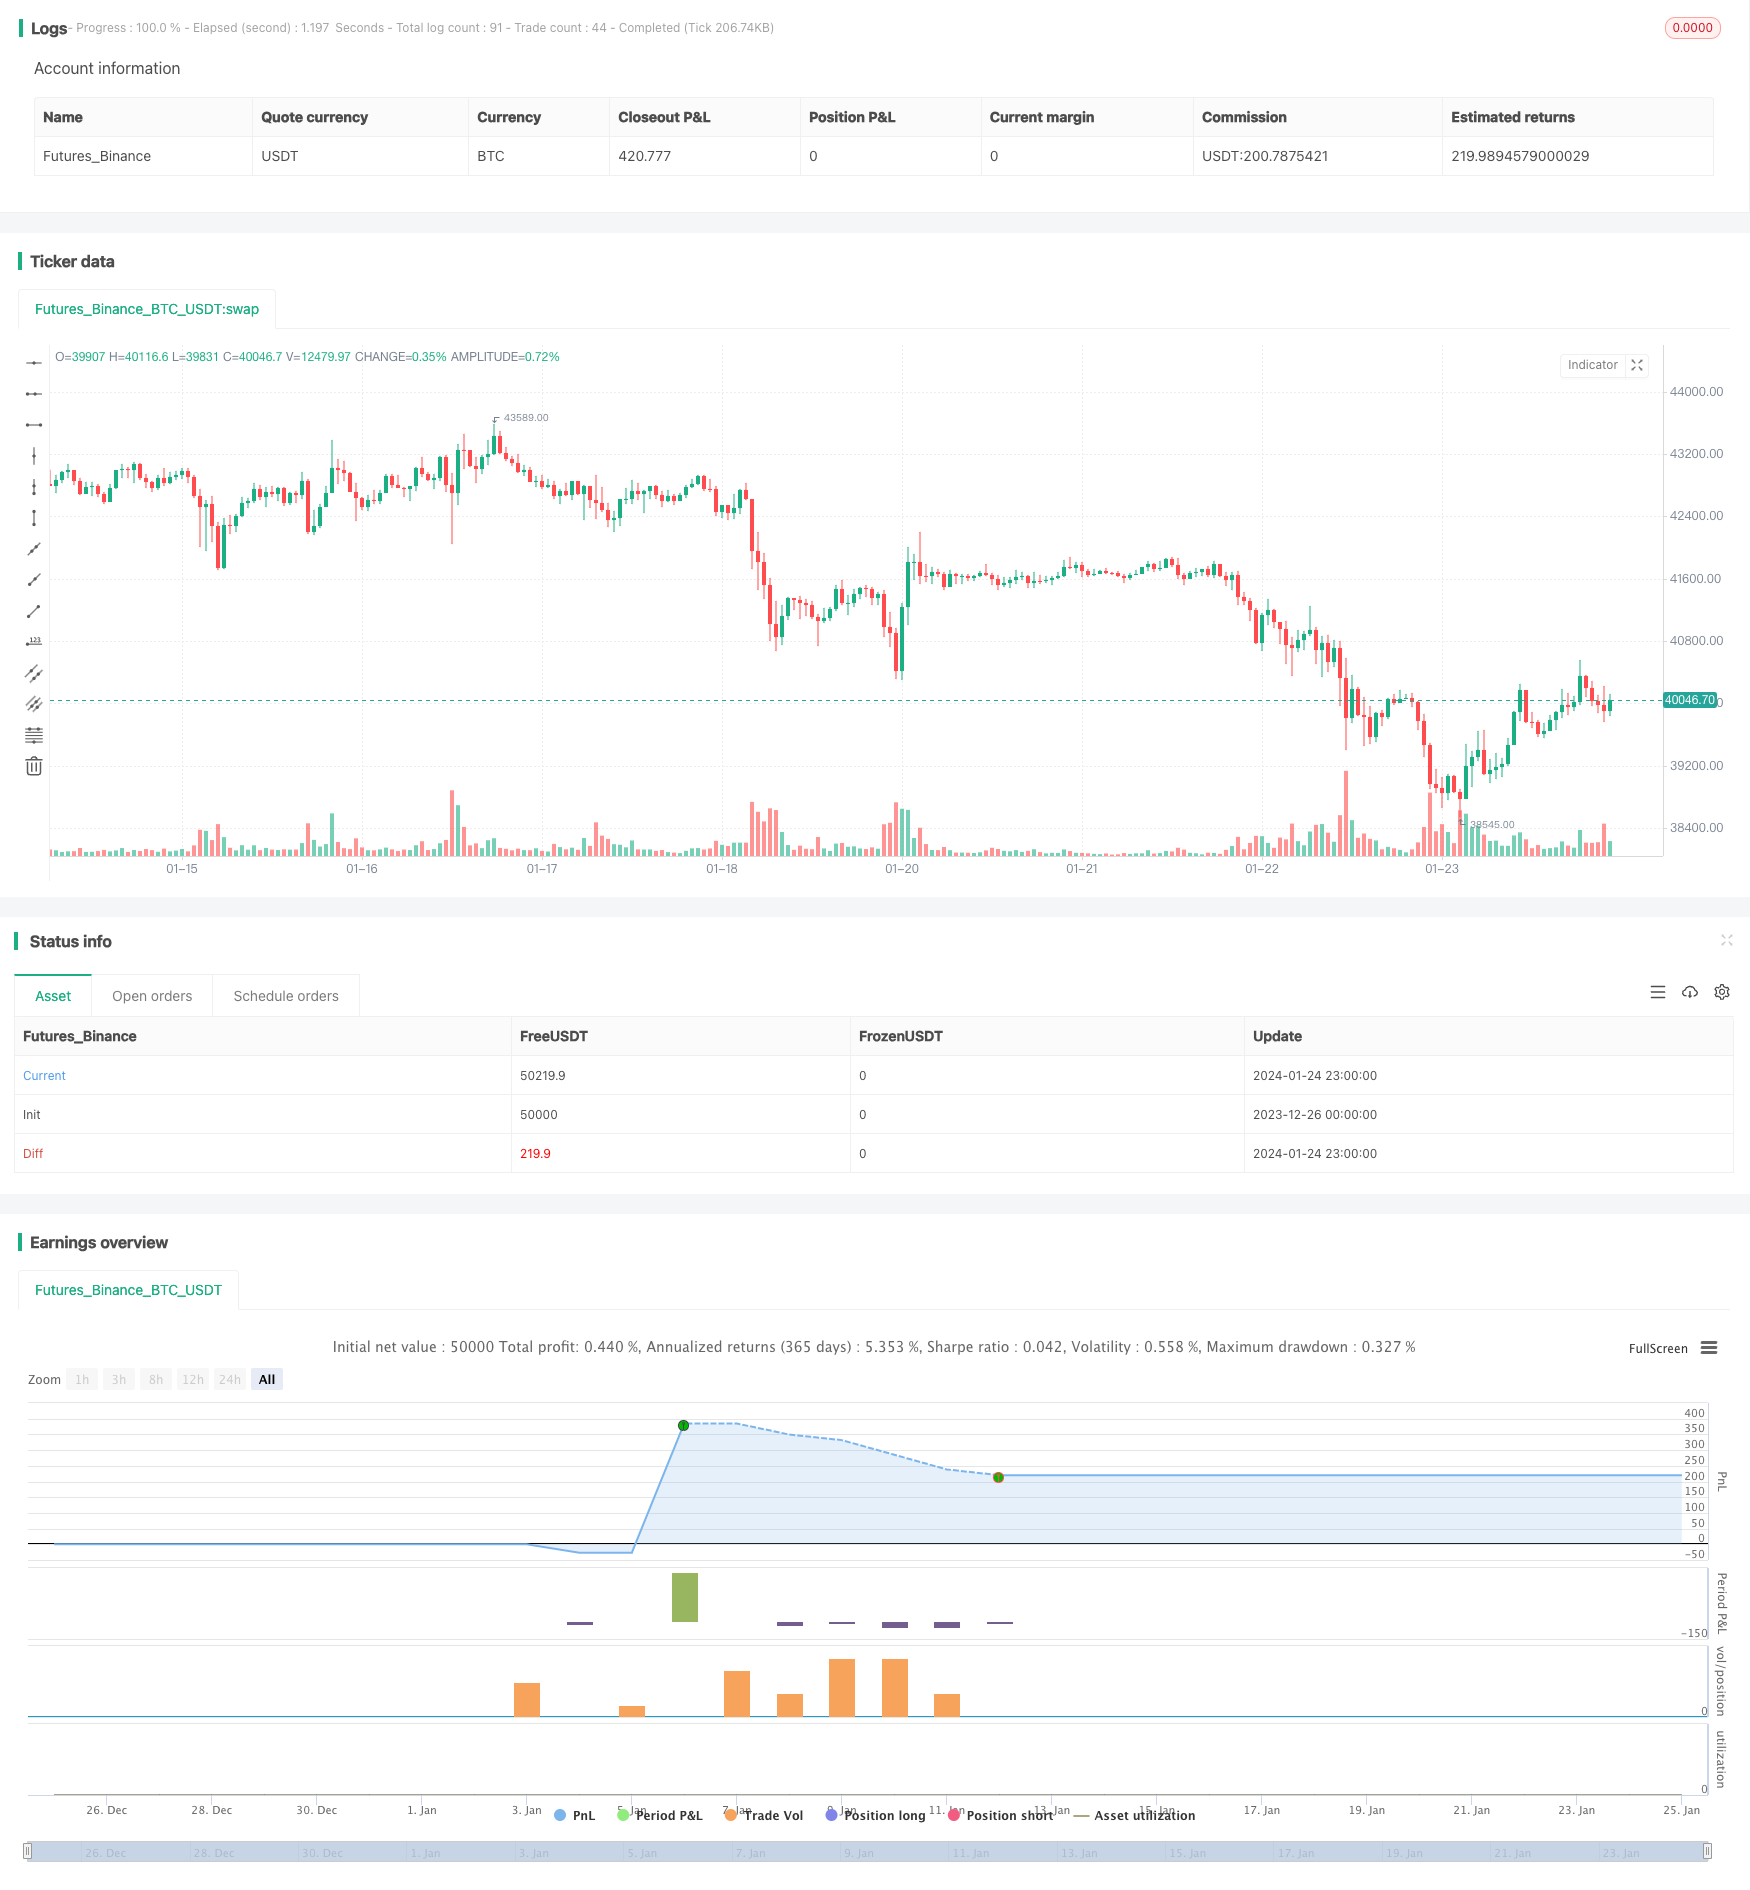
Overview
This strategy is based on the unique calculation of the two-year new high price and moving average of stocks. It generates a buy signal when the stock price retreats to the 13-day exponential moving average after reaching a two-year high.
Strategy Principle
The core logic of this strategy is based on the following unique calculations:
When the stock price reaches a new high over the last two years, it forms a short-term peak. This is a critical price level.
When the price retreats from this new high and pulls back to the 13-day exponential moving average, it presents a good buying opportunity. This utilizes the price consolidation pattern.
In addition, when the buy signal triggers, the stock price must be within 10% range of the two-year high, not too far away. It also needs to be below 13-day line and above 21-day line to ensure proper timing.
For open positions, if the price breaks 5% below the 21-day MA line or declines 20% from the two-year high, the position will be stopped out to lock in profits.
Strategy Advantages
This is a long-term breakout strategy with these advantages:
The unique two-year high price can effectively identify potential trend reversal opportunities.
The 13-day EMA line serves as the entry filter to avoid whipsaws and determine stronger momentum.
The unique calculations generate signals based on price action, avoiding subjective interference.
Reasonable stop loss allows locking in most profits.
Risks and Solutions
There are also some risks mainly as follows:
Markets can experience deep drawdowns, unable to stop out in time. Need to assess the overall environment to decide whether to cut losses resolutely.
Overnight big gaps may prevent perfect stop loss. Hence stop loss percentage needs to be widened to adapt.
The 13-day line may not filter out consolidations well, generating excessive false signals. Can consider extending to 21-day line.
New high price may not work well to determine trend changes. Other indicators can combine to enhance effectiveness.
Strategy Optimization Suggestions
There is room for further optimization:
Incorporate other tools to judge overall market conditions, avoiding unnecessary positions.
Add momentum indicators to better avoid whipsaw ranges.
Optimize moving average parameters to better capture price patterns.
Utilize machine learning to dynamically optimize the two-year high parameter for more flexibility.
Conclusion
In summary, this is a unique long term breakout strategy, with the key being the two-year high price level and the 13-day EMA line serving as entry filter. It has certain advantages but also room for improvements, worth further research and exploration.
Parameters
| Name | Default | What it controls |
|---|---|---|
| v_input_1 | 2000 | Start Year |
| v_input_2 | true | Start Month |
| v_input_3 | true | Start Date |
| v_input_4 | 2021 | End Year |
| v_input_5 | 6 | End Month |
| v_input_6 | 3 | End Date |
Source Pine Script
/*backtest
start: 2023-12-26 00:00:00
end: 2024-01-25 00:00:00
period: 1h
basePeriod: 15m
exchanges: [{"eid":"Futures_Binance","currency":"BTC_USDT"}]
*/

// This source code is subject to the terms of the Mozilla Public License 2.0 at https://mozilla.org/MPL/2.0/
// © Part Timer

//This script accepts from and to date parameter for backtesting.
//This script generates white arrow for each buying signal

//@version=4
strategy("AMRS_LongOnly_PartTimer", overlay = true)

//i_endTime = input(defval = timestamp("02 Jun 2021 15:30 +0000"), title = "End Time", type=input.time)

StartYear=input(defval = 2000, title ="Start Year", type=input.integer)
StartMonth=input(defval = 01, title ="Start Month", type=input.integer)
StartDate=input(defval = 01, title ="Start Date", type=input.integer)

endYear=input(defval = 2021, title ="End Year", type=input.integer)
endMonth=input(defval = 06, title ="End Month", type=input.integer)
endDate=input(defval = 03, title ="End Date", type=input.integer)

ema11=ema(close,11)
ema13=ema(close,13)
ema21=ema(close,21)

afterStartDate = true
//g=bar_index==1
//ath()=>
    //a=0.0
    //a:=g ? high : high>a[1] ? high:a[1]

//a = security(syminfo.tickerid, 'M', ath(),lookahead=barmerge.lookahead_on)

newHigh = (high > highest(high,504)[1])
//plot down arrows whenever it's a new high
plotshape(newHigh, style=shape.triangleup, location=location.abovebar, color=color.green, size=size.tiny)
b=highest(high,504)[1]
VarChk=((b-ema13)/b)*100
TrigLow = (low <= ema13) and (low >= ema21) and (VarChk <= 10)
plotshape(TrigLow, style=shape.triangleup, location=location.belowbar, color=color.white, size=size.tiny)
ExitPrice=(ema21 - (ema21*0.05))
DrawPrice=(b - (b*0.20))
stopprice=0.0
if (close <= ExitPrice)
    stopprice := ExitPrice
if (close <= DrawPrice)
    stopprice := DrawPrice

if (TrigLow and afterStartDate)
    strategy.entry("Long", strategy.long)

strategy.exit("exit","Long", stop=stopprice)
//beforeEndDate = (time < i_endTime)
beforeEndDate = (time >= timestamp(syminfo.timezone,endYear, endMonth, endDate, 0, 0))
if (beforeEndDate)
strategy.close_all()Published by ChaoZhang on the FMZ strategy square · last modified 2024-01-26. Collected in the Quant Trading Vault. Unvalidated research: re-test with your own data and costs before trusting it.
Build this with AgenKit
A spec is not a trading system. Paste this into your coding agent and AgenKit runs a specialist team — architecture, test-first build, risk gates, review — with paper trading on by default.
/agenkit build a production-grade trading bot with a backtest engine, risk controls and paper trading by default from strategies/Two-Year-New-High-Retracement-Moving-Average-Strategy.md- npx agenkit install engineering-kit in your project
- Paste the command into your agent and approve each phase
- Get tests, backtest, risk controls and a paper-trading switch
Understand it first
Before you run this, read the lesson behind the idea and how to backtest it honestly. Specs like this one are the survivors of an unknown number of trials; deflate their results accordingly.
Related specs
- AI Driven Dynamic Volatility Adaptive Trend Breakout Trading StrategyPine Script · Machine learning · 2d
- Dual Moving Average Matching Strategy Based on Bollinger BandsPine Script · Machine learning · 1h
- Dynamic Weighted Moving Average Trading StrategyPine Script · Machine learning · 1d
- EMA and RSI Quantitative Trading StrategyPine Script · Machine learning · 1h
- Fibonacci Retracement Dynamic Stop Loss StrategyPine Script · Machine learning · 1h
- MACD Robot Trading StrategyPine Script · Machine learning · 1d