Strategy vault / Mean reversion
v12Bollinger RSI Double Strategy Long Only v12
Bollinger Bands + RSI Double Long Strategy This strategy combines the Bollinger Bands indicator and the RSI indicator to go long when both show an oversold signal, and to close the long position when both show an…
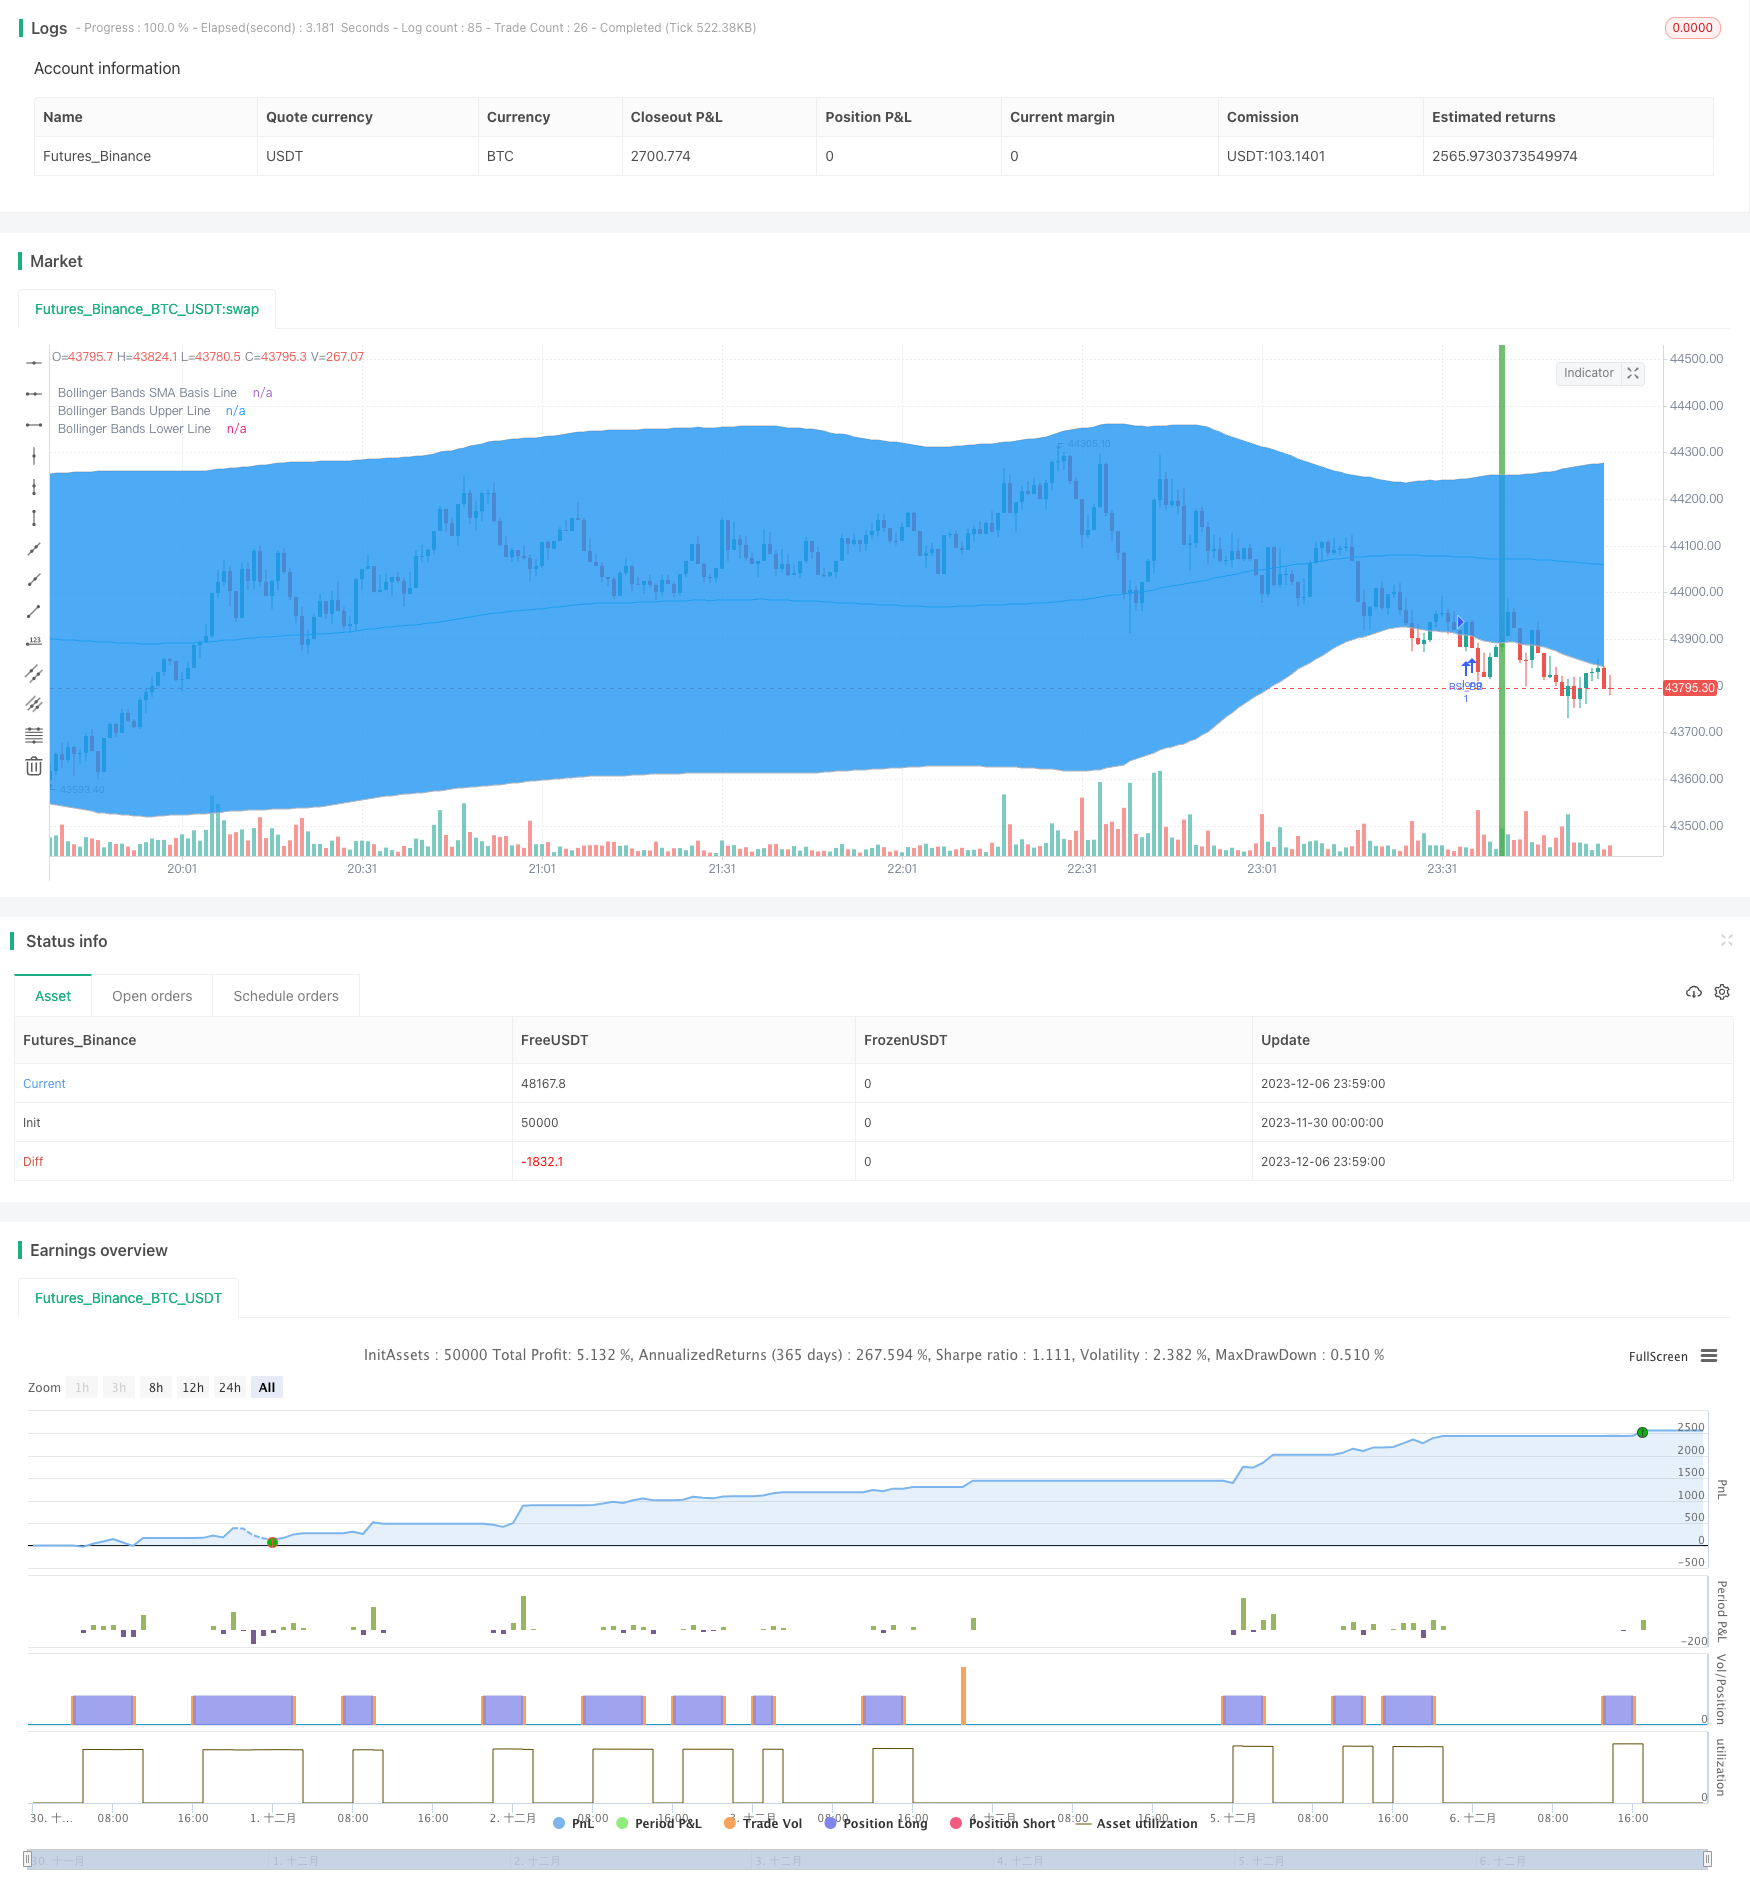
I. Strategy Name
Bollinger Bands + RSI Double Long Strategy
II. Strategy Overview
This strategy combines the Bollinger Bands indicator and the RSI indicator to go long when both show an oversold signal, and to close the long position when both show an overbought signal. Compared with a single indicator, it can more reliably confirm trading signals and avoid false signals.
III. Strategy Principle
- Use RSI indicator to judge overbought/oversold
- RSI below 50 is considered oversold
- RSI above 50 is considered overbought
- Use Bollinger Bands to judge price extremes
- Price below lower band is oversold
- Price above upper band is overbought
- Go long when both RSI and Bollinger Bands show oversold signal
- RSI below 50
- Price below Bollinger lower band
- Close long position when both RSI and Bollinger Bands show overbought signal
- RSI above 50
- Price above Bollinger upper band
IV. Strategy Strengths
- Combining two indicators makes signals more reliable and avoids false signals
- Only long positions simplify logic and reduce trading risk
V. Strategy Risks and Solutions
- Improper Bollinger Bands parameter setting, too wide upper/lower bands increase false trading risk
- Optimize Bollinger Bands parameters, set reasonable period and standard deviation
- Improper RSI parameter setting, wrong overbought/oversold standards increase false trading risk
- Optimize RSI parameters, adjust RSI period, set reasonable overbought/oversold standards
- Poor profitability when market lacks a trend
- Combine with trend indicators to avoid choppy markets
VI. Strategy Optimization Directions
- Optimize Bollinger Bands and RSI parameter settings
- Add stop loss mechanism
- Combine with trend indicators like MACD
- Add combination of short-term and long-term analysis
VII. Summary
This strategy combines the strengths of Bollinger Bands and RSI indicators to trade when both show extremes. This avoids false signals from a single indicator and improves signal accuracy. Compared to previous versions, only establishing long positions reduces trading risk. Future optimizations can be done through parameter tuning, stop loss mechanisms, combining with trend indicators etc. to make the strategy adaptable to different market environments.
Parameters
| Name | Default | What it controls |
|---|---|---|
| v_input_1 | 6 | RSI Period Length |
| v_input_2 | 200 | Bollinger Period Length |
| v_input_3 | true | Enable Bar Color? |
| v_input_4 | true | Enable Background Color? |
Source Pine Script
/*backtest
start: 2023-11-30 00:00:00
end: 2023-12-07 00:00:00
period: 1m
basePeriod: 1m
exchanges: [{"eid":"Futures_Binance","currency":"BTC_USDT"}]
*/

//@version=3
strategy("Bollinger + RSI, Double Strategy Long-Only (by ChartArt) v1.2", shorttitle="CA_-_RSI_Bol_Strat_1.2", overlay=true)

// ChartArt's RSI + Bollinger Bands, Double Strategy UPDATE: Long-Only
//
// Version 1.2
// Idea by ChartArt on October 4, 2017.
//
// This strategy uses the RSI indicator
// together with the Bollinger Bands
// to buy when the price is below the
// lower Bollinger Band (and to close the
// long trade when this value is above
// the upper Bollinger band).
//
// This simple strategy only longs when
// both the RSI and the Bollinger Bands
// indicators are at the same time in
// a oversold condition.
//
// In this new version 1.2 the strategy was
// simplified by going long-only, which made
// it more successful in backtesting.
//
// List of my work:
// https://www.tradingview.com/u/ChartArt/
//
//  __             __  ___       __  ___
// /  ` |__|  /\  |__)  |   /\  |__)  |
// \__, |  | /~~\ |  \  |  /~~\ |  \  |
//
//


///////////// RSI
RSIlength = input(6,title="RSI Period Length")
RSIoverSold = 50
RSIoverBought = 50
price = close
vrsi = rsi(price, RSIlength)


///////////// Bollinger Bands
BBlength = input(200, minval=1,title="Bollinger Period Length")
BBmult = 2 // input(2.0, minval=0.001, maxval=50,title="Bollinger Bands Standard Deviation")
BBbasis = sma(price, BBlength)
BBdev = BBmult * stdev(price, BBlength)
BBupper = BBbasis + BBdev
BBlower = BBbasis - BBdev
source = close
buyEntry = crossover(source, BBlower)
sellEntry = crossunder(source, BBupper)
plot(BBbasis, color=aqua,title="Bollinger Bands SMA Basis Line")
p1 = plot(BBupper, color=silver,title="Bollinger Bands Upper Line")
p2 = plot(BBlower, color=silver,title="Bollinger Bands Lower Line")
fill(p1, p2)


///////////// Colors
switch1=input(true, title="Enable Bar Color?")
switch2=input(true, title="Enable Background Color?")
TrendColor = RSIoverBought and (price[1] > BBupper and price < BBupper) and BBbasis < BBbasis[1] ? red : RSIoverSold and (price[1] < BBlower and price > BBlower) and BBbasis > BBbasis[1] ? green : na
barcolor(switch1?TrendColor:na)
bgcolor(switch2?TrendColor:na,transp=50)


///////////// RSI + Bollinger Bands Strategy
long = (crossover(vrsi, RSIoverSold) and crossover(source, BBlower))
close_long = (crossunder(vrsi, RSIoverBought) and crossunder(source, BBupper))

if (not na(vrsi))

    if long
        strategy.entry("RSI_BB", strategy.long, stop=BBlower, comment="RSI_BB")
    else
        strategy.cancel(id="RSI_BB")

    if close_long
        strategy.close("RSI_BB")


//plot(strategy.equity, title="equity", color=red, linewidth=2, style=areabr)Published by ChaoZhang on the FMZ strategy square · last modified 2023-12-08. Collected in the Quant Trading Vault. Unvalidated research: re-test with your own data and costs before trusting it.
Build this with AgenKit
A spec is not a trading system. Paste this into your coding agent and AgenKit runs a specialist team — architecture, test-first build, risk gates, review — with paper trading on by default.
/agenkit build a production-grade trading bot with a backtest engine, risk controls and paper trading by default from strategies/v12Bollinger-RSI-Double-Strategy-Long-Only-v12.md- npx agenkit install engineering-kit in your project
- Paste the command into your agent and approve each phase
- Get tests, backtest, risk controls and a paper-trading switch
Understand it first
Before you run this, read the lesson behind the idea and how to backtest it honestly. Specs like this one are the survivors of an unknown number of trials; deflate their results accordingly.
Related specs
- Advanced 15 Minute Chart Trading Signal StrategyPine Script · Mean reversion · 3h
- CCTBBO Reversal Tracking StrategyPine Script · Mean reversion · 45m
- Multi Timeframe Gold Reversal Tracking StrategyPine Script · Mean reversion · 2h
- Price Volatility Mean Reversion StrategyPine Script · Mean reversion · 2d
- Reversal Bollinger Band RSI MACD Quant StrategyPine Script · Mean reversion · 4h
- Bollinger Bands and VWAP based Quantitative Trading StrategyPine Script · Mean reversion · 1h