Strategy vault / Trend following
V2An Adaptive ATR ADX Trend Strategy V2
This is a trend following strategy that combines the ATR indicator and the ADX indicator. It dynamically adjusts the ATR multiplier according to market trend conditions to achieve better trend tracking.
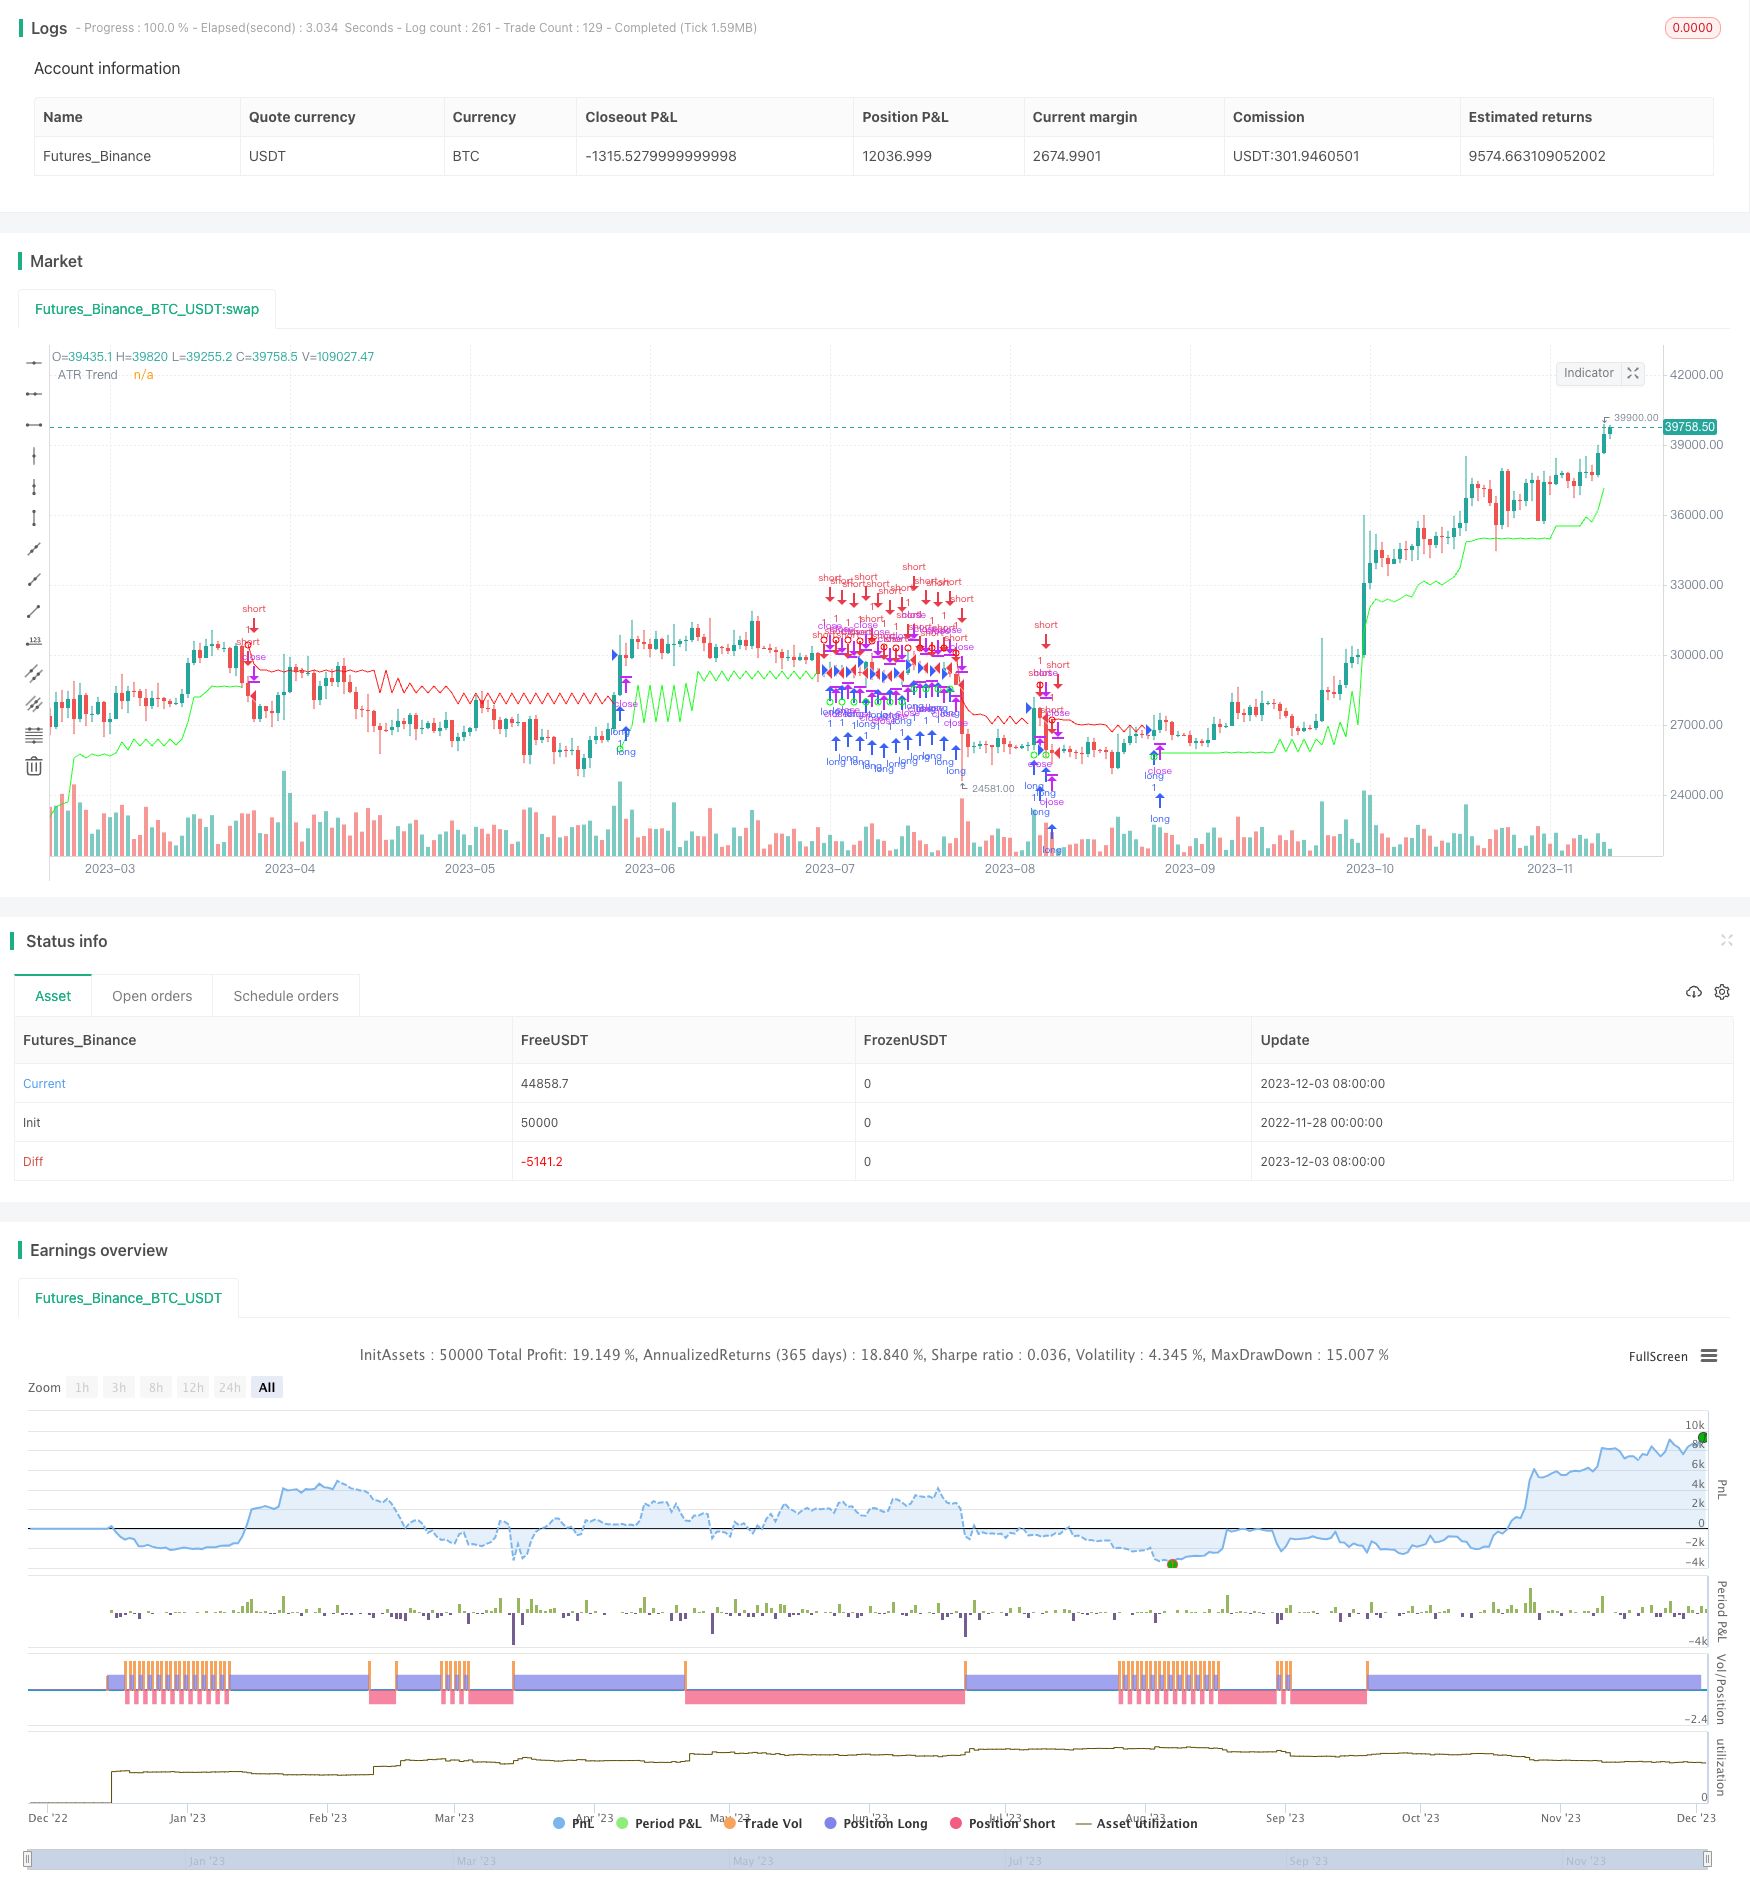
Overview
This is a trend following strategy that combines the ATR indicator and the ADX indicator. It dynamically adjusts the ATR multiplier according to market trend conditions to achieve better trend tracking.
Strategy Logic
The strategy is mainly based on the ATR indicator and the ADX indicator.
Firstly, it calculates the True Range (ATR) and ADX. ATR reflects the volatility of the market while ADX judges the trend strength.
Secondly, it determines the current trend direction according to the difference between DI+ and DI- in the ADX indicator. If DI+ is higher than DI-, it is an uptrend. If DI- is higher than DI+, it is a downtrend.
Then, when ADX is rising, it uses a larger ATR multiplier (m1). When ADX is falling, it uses a smaller ATR multiplier (m2) to achieve dynamic adjustment. This is the core of the strategy.
Finally, combined with ATR and the midpoint of price, it calculates the upper and lower bands to determine the trend direction. When price breaks through the upper band, it goes long. When price breaks through the lower band, it goes short.
So the strategy incorporates ATR and ADX, and by dynamically adjusting ATR parameters, it can better capture trends for trading.
Advantage Analysis
The strategy has several obvious advantages:
- Able to dynamically adjust parameters for better trend capturing
- Combines ATR and ADX for more comprehensive judgment
- Expects controlled drawdowns
- Simple implementation and easy to understand
Therefore, this is a very practical trend following strategy with good drawdown control. Worth recommending.
Risk Analysis
The strategy also has some risks:
- ADX has lagging issues, may miss trend reversal points
- Improper ATR size selection can lead to insufficient profit or oversized stop loss
- Rapid breakout against bands caused by black swan events can lead to losses
So parameter optimization and risk control need attention. Also, black swan events can have greater impact.
Optimization Directions
The strategy can be optimized in the following aspects:
- Optimize parameters of ATR and ADX for better trend capturing
- Add other indicators for confirmation to avoid ADX lagging issues
- Build dynamic stop loss mechanisms to control single trade loss
- Adjust position sizing for different market environments
So there is still much room for optimization by adjusting parameters and mechanisms according to the problems.
Conclusion
In general, this Adaptive ATR-ADX Trend Strategy V2 performs very well. By dynamically adjusting ATR parameters, it captures trends nicely. Also, combining two indicators in ATR and ADX makes it more robust. But we still need to pay attention to risk control and optimization to prevent lagging and oversized losses. Overall, the strategy is well worth learning and applying.
Parameters
| Name | Default | What it controls |
|---|---|---|
| v_input_1_hlc3 | 0 | Source: hlc3 | high | low | open | hl2 | close | hlcc4 | ohlc4 |
| v_input_2 | 21 | ATR |
| v_input_3 | 3.5 | ATR Multiplier - ADX Rising |
| v_input_4 | 1.75 | ATR Multiplier - ADX Falling |
| v_input_5 | 14 | ADX |
| v_input_6 | 30 | ADX Threshold |
| v_input_7 | true | ADX Above Threshold uses ATR Falling Multiplier Even if Rising? |
| v_input_8 | false | Use Heiken-Ashi Bars (Source will be ohlc4) |
Source Pine Script
/*backtest
start: 2022-11-28 00:00:00
end: 2023-12-04 00:00:00
period: 1d
basePeriod: 1h
exchanges: [{"eid":"Futures_Binance","currency":"BTC_USDT"}]
*/

//@version=2
// From mortdiggiddy's indicator to strategy
// See also: https://www.tradingview.com/u/mortdiggiddy/

strategy(title = "Adaptive ATR-ADX Trend V2", shorttitle = "Adaptive ATR V2 Strategy", overlay = true)

//Mode
src = input(title = "Source",  defval = hlc3)
atrLen = input(title = "ATR",  defval = 21, minval = 1, maxval = 100)
m1 = input(title = "ATR Multiplier - ADX Rising", type = float, defval = 3.5, minval = 1, step = 0.1, maxval = 100)
m2 = input(title = "ATR Multiplier - ADX Falling", type = float, defval = 1.75, minval = 1, step = 0.1, maxval = 100)

adxLen = input(title = "ADX",  defval = 14, minval = 1, maxval = 100)
adxThresh = input(title = "ADX Threshold",  defval = 30, minval = 1)
aboveThresh = input(true, title = "ADX Above Threshold uses ATR Falling Multiplier Even if Rising?")
useHeiken = input(false, title = "Use Heiken-Ashi Bars (Source will be ohlc4)")

// DI-Pos, DI-Neg, ADX

hR = change(high)
lR = -change(low)

dmPos = hR > lR ? max(hR, 0) : 0
dmNeg = lR > hR ? max(lR, 0) : 0

sTR = nz(sTR[1]) - nz(sTR[1]) / adxLen + tr
sDMPos = nz(sDMPos[1]) - nz(sDMPos[1]) / adxLen + dmPos
sDMNeg = nz(sDMNeg[1]) - nz(sDMNeg[1]) / adxLen + dmNeg

DIP = sDMPos / sTR * 100
DIN = sDMNeg / sTR * 100
DX = abs(DIP - DIN) / (DIP + DIN) * 100
adx = sma(DX, adxLen)

// Heiken-Ashi

xClose = ohlc4
xOpen = (nz(xOpen[1]) + nz(close[1])) / 2
xHigh = max(high, max(xOpen, xClose))
xLow = min(low, min(xOpen, xClose))

// Trailing ATR

v1 = abs(xHigh - xClose[1])
v2 = abs(xLow - xClose[1])
v3 = xHigh - xLow

trueRange = max(v1, max(v2, v3))
atr = useHeiken ? rma(trueRange, atrLen) : atr(atrLen)

m = rising(adx, 1) and (adx < adxThresh or not aboveThresh) ? m1 : falling(adx, 1) or (adx > adxThresh and aboveThresh) ? m2 : nz(m[1])
mUp = DIP >= DIN ? m : m2
mDn = DIN >= DIP ? m : m2

src_ = useHeiken ? xClose : src
c = useHeiken ? xClose : close
t = useHeiken ? (xHigh + xLow) / 2 : hl2

up = t - mUp * atr
dn = t + mDn * atr

TUp = max(src_[1], c[1]) > TUp[1] ? max(up, TUp[1]) : up
TDown = min(src_[1], c[1]) < TDown[1] ? min(dn, TDown[1]) : dn

trend = min(src_, min(c, close)) > TDown[1] ? 1 : max(src_, max(c, close)) < TUp[1]? -1 : nz(trend[1], 1)
stop = trend == 1 ? TUp : TDown
trendChange = change(trend)

longCondition = (trendChange > 0)
if (longCondition)
    strategy.entry("long", strategy.long)
shortCondition = (trendChange < 0)
if (shortCondition)
    strategy.entry("short", strategy.short)

// Plot

lineColor = not(trendChange) ? trend > 0 ? #00FF00DD : #FF0000DD : #00000000
shapeColor = trendChange ? trendChange > 0 ? #00FF00F8 : #FF0000F8 : #00000000

plot(stop, color = lineColor, style = line, linewidth = 1, title = "ATR Trend")
plotshape(trendChange ? stop : na, style = shape.circle, size = size.tiny, location = location.absolute, color = shapeColor, title = "Change")

alertcondition(trendChange > 0, title = "ATR-ADX Change Up", message = "ATR-ADX Change Up")
alertcondition(trendChange < 0, title = "ATR-ADX Change Down", message = "ATR-ADX Change Down")

// endPublished by ChaoZhang on the FMZ strategy square · last modified 2023-12-05. Collected in the Quant Trading Vault. Unvalidated research: re-test with your own data and costs before trusting it.
Build this with AgenKit
A spec is not a trading system. Paste this into your coding agent and AgenKit runs a specialist team — architecture, test-first build, risk gates, review — with paper trading on by default.
/agenkit build a production-grade trading bot with a backtest engine, risk controls and paper trading by default from strategies/V2An-Adaptive-ATR-ADX-Trend-Strategy-V2.md- npx agenkit install engineering-kit in your project
- Paste the command into your agent and approve each phase
- Get tests, backtest, risk controls and a paper-trading switch
Understand it first
Before you run this, read the lesson behind the idea and how to backtest it honestly. Specs like this one are the survivors of an unknown number of trials; deflate their results accordingly.
Related specs
- DPO EMA Trend Crossover Quantitative Strategy ResearchPine Script · Trend following · 1d
- Adaptive Risk Management Strategy Based on Dynamic ATR and Moving Average CrossoverPine Script · Trend following · 2h
- Dual EMA Filtered ATR Adaptive Trend Following StrategyPine Script · Trend following · 1h
- Multi Dimensional Short Term Trend Predictor Technical Analysis and Volatility Adaptive Trading StrategyPine Script · Trend following · 1h
- Multi Factor Trend Price Action Strategy with Dynamic Risk Management SystemPine Script · Trend following · 2h
- Multi Indicator Dynamic Trend Following Strategy Based on EMA and SMAPine Script · Trend following · 1d