Vector Candle based Channel Breakout and Custom ChoCH Strategy
This strategy combines the concept of Vector Candles with traditional Channel Breakout and Chocolate Sauce (ChoCH) pattern recognition to capture breakout movements in the market. The strategy confirms signals by…
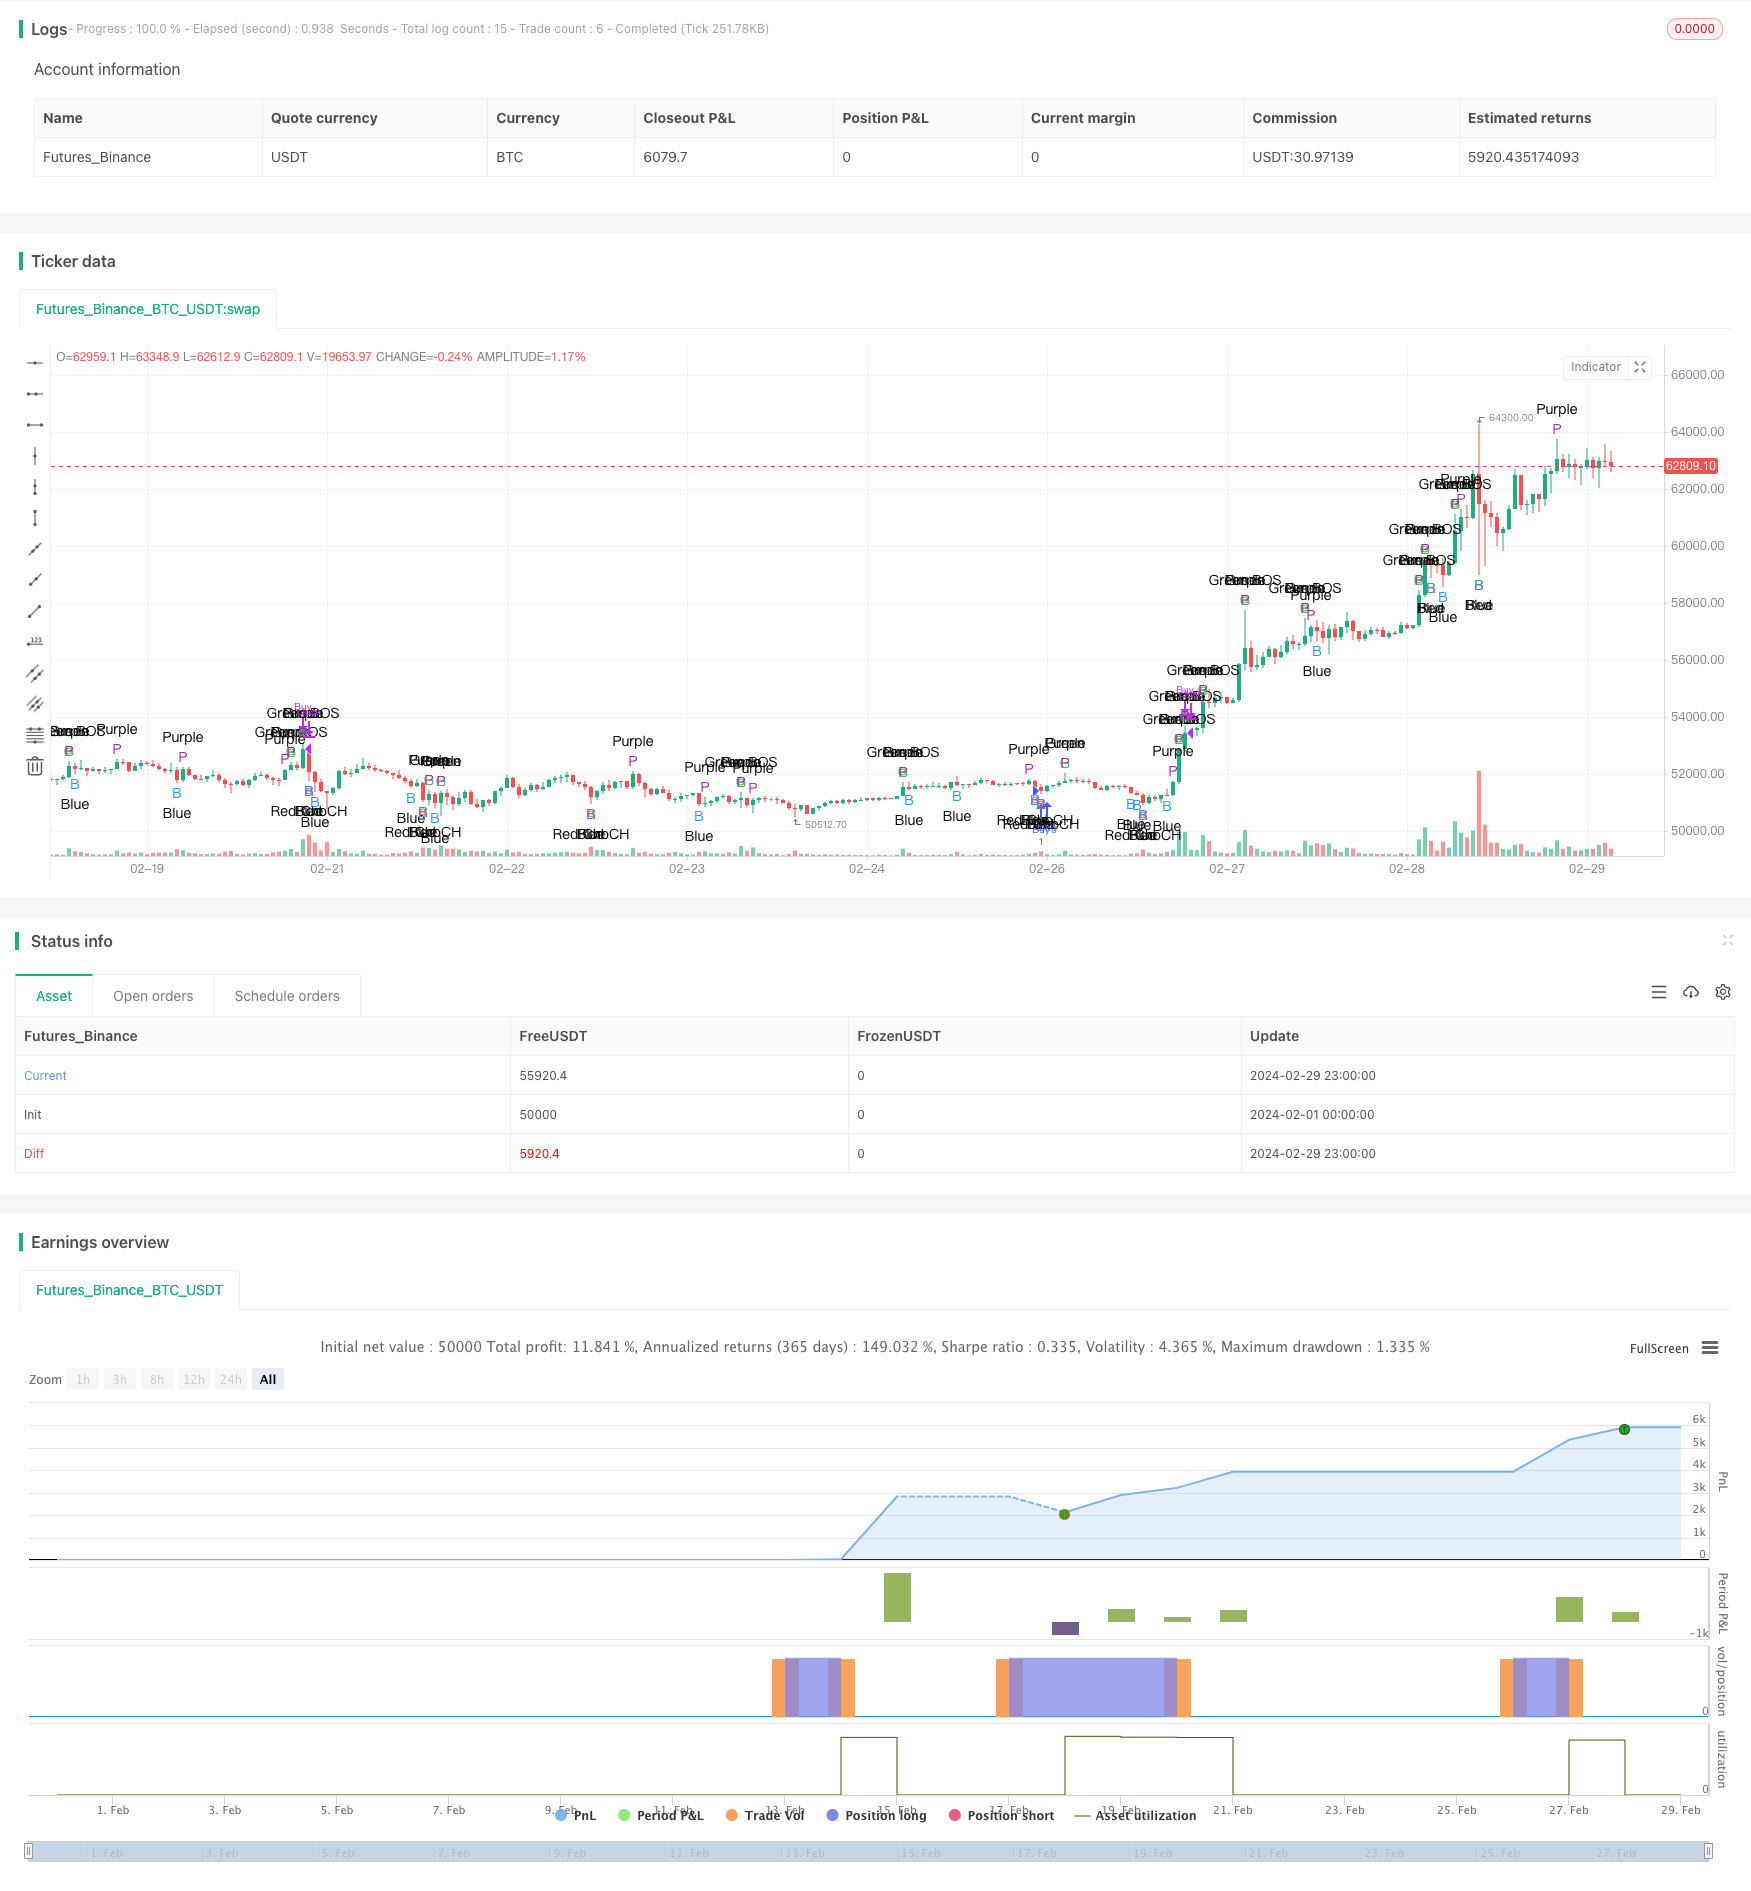
Overview
This strategy combines the concept of Vector Candles with traditional Channel Breakout and Chocolate Sauce (ChoCH) pattern recognition to capture breakout movements in the market. The strategy confirms signals by comparing the closing price with the high and low of the previous candle and using volume-amplified Vector Candles, while also employing a certain number of confirmation candles to filter out noise.
Strategy Principle
- Calculate the average volume of a certain number of past candles and define four different colored Vector Candles (red, green, blue, purple) based on the volume amplification multiple.
- When the closing price is lower than the previous candle's low and it is a red Vector Candle, identify it as a red ChoCH signal; when the closing price is higher than the previous candle's high and it is a green Vector Candle, identify it as a green BOS signal.
- Within a certain number of confirmation candles, if the number of occurrences of red Vector Candles reaches the set threshold, confirm the red ChoCH signal; if the number of occurrences of green Vector Candles reaches the set threshold, confirm the green BOS signal.
- Open a long position when a red ChoCH signal is confirmed, and close the position when a green BOS signal is confirmed.
Strategy Advantages
- Combines Vector Candles with traditional Channel Breakout and ChoCH patterns, improving signal reliability.
- Introduces a confirmation candle mechanism to effectively filter out noise and false signals.
- Distinguishes signals by Vector Candle colors, making them more intuitive and easy to identify.
- Adjustable parameters provide flexibility and can be optimized based on different market conditions and trading styles.
Strategy Risks
- In a choppy market, frequent breakouts and pullbacks may lead to numerous false signals and losing trades.
- Improper setting of the number of confirmation candles may result in signal lag or premature entry.
- Relying solely on technical indicators while ignoring fundamental factors may expose the strategy to unexpected risks.
- The strategy does not include a stop-loss mechanism, potentially incurring significant losses during sharp market reversals.
Strategy Optimization Directions
- Introduce trend confirmation indicators, such as moving averages, to confirm the trend direction after a breakout signal appears, improving signal quality.
- For choppy markets, consider incorporating range trading strategies, such as setting long and short trigger conditions within the channel.
- Optimize the number of confirmation candles to find a suitable balance between effectively filtering noise and avoiding excessive lag.
- Set reasonable stop-loss and take-profit rules to control individual trade risk and overall drawdown.
- Combine with other technical indicators or market sentiment indicators to provide more basis for trading decisions.
Conclusion
This strategy innovatively combines Vector Candles with classic Channel Breakout and ChoCH patterns, enhancing signal reliability and recognizability through color differentiation and a confirmation candle mechanism. The strategy's advantages lie in its clear rules, intuitive signals, and a certain degree of flexibility and optimization potential. However, the strategy also has some limitations and risks, such as subpar performance in choppy markets, insufficient grasp of market trends, and a lack of stop-loss and take-profit management. In the future, the strategy can be refined in terms of trend confirmation, range trading, parameter optimization, risk control, and other aspects to achieve more robust trading performance.
Parameters
| Name | Default | What it controls |
|---|---|---|
| v_input_1 | 10 | Lookback Length for Volume |
| v_input_2 | 2 | Volume Multiplier for Vector Candles |
| v_input_3 | 3 | Confirmation Candles |
Source Pine Script
/*backtest
start: 2024-02-01 00:00:00
end: 2024-02-29 23:59:59
period: 1h
basePeriod: 15m
exchanges: [{"eid":"Futures_Binance","currency":"BTC_USDT"}]
*/

//@version=4
strategy("Custom ChoCH and BOS Strategy with Vector Candles", overlay=true)

// Input Parameters
length = input(10, title="Lookback Length for Volume")
volMultiplier = input(2.0, title="Volume Multiplier for Vector Candles")
confirmationCandles = input(3, title="Confirmation Candles")

// Calculate the average volume of the last 'length' candles
avgVol = sma(volume, length)

// Vector Candle Definitions
vectorCandleRed = (close < open) and (volume > avgVol * volMultiplier) ? 1.0 : 0.0
vectorCandleGreen = (close > open) and (volume > avgVol * volMultiplier) ? 1.0 : 0.0
vectorCandleBlue = (close < open) and (volume > avgVol * 1.5) ? 1.0 : 0.0 // 150% volume for blue
vectorCandlePurple = (close > open) and (volume > avgVol * 1.5) ? 1.0 : 0.0 // 150% volume for purple

// Detecting BOS and ChoCH
isRedChoCH = vectorCandleRed > 0 and (close < low[1]) // Red ChoCH
isGreenBOS = vectorCandleGreen > 0 and (close > high[1]) // Green BOS

// Confirmation Logic
redChoCHConfirmed = (sum(vectorCandleRed, confirmationCandles) >= 2) ? 1.0 : 0.0
greenBOSConfirmed = (sum(vectorCandleGreen, confirmationCandles) >= 2) ? 1.0 : 0.0

// Entry Conditions
buyCondition = redChoCHConfirmed > 0
sellCondition = greenBOSConfirmed > 0

// Strategy Execution
if (buyCondition)
    strategy.entry("Buy", strategy.long)
if (sellCondition)
    strategy.close("Buy")

// Plotting Vector Candles and Signals
plotshape(series=isRedChoCH, title="Red ChoCH Signal", location=location.belowbar, color=color.red, style=shape.circle, text="Red ChoCH")
plotshape(series=isGreenBOS, title="Green BOS Signal", location=location.abovebar, color=color.green, style=shape.circle, text="Green BOS")

// Plotting Vector Candles for Visualization
plotchar(vectorCandleRed > 0, title="Vector Candle Red", location=location.belowbar, color=color.red, char='R', text="Red")
plotchar(vectorCandleGreen > 0, title="Vector Candle Green", location=location.abovebar, color=color.green, char='G', text="Green")
plotchar(vectorCandleBlue > 0, title="Vector Candle Blue", location=location.belowbar, color=color.blue, char='B', text="Blue")
plotchar(vectorCandlePurple > 0, title="Vector Candle Purple", location=location.abovebar, color=color.purple, char='P', text="Purple")
Published by ChaoZhang on the FMZ strategy square · last modified 2024-03-29. Collected in the Quant Trading Vault. Unvalidated research: re-test with your own data and costs before trusting it.
Build this with AgenKit
A spec is not a trading system. Paste this into your coding agent and AgenKit runs a specialist team — architecture, test-first build, risk gates, review — with paper trading on by default.
/agenkit build a production-grade trading bot with a backtest engine, risk controls and paper trading by default from strategies/Vector-Candle-based-Channel-Breakout-and-Custom-ChoCH-Strategy.md- npx agenkit install engineering-kit in your project
- Paste the command into your agent and approve each phase
- Get tests, backtest, risk controls and a paper-trading switch
Understand it first
Before you run this, read the lesson behind the idea and how to backtest it honestly. Specs like this one are the survivors of an unknown number of trials; deflate their results accordingly.
Related specs
- 5 Day Moving Average Channel Breakout Strategy Combined With Mileage ConceptPine Script · Breakout · 1d
- Adaptive Bollinger Breakout with Moving Average Quantitative Strategy SystemPine Script · Breakout · 1h
- Adaptive Multi Period Trading Strategy Based on Wave Trend Momentum BreakoutPine Script · Breakout · 2h
- Adaptive Trading Strategy Based on ADX IndicatorPine Script · Breakout · 1d
- Average Line Breakthrough StrategyPine Script · Breakout · 1d
- BB Breakout StrategyPine Script · Breakout · 1d