Vishal Adaptive Multi Indicator Trading Strategy
This strategy is a comprehensive quantitative trading method that integrates multiple technical indicators (MACD, Supertrend, and Parabolic SAR) to identify market trends and trading signals. The strategy aims to…
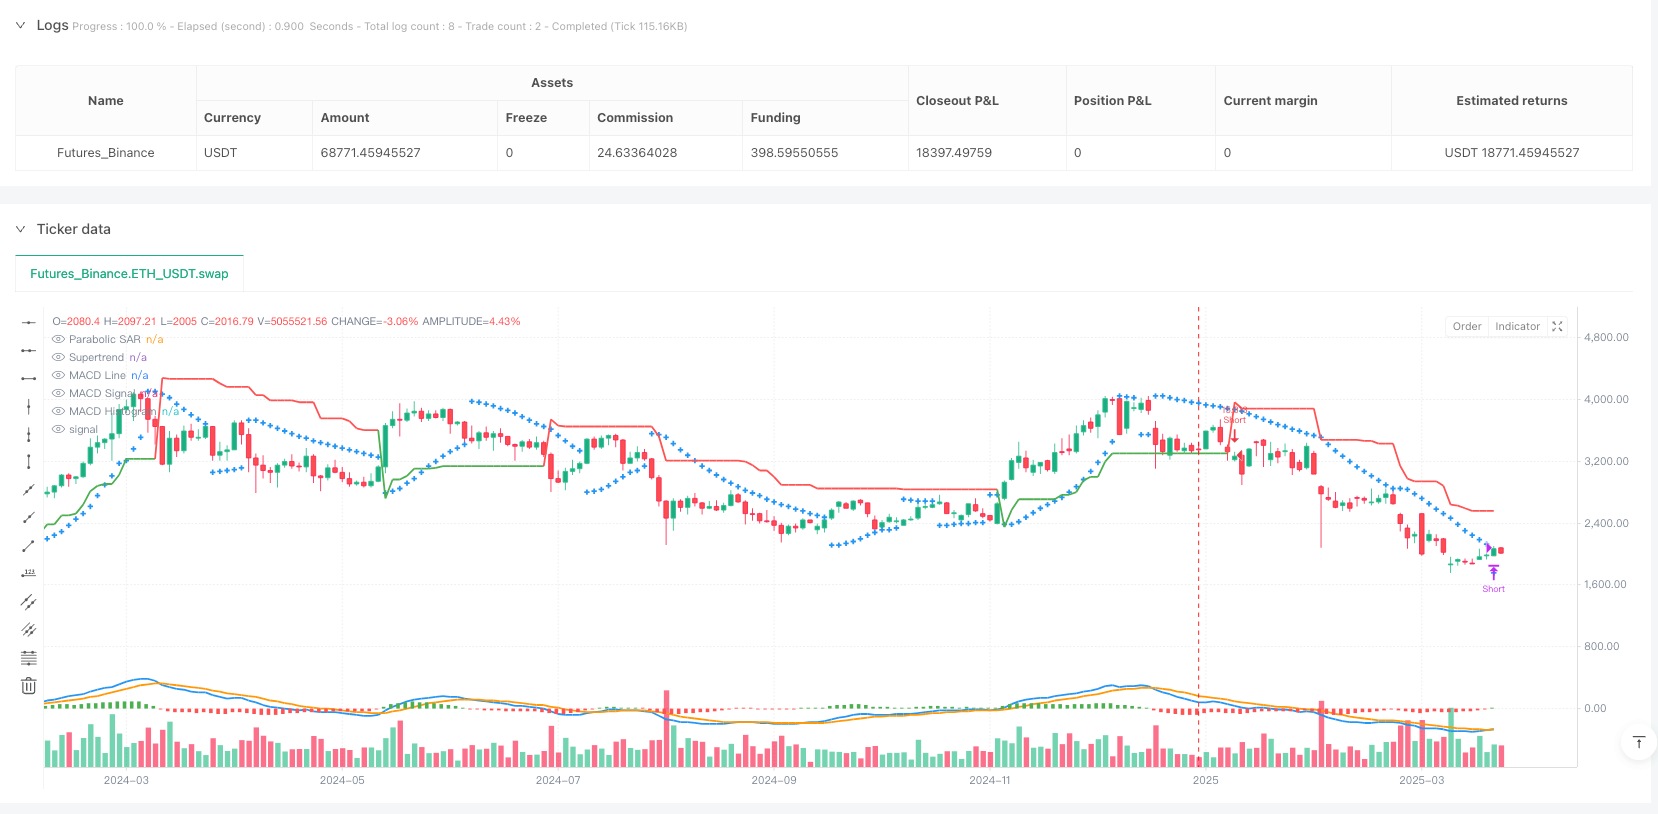
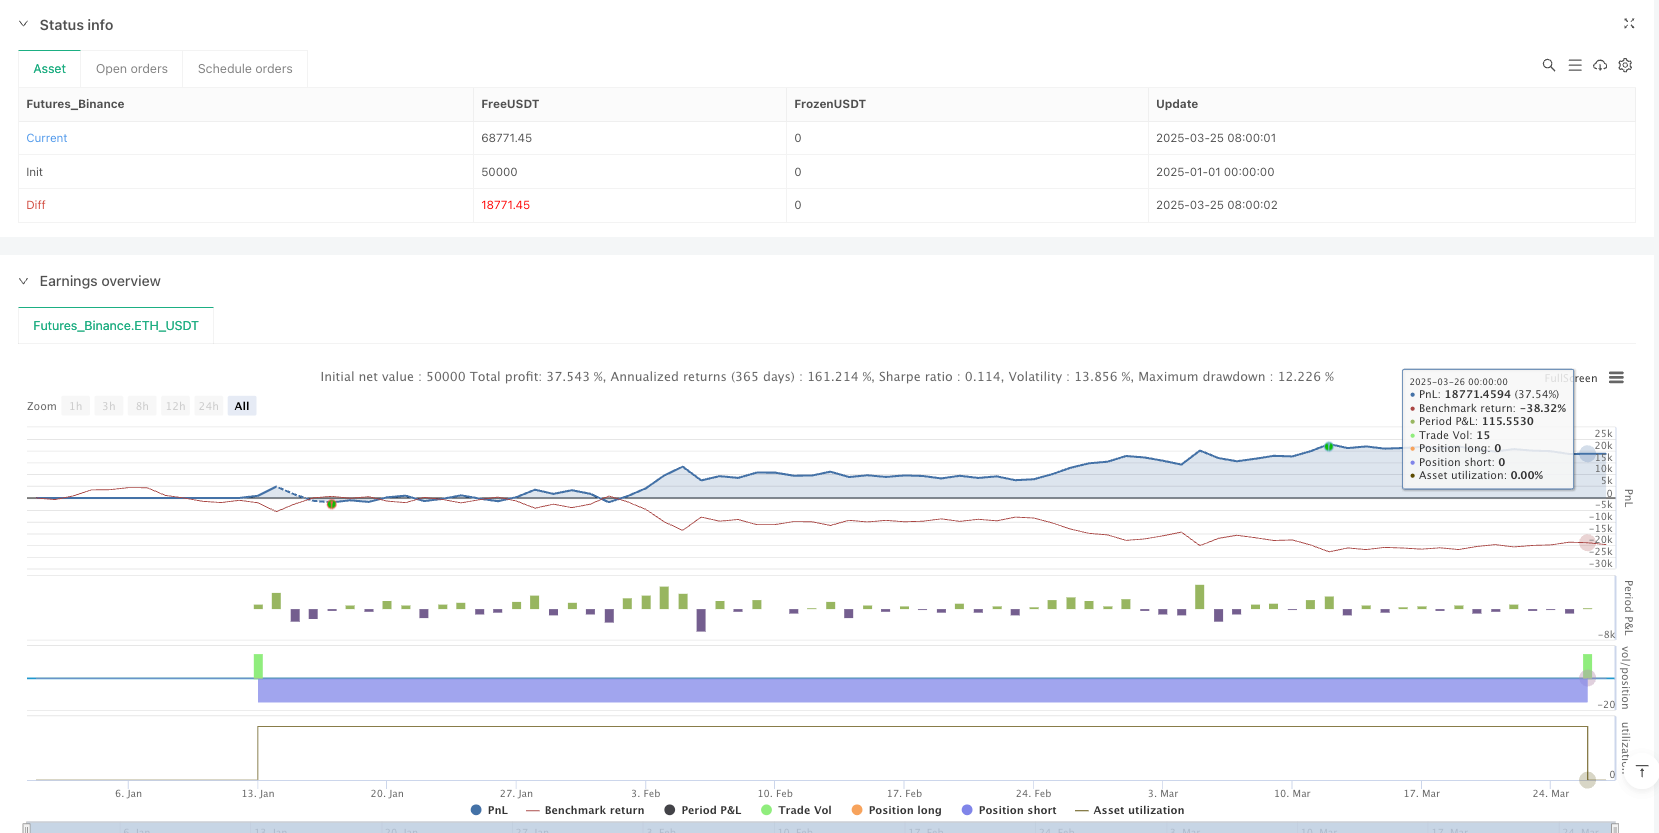
Overview
This strategy is a comprehensive quantitative trading method that integrates multiple technical indicators (MACD, Supertrend, and Parabolic SAR) to identify market trends and trading signals. The strategy aims to provide a flexible and rigorous decision-making framework adaptable to different market environments.
Strategy Principles
The strategy is based on the dynamic combination of three key technical indicators:
- MACD Indicator: Evaluates price momentum and trend direction
- Supertrend Indicator: Determines the dominant market trend (bullish or bearish)
- Parabolic SAR: Provides precise entry and exit signals
The strategy makes trading decisions through the following logic:
- Long Entry Conditions:
- MACD line above signal line
- Supertrend is green (bullish)
- Closing price above Parabolic SAR
- Short Entry Conditions:
- MACD line below signal line
- Supertrend is red (bearish)
- Closing price below Parabolic SAR
Strategy Advantages
- Multi-indicator Verification: Reduces false signal risk
- Flexible Signal Triggering: No strict order requirement for indicators
- Full Position Trading Strategy: Maximizes potential earnings per trade
- Symmetric Trading Logic: Consistent performance in bullish and bearish markets
- Dynamic Exit Mechanism: Confirms exit through two consecutive candles
Strategy Risks
- Indicator Lag Risk: Technical indicators based on historical data may have delays
- Full Position Trading Risk: Lack of stop-loss can lead to significant capital fluctuations
- Severe Market Volatility Risk: Complex market environments may affect strategy performance
- Parameter Sensitivity: Indicator parameter selection directly impacts strategy effectiveness
Strategy Optimization Directions
- Introduce Dynamic Position Management: Adjust position size based on market volatility
- Add Stop-Loss Mechanism: Reduce maximum loss per trade
- Optimize Indicator Parameters: Find the best parameter combination through backtesting
- Introduce Additional Filter Conditions: Such as trading volume, volatility indicators
- Increase Multi-Timeframe Verification: Improve signal reliability
Summary
The Vishal Adaptive Multi-Indicator Trading Strategy is an innovative quantitative trading approach that provides a comprehensive and flexible trading decision framework through the synergistic action of MACD, Supertrend, and Parabolic SAR. Despite certain risks, its multi-indicator verification and symmetric trading logic offer investors a trading model worth in-depth research.
Source Pine Script
/*backtest
start: 2025-01-01 00:00:00
end: 2025-03-27 00:00:00
period: 2d
basePeriod: 2d
exchanges: [{"eid":"Futures_Binance","currency":"ETH_USDT"}]
*/

//@version=6
strategy("Vishal Strategy", overlay=true, margin_long=100, margin_short=100, initial_capital=100000, default_qty_type=strategy.percent_of_equity, default_qty_value=100)

// **MACD Inputs & Calculation**
fast_length  = input.int(13, title="MACD Fast Length")
slow_length  = input.int(27, title="MACD Slow Length")
signal_length = input.int(9, title="MACD Signal Smoothing")

fast_ma  = ta.ema(close, fast_length)
slow_ma  = ta.ema(close, slow_length)
macd     = fast_ma - slow_ma
signal   = ta.ema(macd, signal_length)
hist     = macd - signal

// **Supertrend Inputs & Calculation**
atrPeriod = input.int(11,    "ATR Length", minval = 1)
factor    = input.float(3.0, "Factor",     minval = 0.01, step = 0.01)
[supertrend, direction] = ta.supertrend(factor, atrPeriod)
bullTrend  = direction < 0   // Uptrend Condition
bearTrend  = direction > 0   // Downtrend Condition

// **Parabolic SAR Inputs & Calculation**
sarStep = input.float(0.02, "Parabolic SAR Step")
sarMax  = input.float(0.2, "Parabolic SAR Max")
sar = ta.sar(sarStep, sarStep, sarMax)

// **Trade Entry Conditions**
macdBullish = macd > signal // MACD in Bullish Mode
macdBearish = macd < signal // MACD in Bearish Mode
priceAboveSAR = close > sar // Price above SAR (Bullish)
priceBelowSAR = close < sar // Price below SAR (Bearish)

// **Boolean Flags to Track Conditions Being Met**
var bool macdConditionMet = false
var bool sarConditionMet = false
var bool trendConditionMet = false

// **Track if Each Condition is Met in Any Order**
if (macdBullish)
    macdConditionMet := true
if (macdBearish)
    macdConditionMet := false

if (priceAboveSAR)
    sarConditionMet := true
if (priceBelowSAR)
    sarConditionMet := false

if (bullTrend)
    trendConditionMet := true
if (bearTrend)
    trendConditionMet := false

// **Final Long Entry Signal (Triggers When All Three Flags Are True)**
longSignal = macdConditionMet and sarConditionMet and trendConditionMet

// **Final Short Entry Signal (Triggers When All Three Flags Are False)**
shortSignal = not macdConditionMet and not sarConditionMet and not trendConditionMet

// **Execute Full Equity Trades**
if (longSignal)
    strategy.entry("Long", strategy.long)

if (shortSignal)
    strategy.entry("Short", strategy.short)

// **Exit Logic - Requires 2 Consecutive Candle Closes Below/Above SAR**
var int belowSARCount = 0
var int aboveSARCount = 0

if (strategy.position_size > 0)  // Long position is active
    belowSARCount := close < sar ? belowSARCount + 1 : 0
    if (belowSARCount >= 1)
        strategy.close("Long")

if (strategy.position_size < 0)  // Short position is active
    aboveSARCount := close > sar ? aboveSARCount + 1 : 0
    if (aboveSARCount >= 1)
        strategy.close("Short")

// **Plot Indicators**
plot(supertrend, title="Supertrend", color=bullTrend ? color.green : color.red, linewidth=2, style=plot.style_linebr)
plot(sar, title="Parabolic SAR", color=color.blue, style=plot.style_cross, linewidth=2)
plot(macd, title="MACD Line", color=color.blue, linewidth=2)
plot(signal, title="MACD Signal", color=color.orange, linewidth=2)
plot(hist, title="MACD Histogram", style=plot.style_columns, color=hist >= 0 ? color.green : color.red)
Published by ianzeng123 on the FMZ strategy square · last modified 2025-03-28. Collected in the Quant Trading Vault. Unvalidated research: re-test with your own data and costs before trusting it.
Build this with AgenKit
A spec is not a trading system. Paste this into your coding agent and AgenKit runs a specialist team — architecture, test-first build, risk gates, review — with paper trading on by default.
/agenkit build a production-grade trading bot with a backtest engine, risk controls and paper trading by default from strategies/Vishal-Adaptive-Multi-Indicator-Trading-Strategy.md- npx agenkit install engineering-kit in your project
- Paste the command into your agent and approve each phase
- Get tests, backtest, risk controls and a paper-trading switch
Understand it first
Before you run this, read the lesson behind the idea and how to backtest it honestly. Specs like this one are the survivors of an unknown number of trials; deflate their results accordingly.
Related specs
- Advanced Multi Indicator Trend Following and Momentum Quantitative Trading StrategyPine Script · Momentum · 1h
- Multi Indicator Comprehensive Analysis Quantitative Trading Strategy Trend Momentum and Volatility Collaborative Prediction ModelPine Script · Momentum · 3m
- Momentum Trend Following Dual Indicator MACD and Parabolic SAR Combination StrategyPine Script · Momentum · 1d
- Oscillator Candles Momentum Trading StrategyPine Script · Momentum · 1h
- STEM and MATCS Combined Momentum Trading StrategyPine Script · Momentum · 1h
- KST EMA Momentum Trend Following StrategyPine Script · Momentum · 1d