Strategy vault / Machine learning
Vix Fix Linear Regression Bottom Fishing Strategy
The core idea of this strategy is to combine Vix Fix indicator and its linear regression to accurately capture market bottoms. The strategy is named "Fix Regression Bottom Fishing Strategy".
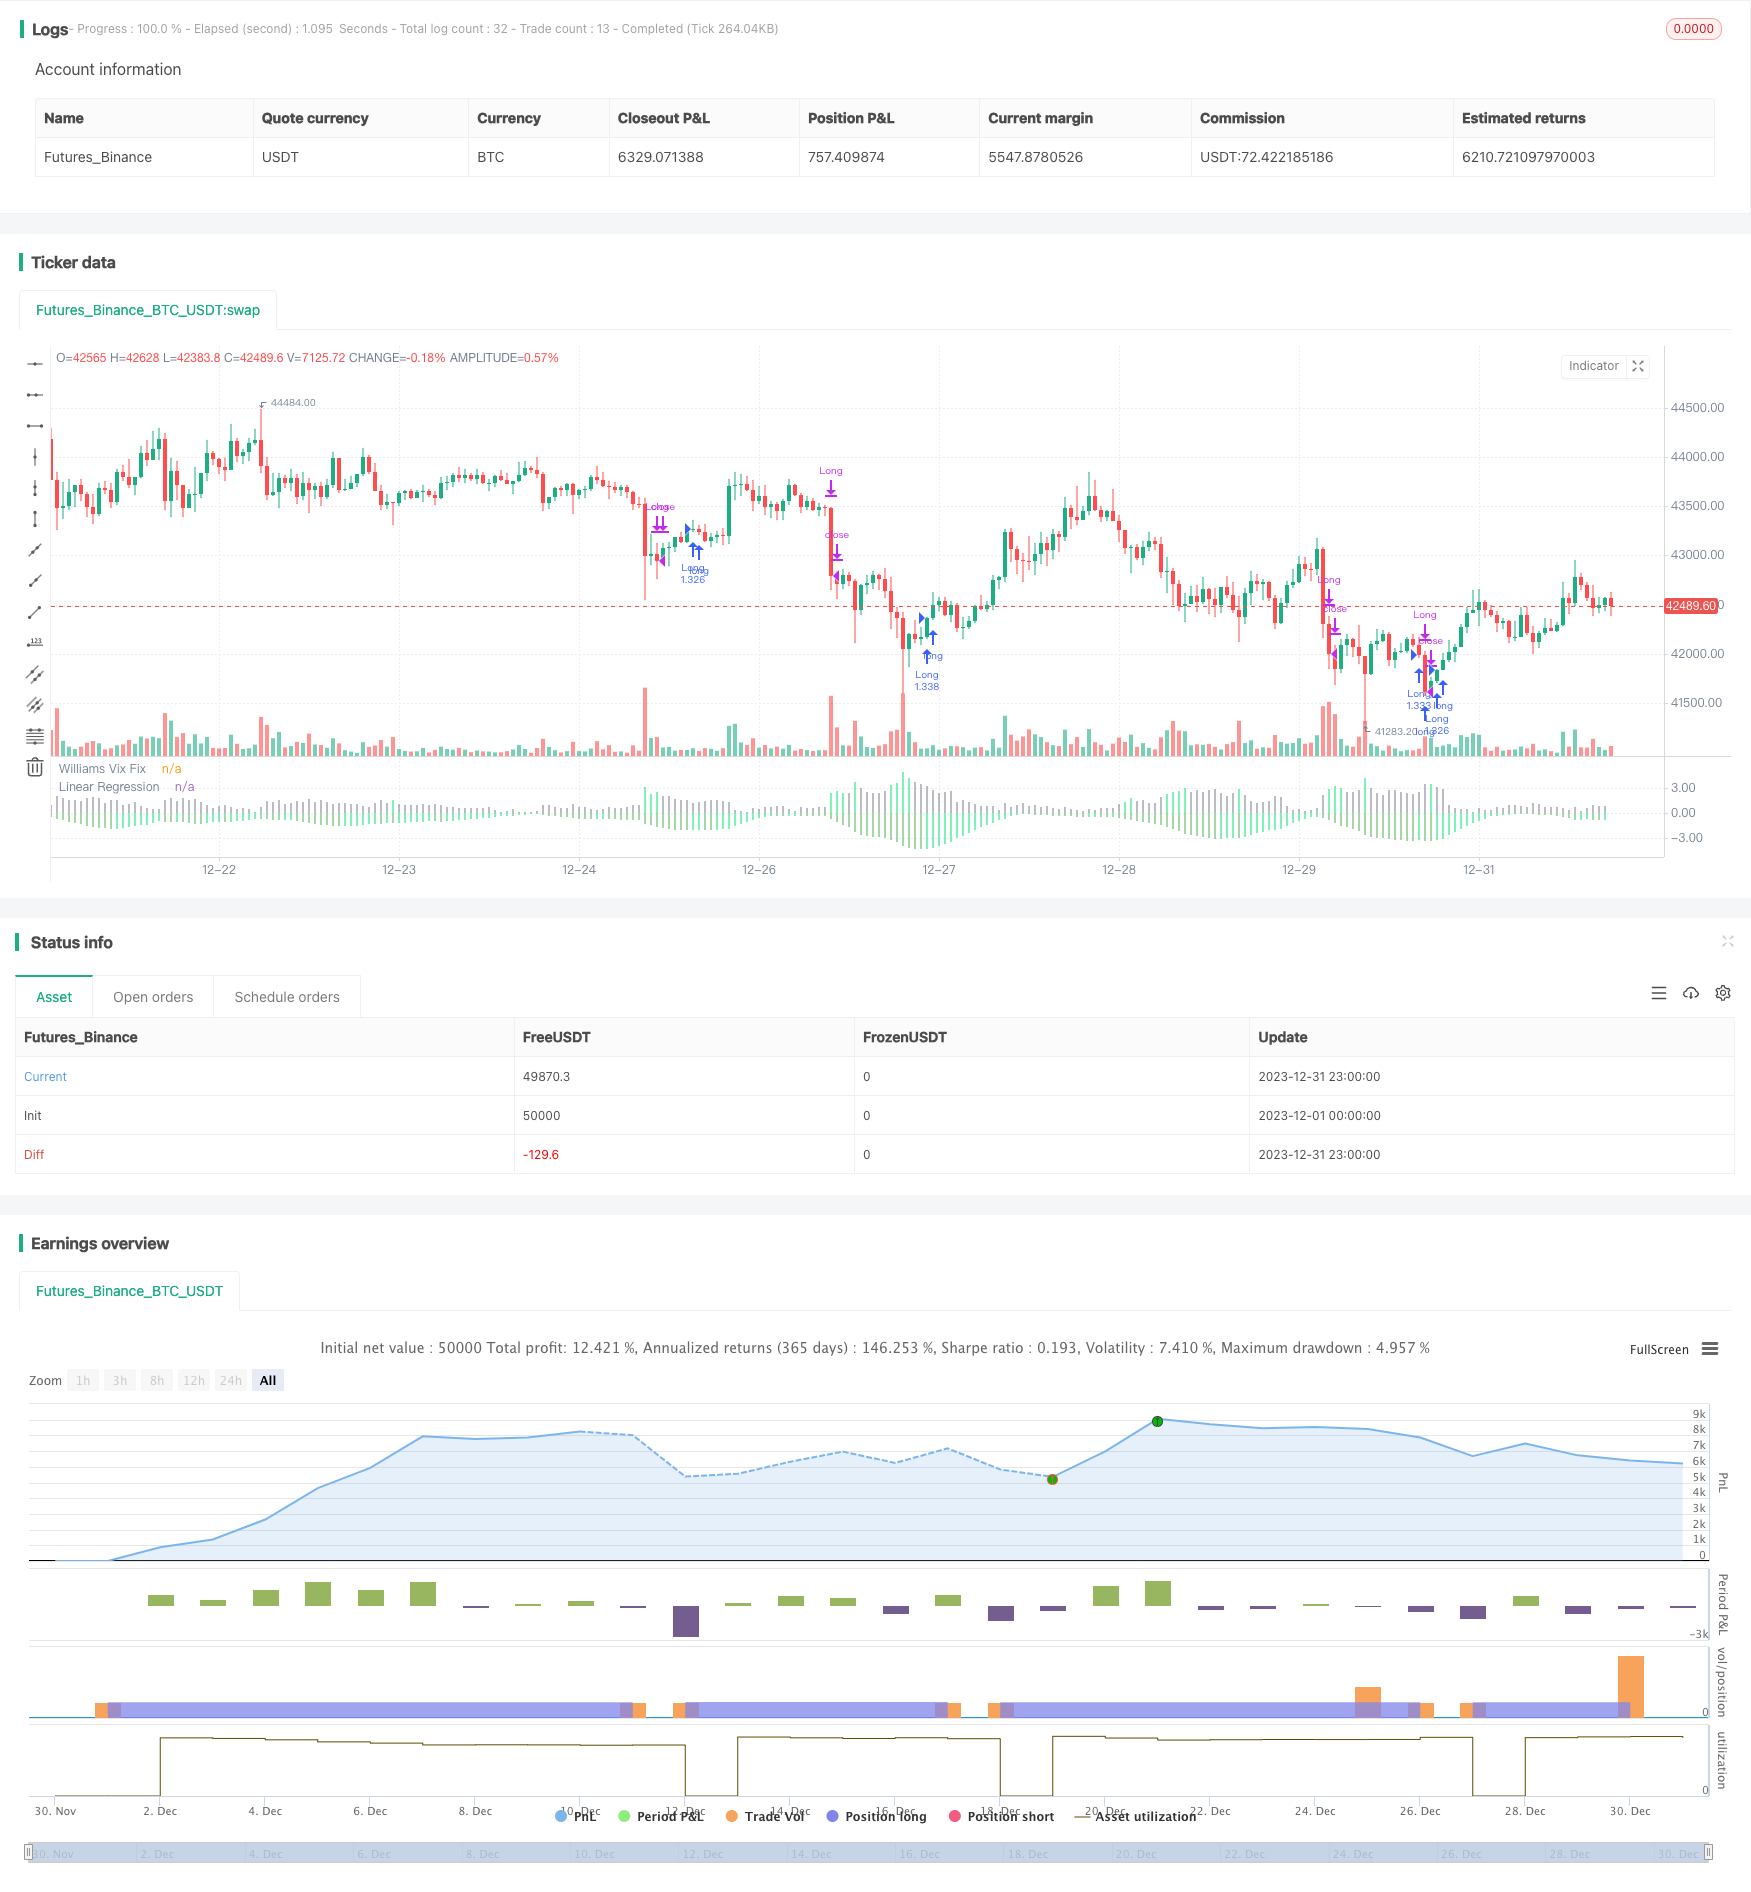
Overview
The core idea of this strategy is to combine Vix Fix indicator and its linear regression to accurately capture market bottoms. The strategy is named "Fix Regression Bottom Fishing Strategy".
Strategy Logic
- Calculate the Vix Fix indicator, which is good at judging market bottoms
- Apply linear regression on Vix Fix. When the linear regression histogram color turns green, it means the Vix Fix linear regression starts to rise, a buy signal can be triggered
- Combine with the green columns of the Vix Fix indicator to further confirm the timing of entries
- When the linear regression histogram color turns red, it means the Vix Fix linear regression starts to decline, a sell signal is triggered
The above process utilizes linear regression to improve the accuracy and timeliness of Vix Fix signals, filtering out some false signals, and thus accurately capturing bottoms.
Advantage Analysis
- The strategy uses linear regression to filter out some false signals of the Vix Fix indicator, making buy/sell signals more accurate and reliable
- Linear regression improves the sensitivity and timeliness of signals, and can quickly capture market turning points
- The strategy logic is simple and clear, easy to understand and implement, suitable for quantitative trading
- There are many configurable parameters that can be flexibly adjusted to adapt to market changes
Risks and Solutions
- This strategy is mainly used to determine the overall market bottom, not suitable for individual stocks
- Linear regression cannot completely filter out false signals. Combining with the Vix Fix indicator can reduce risks
- Need to properly adjust parameters to adapt to market changes and avoid failure
- It is recommended to combine with other indicators to further confirm signals
Optimization Directions
- Consider combining with volatility indicators or on-balance volume indicators to further filter out signals
- Study parameter adaptive optimization methods to make the strategy more intelligent
- Explore machine learning methods to predict Vix Fix trends with more complex models
- Try to apply similar methods to individual stocks to study how to filter false signals
Conclusion
This strategy utilizes the Vix Fix indicator to judge bottoms while introducing linear regression to improve signal quality, thereby effectively capturing market bottoms. The strategy is simple, practical and yields decent results. The main risk lies in the false signals that fail to be completely filtered out. We still need to optimize parameter settings and consider introducing other means to further confirm signals to make the strategy more robust. Overall, this strategy provides a new effective way to determine market bottoms, and is worth further research.
Parameters
| Name | Default | What it controls |
|---|---|---|
| v_input_1 | 22 | LookBack Period Standard Deviation High |
| v_input_2 | 20 | Bolinger Band Length |
| v_input_3 | 2 | Bollinger Band Standard Devaition Up |
| v_input_4 | 50 | Look Back Period Percentile High |
| v_input_5 | 0.85 | Highest Percentile - 0.90=90%, 0.95=95%, 0.99=99% |
| v_input_6 | 1.01 | Lowest Percentile - 1.10=90%, 1.05=95%, 1.01=99% |
| v_input_7 | false | Show High Range - Based on Percentile and LookBack Period? |
| v_input_8 | false | Show Standard Deviation Line? |
| v_input_9 | timestamp(01 Jan 2010 00:00 +0000) | Start Time |
| v_input_10 | timestamp(01 Jan 2099 00:00 +0000) | End Time |
| v_input_11 | false | considerVIXFixClose |
| v_input_12 | 20 | KC Length |
| v_input_13 | 1.5 | KC MultFactor |
| v_input_14 | 22 | atrLen |
| v_input_15 | 5 | atrMult |
| v_input_16 | 5 | initialStopBar |
| v_input_17 | true | waitForCloseBeforeStop |
Source Pine Script
/*backtest
start: 2023-12-01 00:00:00
end: 2023-12-31 23:59:59
period: 1h
basePeriod: 15m
exchanges: [{"eid":"Futures_Binance","currency":"BTC_USDT"}]
*/

// This source code is subject to the terms of the Mozilla Public License 2.0 at https://mozilla.org/MPL/2.0/
// © HeWhoMustNotBeNamed

//@version=4
strategy("VixFixLinReg-Strategy", shorttitle="VixFixLinReg - Strategy",
                     overlay=false, initial_capital = 100000,
                     default_qty_type = strategy.percent_of_equity, default_qty_value = 100, commission_type = strategy.commission.percent, pyramiding = 1,
                     commission_value = 0.01)
pd = input(22, title="LookBack Period Standard Deviation High")
bbl = input(20, title="Bolinger Band Length")
mult = input(2.0    , minval=1, maxval=5, title="Bollinger Band Standard Devaition Up")
lb = input(50  , title="Look Back Period Percentile High")
ph = input(.85, title="Highest Percentile - 0.90=90%, 0.95=95%, 0.99=99%")
pl = input(1.01, title="Lowest Percentile - 1.10=90%, 1.05=95%, 1.01=99%")
hp = input(false, title="Show High Range - Based on Percentile and LookBack Period?")
sd = input(false, title="Show Standard Deviation Line?")
i_startTime = input(defval = timestamp("01 Jan 2010 00:00 +0000"), title = "Start Time", type = input.time)
i_endTime = input(defval = timestamp("01 Jan 2099 00:00 +0000"), title = "End Time", type = input.time)
inDateRange = true
considerVIXFixClose = input(false)
lengthKC=input(20, title="KC Length")
multKC = input(1.5, title="KC MultFactor")

atrLen = input(22)
atrMult = input(5)
initialStopBar = input(5)
waitForCloseBeforeStop = input(true)
f_getStop(atrLen, atrMult)=>
    stop = strategy.position_size > 0 ? close - (atrMult * atr(atrLen)) : lowest(initialStopBar)
    stop := strategy.position_size > 0 ? max(stop,nz(stop[1], stop)) : lowest(initialStopBar)
    stop

wvf = ((highest(close, pd)-low)/(highest(close, pd)))*100

sDev = mult * stdev(wvf, bbl)
midLine = sma(wvf, bbl)
lowerBand = midLine - sDev
upperBand = midLine + sDev

rangeHigh = (highest(wvf, lb)) * ph
rangeLow = (lowest(wvf, lb)) * pl


col = wvf >= upperBand or wvf >= rangeHigh ? color.lime : color.gray

val = linreg(wvf, pd, 0)
absVal = abs(val)

linRegColor = val>val[1]? (val > 0 ? color.green : color.orange): (val > 0 ? color.lime : color.red)
plot(hp and rangeHigh ? rangeHigh : na, title="Range High Percentile", style=plot.style_line, linewidth=4, color=color.orange)
plot(hp and rangeLow ? rangeLow : na, title="Range High Percentile", style=plot.style_line, linewidth=4, color=color.orange)
plot(wvf, title="Williams Vix Fix", style=plot.style_histogram, linewidth = 4, color=col)
plot(sd and upperBand ? upperBand : na, title="Upper Band", style=plot.style_line, linewidth = 3, color=color.aqua)

plot(-absVal, title="Linear Regression", style=plot.style_histogram, linewidth=4, color=linRegColor)

vixFixState = (col == color.lime) ? 1: 0
vixFixState := strategy.position_size == 0? max(vixFixState, nz(vixFixState[1],0)) : vixFixState

longCondition = (vixFixState == 1 and linRegColor == color.lime) and inDateRange
exitLongCondition = (linRegColor == color.orange or linRegColor == color.red) and considerVIXFixClose

stop = f_getStop(atrLen, atrMult)
label_x = time+(60*60*24*1000*20)
myLabel = label.new(x=label_x, y=0, text="Stop : "+tostring(stop), xloc=xloc.bar_time, style=label.style_none, textcolor=color.black, size=size.normal)
label.delete(myLabel[1])
strategy.entry("Long", strategy.long, when=longCondition, oca_name="oca_buy")
strategy.close("Long", when=exitLongCondition or (close < stop and waitForCloseBeforeStop and linRegColor == color.green))
strategy.exit("ExitLong", "Long", stop = stop, when=not waitForCloseBeforeStop and linRegColor == color.green)Published by ChaoZhang on the FMZ strategy square · last modified 2024-01-30. Collected in the Quant Trading Vault. Unvalidated research: re-test with your own data and costs before trusting it.
Build this with AgenKit
A spec is not a trading system. Paste this into your coding agent and AgenKit runs a specialist team — architecture, test-first build, risk gates, review — with paper trading on by default.
/agenkit build a production-grade trading bot with a backtest engine, risk controls and paper trading by default from strategies/Vix-Fix-Linear-Regression-Bottom-Fishing-Strategy.md- npx agenkit install engineering-kit in your project
- Paste the command into your agent and approve each phase
- Get tests, backtest, risk controls and a paper-trading switch
Understand it first
Before you run this, read the lesson behind the idea and how to backtest it honestly. Specs like this one are the survivors of an unknown number of trials; deflate their results accordingly.
Related specs
- Dynamic Price Swing Oscillator StrategyPine Script · Machine learning · 1m
- Bollinger Bands ATR Trailing Stop StrategyPine Script · Machine learning · 1m
- Dual Moving Average Matching Strategy Based on Bollinger BandsPine Script · Machine learning · 1h
- High Frequency Hybrid Technical Analysis Quantitative StrategyPine Script · Machine learning · 15m
- Bollinger Bands Fibonacci Retracement Trading StrategyPine Script · Machine learning · 2h
- Bull Bear Power Trading Strategy with Volume Percentile Based Dynamic Take Profit SystemPine Script · Machine learning · 1d