Volatility Stop Tracking Strategy
This is a trend tracking stop loss strategy based on price volatility. It uses Average True Range (ATR) to set stop loss lines for price fluctuations. ATR reflects the volatility and risk level of prices. When the…
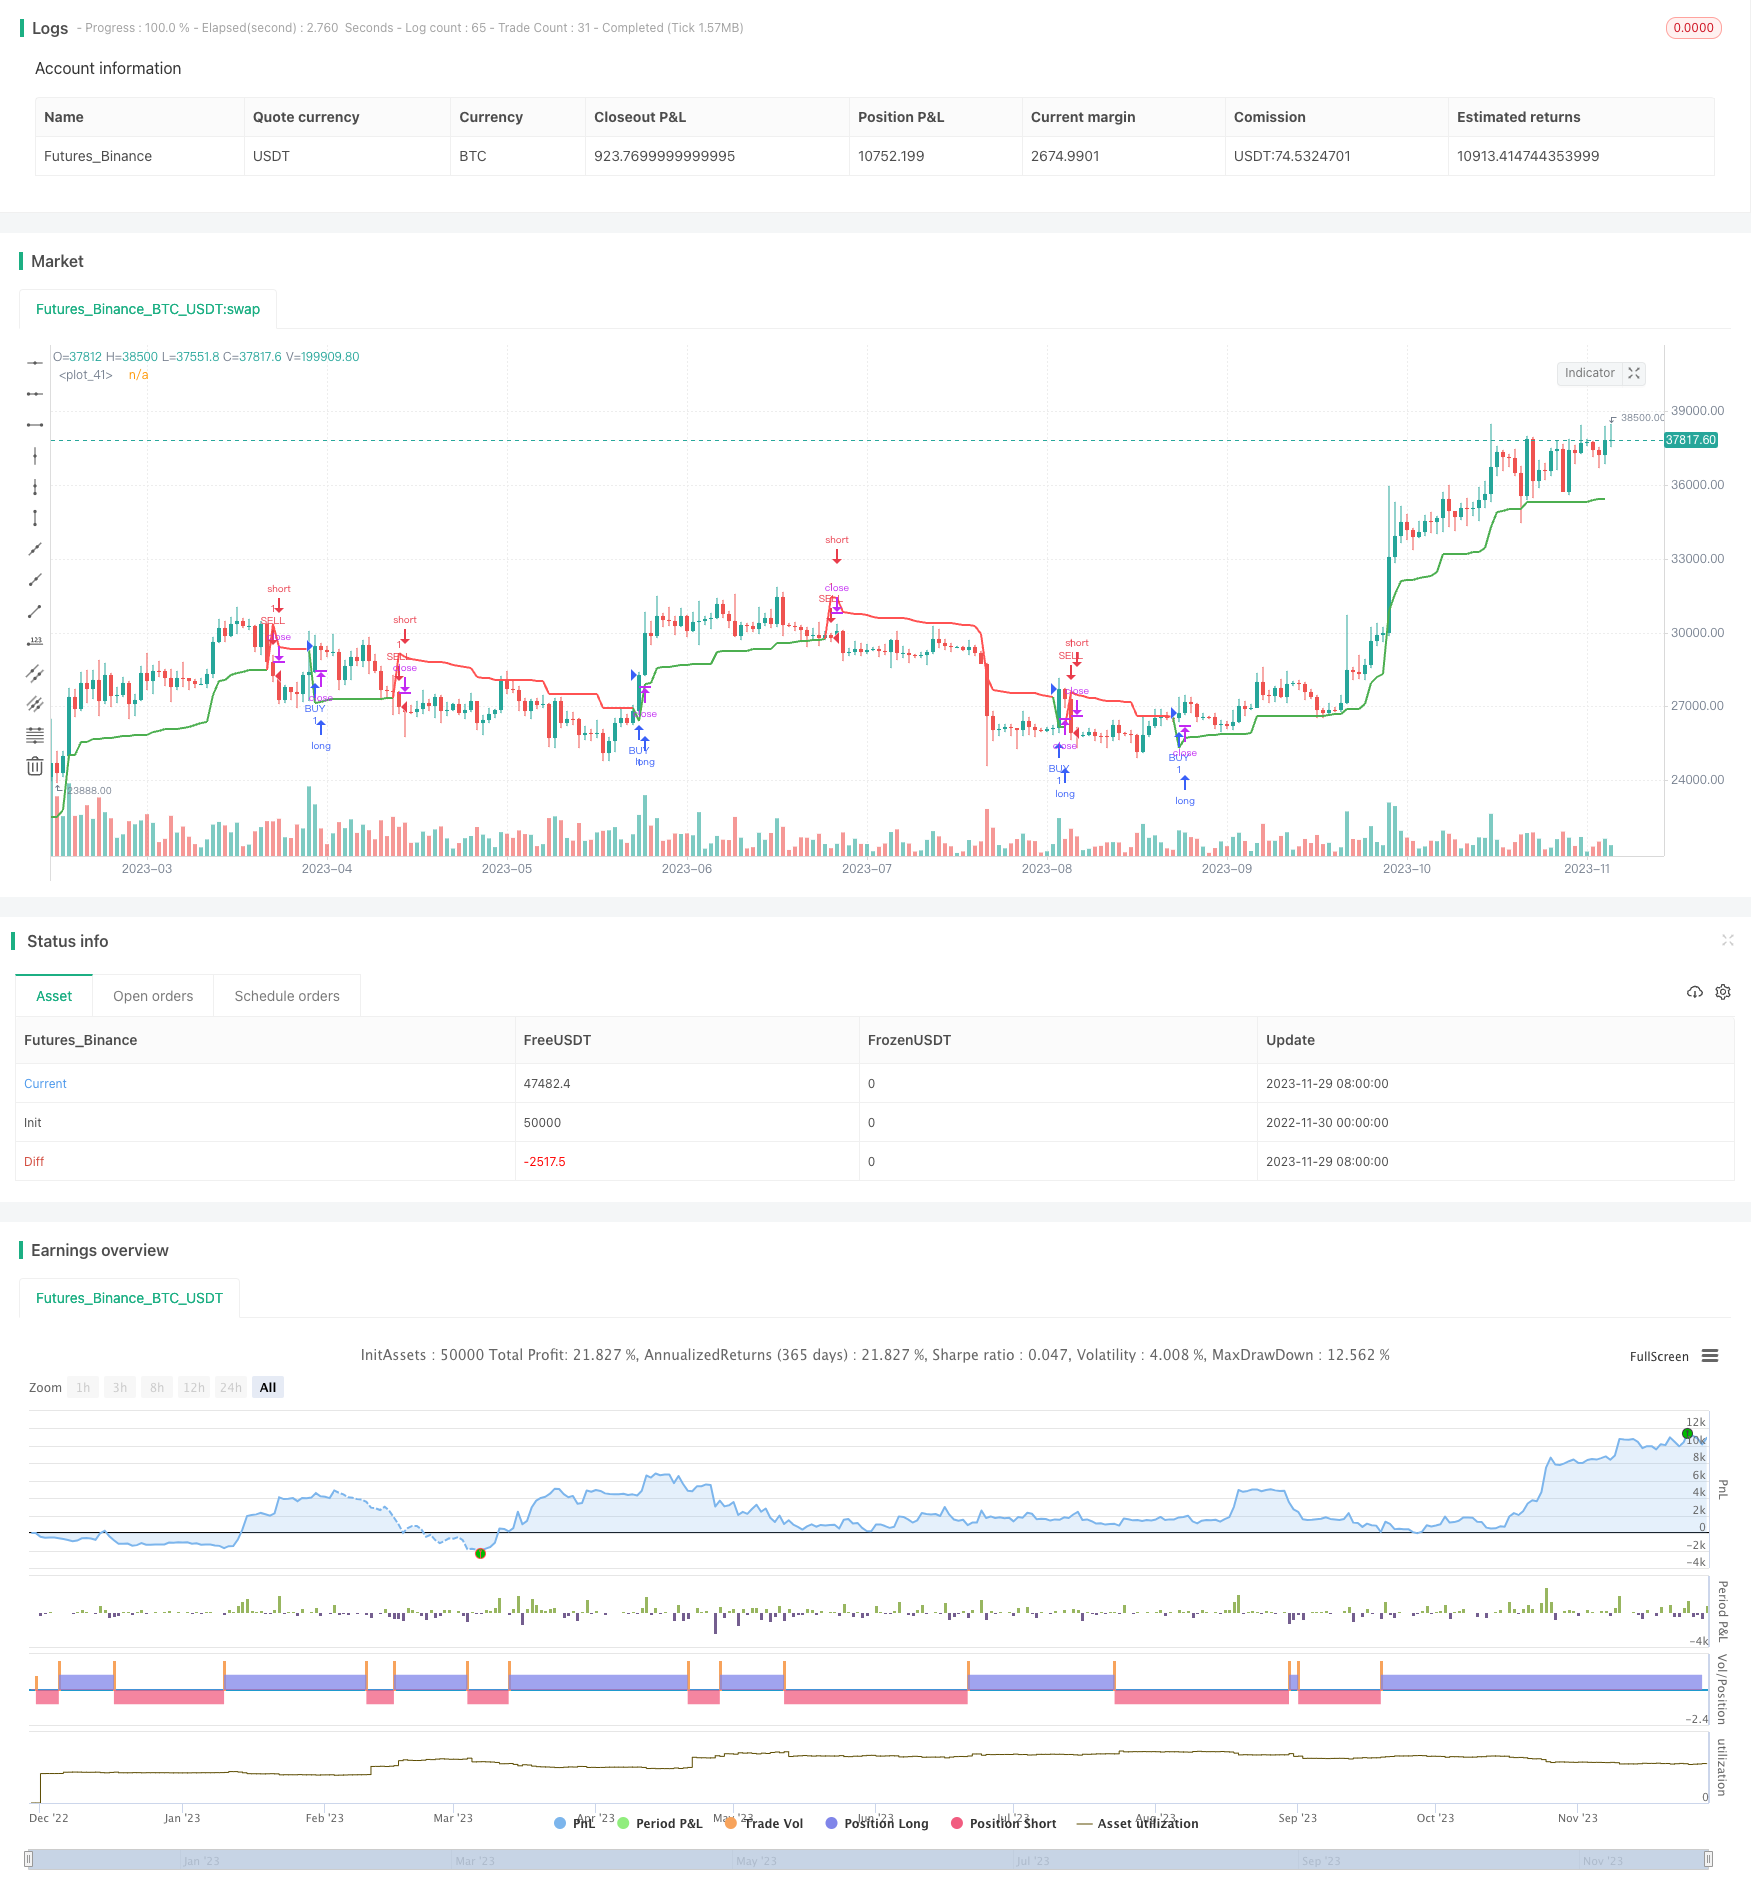
Overview
This is a trend tracking stop loss strategy based on price volatility. It uses Average True Range (ATR) to set stop loss lines for price fluctuations. ATR reflects the volatility and risk level of prices. When the price exceeds the stop loss line, the strategy judges the trend reversal and takes corresponding actions to open positions or stop losses.
Strategy Principle
The strategy first calculates the Average True Range (ATR) over a certain period. Then based on the current price trend direction, if it is an uptrend, the stop loss line is set to the current highest price minus n times the ATR; if it is a downtrend, the stop loss line is set to the current lowest price plus n times the ATR. The n value can be adjusted through parameters to control the distance between the stop loss line and the price.
When the price breaks through the stop loss line of the uptrend or the downtrend, the trend is judged to have changed. At this point, the strategy clears positions for stop loss and sets a new stop loss line based on the direction of the new trend.
In summary, the strategy uses price volatility to set stop loss lines to achieve accurate judgment of trend changes. Timely stop loss when the trend changes helps the strategy grasp the direction of the new trend.
Advantages of the Strategy
- Use price volatility characteristics to judge trends and accurately grasp price turning points
- Timely stop losses and switch positions to reduce risks of market reversals
- Flexible parameter adjustment to control distance between stop loss line and price fluctuations
- Parameters can be optimized for specific products for better adaptability
Risks of the Strategy
- Risks of misjudgment due to invalid breakouts. Prices may have unsustainable invalid breakouts, causing misjudgments of trend changes
- Overly aggressive parameter settings may increase losses. For example, when the n value is too large, the stop loss line is too close and small fluctuations may trigger it
- The stop loss effect may be poor for low volatility products like currencies. Smaller ATR values mean stop loss lines are closer to prices
Optimization Directions
- Auxiliary indicators like trading volume or volatility acceleration can be introduced to avoid misjudgment of invalid breakouts
- Adjust n value based on characteristics of different products to make stop loss distance more appropriate
- ATR period can also be optimized to choose the most suitable period parameter to judge price gap volatility
Summary
Overall this is a good algorithm implementation for setting stop loss lines based on price volatility. Its accuracy in judging price trends is high and it can capture key turning points of trends. It also provides some room for parameter tuning for better adaptability. As a stop loss strategy, it can effectively avoid risks of market reversals and is worth applying in live trading.
Parameters
| Name | Default | What it controls |
|---|---|---|
| v_input_1 | 20 | length |
| v_input_2 | 2 | mult |
| v_input_3 | false | Use take profit? |
| v_input_4 | 100 | Take profit pips |
| v_input_5 | false | Use stop loss? |
| v_input_6 | 100 | Stop loss pips |
| v_input_7 | true | From Day |
| v_input_8 | true | From Month |
| v_input_9 | 2000 | From Year |
| v_input_10 | 31 | To Day |
| v_input_11 | 12 | To Month |
| v_input_12 | 2039 | To Year |
Source Pine Script
/*backtest
start: 2022-11-30 00:00:00
end: 2023-11-30 00:00:00
period: 1d
basePeriod: 1h
exchanges: [{"eid":"Futures_Binance","currency":"BTC_USDT"}]
*/

// This source code is subject to the terms of the Mozilla Public License 2.0 at https://mozilla.org/MPL/2.0/
// © laptevmaxim92

//@version=4
strategy("Volatility stop strategy", overlay=true)

length = input(20)
mult = input(2, step = 0.1)
utp = input(false, "Use take profit?")
pr = input(100, "Take profit pips")
usl = input(false, "Use stop loss?")
sl = input(100, "Stop loss pips")
fromday = input(01, defval=01, minval=01, maxval=31, title="From Day")
frommonth = input(01, defval=01, minval= 01, maxval=12, title="From Month")
fromyear = input(2000, minval=1900, maxval=2100, title="From Year")
today = input(31, defval=01, minval=01, maxval=31, title="To Day")
tomonth = input(12, defval=12, minval=01, maxval=12, title="To Month")
toyear = input(2039, minval=1900, maxval=2100, title="To Year")

use_date = (time > timestamp(fromyear, frommonth, fromday, 00, 00) and time < timestamp(toyear, tomonth, today, 00, 00))

atr_ = atr(length)
max_ = 0.0
min_ = 0.0
max1 = 0.0
max1 := max(nz(max_[1]), close)
min1 = 0.0
min1 := min(nz(min_[1]), close)
vstop = 0.0
is_uptrend = false
is_uptrend_prev = false
is_uptrend_prev := nz(is_uptrend[1], true)
stop = is_uptrend_prev ? max1 - mult * atr_ : min1 + mult * atr_
vstop_prev = nz(vstop[1])
vstop1 = is_uptrend_prev ? max(vstop_prev, stop) : min(vstop_prev, stop)
is_uptrend := close - vstop1 >= 0
is_trend_changed = is_uptrend != is_uptrend_prev
max_ := is_trend_changed ? close : max1
min_ := is_trend_changed ? close : min1
vstop := is_trend_changed ? is_uptrend ? max_ - mult * atr_ : min_ + mult * atr_ : vstop1
plot(vstop, color = is_uptrend ? color.green : color.red, linewidth=2)

longCondition = is_uptrend
if (longCondition and use_date)
    strategy.entry("BUY", strategy.long)

shortCondition = not is_uptrend
if (shortCondition and use_date)
    strategy.entry("SELL", strategy.short)

if (utp and not usl)
    strategy.exit("TP", "BUY", profit = pr)
    strategy.exit("TP", "SELL", profit = pr)

if (usl and not utp)
    strategy.exit("SL", "BUY", loss = sl)
    strategy.exit("SL", "SELL", loss = sl)

if (usl and utp)
    strategy.exit("TP/SL", "BUY", loss = sl, profit = pr)
strategy.exit("TP/SL", "SELL", loss = sl, profit = pr)Published by ChaoZhang on the FMZ strategy square · last modified 2023-12-01. Collected in the Quant Trading Vault. Unvalidated research: re-test with your own data and costs before trusting it.
Build this with AgenKit
A spec is not a trading system. Paste this into your coding agent and AgenKit runs a specialist team — architecture, test-first build, risk gates, review — with paper trading on by default.
/agenkit build a production-grade trading bot with a backtest engine, risk controls and paper trading by default from strategies/Volatility-Stop-Tracking-Strategy.md- npx agenkit install engineering-kit in your project
- Paste the command into your agent and approve each phase
- Get tests, backtest, risk controls and a paper-trading switch
Understand it first
Before you run this, read the lesson behind the idea and how to backtest it honestly. Specs like this one are the survivors of an unknown number of trials; deflate their results accordingly.
Related specs
- Dual EMA Volatility Adaptive Trading Strategy with Multi Tiered Profit Optimization SystemPine Script · Volatility · 1d
- Dynamic ATR Trailing Stop Trading Strategy Market Volatility Adaptive SystemPine Script · Volatility · 1d
- Multi Indicator Volatility Trading RSI EMA ATR StrategyPine Script · Volatility · 3m
- RWI Volatility Contrarian StrategyPine Script · Volatility · 1h
- Dynamic Volatility Trading System Multi Timeframe Nested Technical Indicator Strategy with Extreme Market Condition Monitoring for FuturesPine Script · Volatility · 1h
- ATR Trailing Stop Bands StrategyPine Script · Volatility · 1d