Strategy vault / Trend following
Volatility Trend Tracking Strategy
This strategy uses the WaveTrend indicator to determine price trends and overbought/oversold situations. It combines the RSI indicator to filter signals and adopts a trend tracking method to make counter-trend…
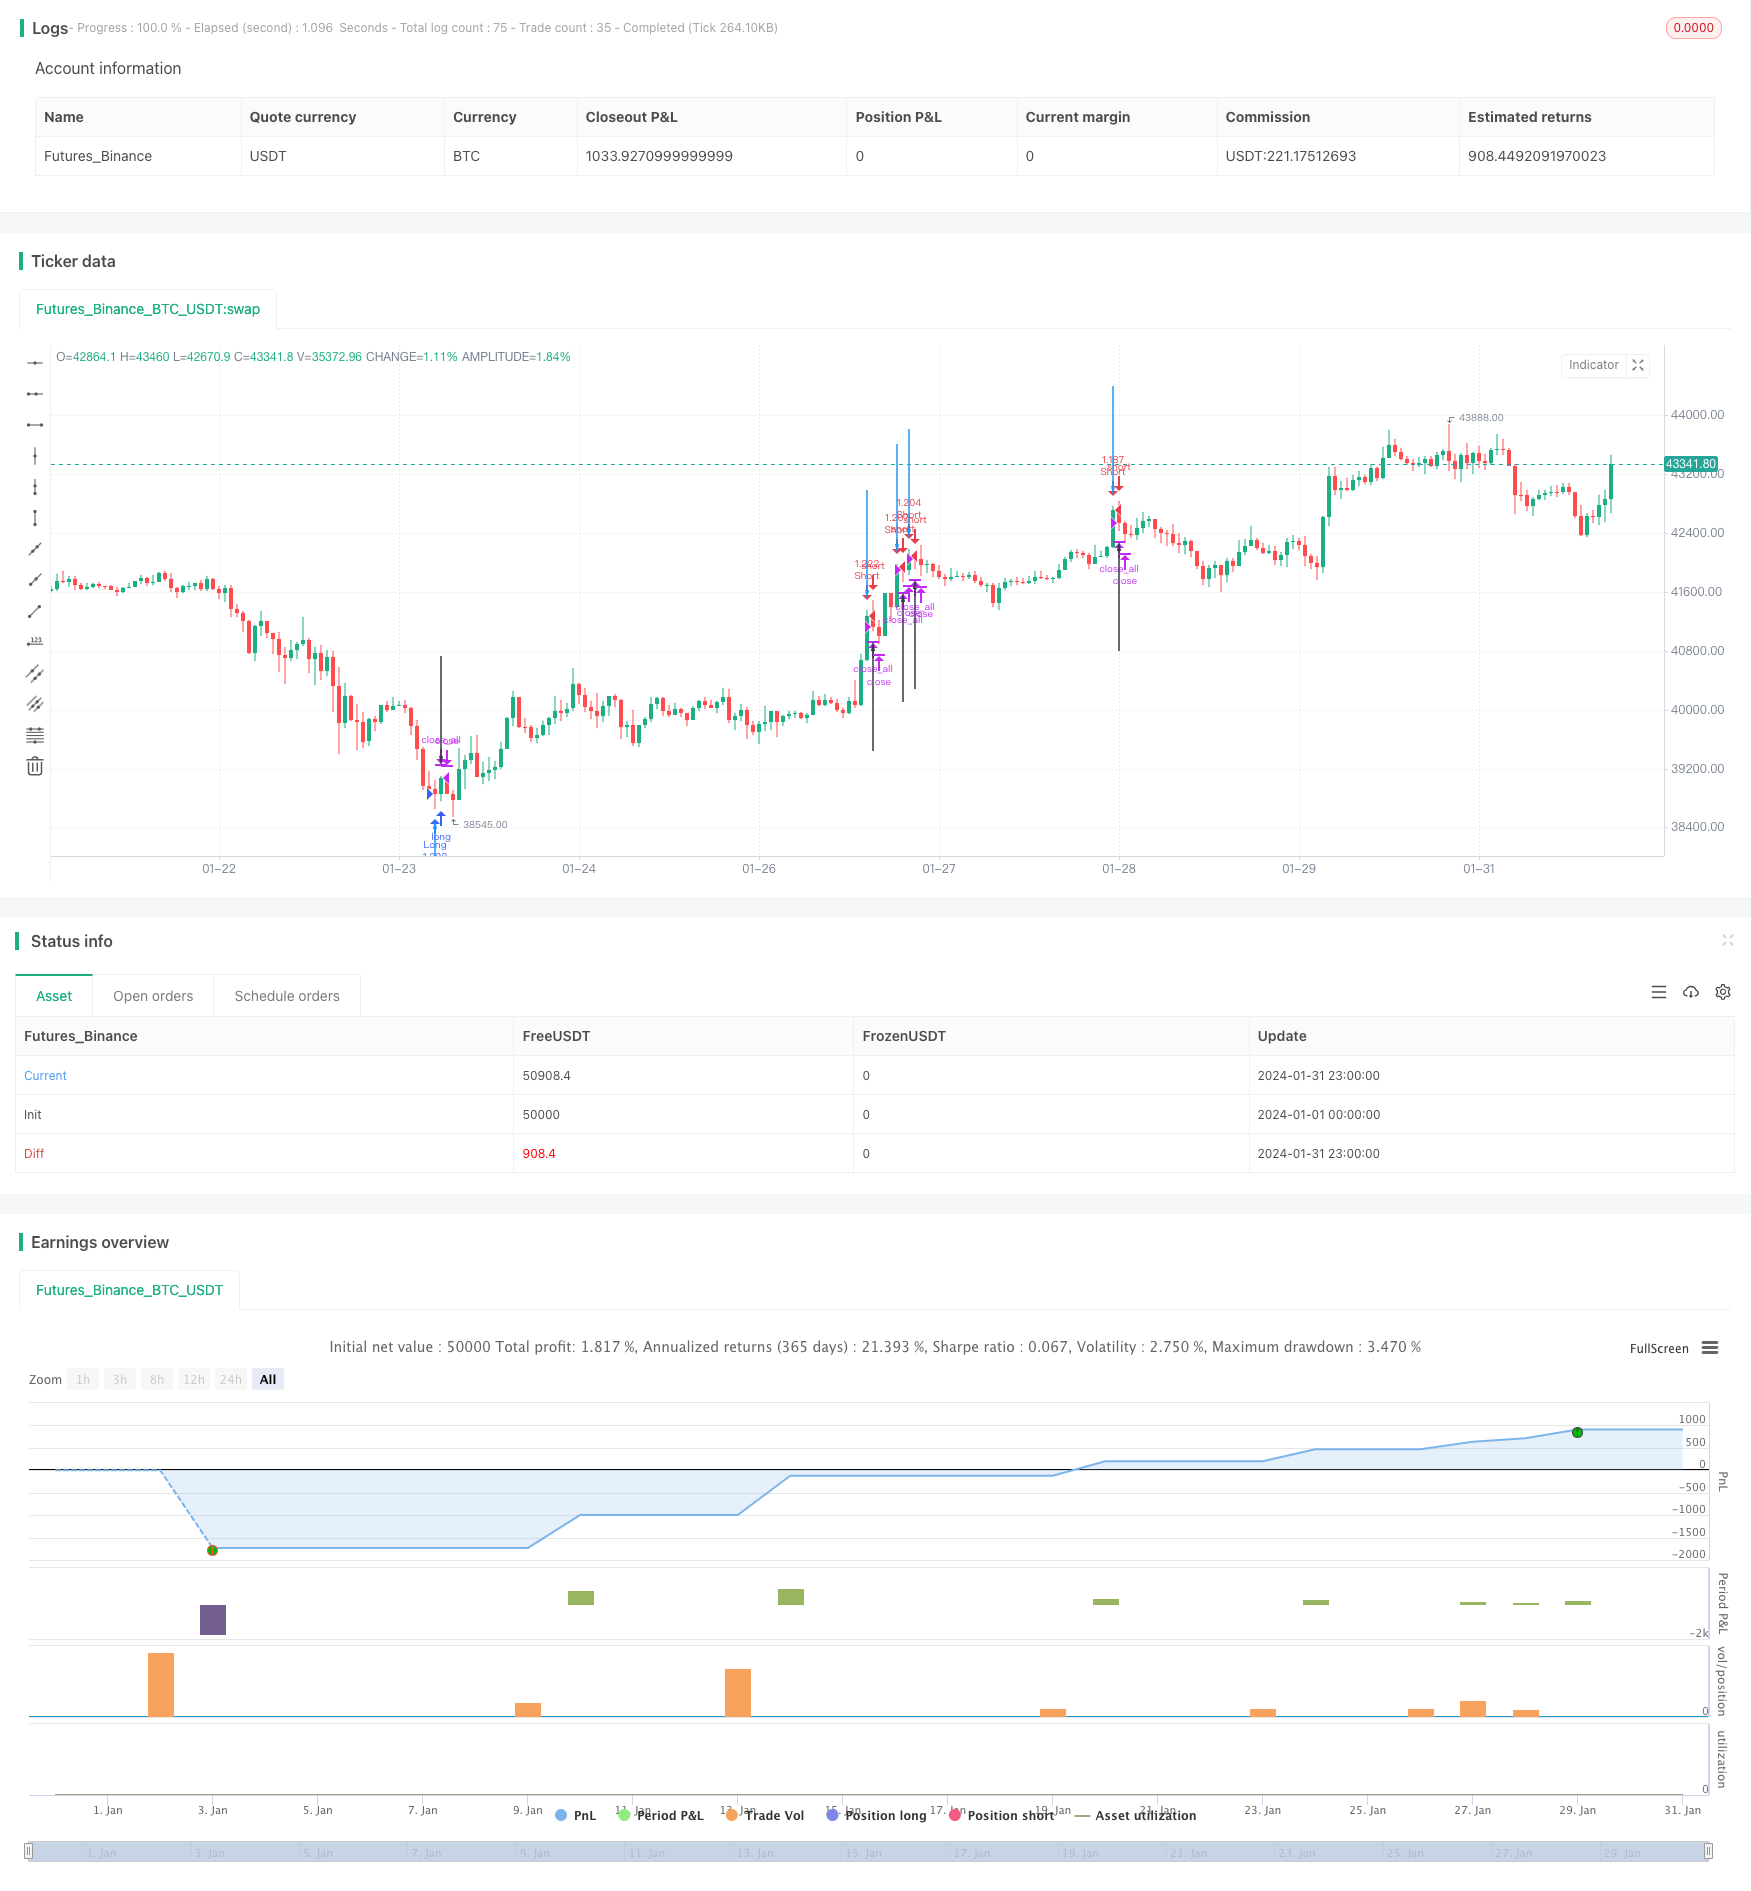
Overview
This strategy uses the WaveTrend indicator to determine price trends and overbought/oversold situations. It combines the RSI indicator to filter signals and adopts a trend tracking method to make counter-trend operations at overbought/oversold levels.
Strategy Logic
The strategy uses the WaveTrend indicator to determine the price trend direction. The WaveTrend indicator is improved based on the Rainbow indicator. It judges the price trend direction by calculating the difference between the Heikin-Ashi moving average and the absolute value of the price. It generates trading signals by combining the RSI indicator to determine overbought/oversold situations.
Specifically, the WaveTrend formula in the strategy is:
esa = ema(hlc3, 10)
d = ema(abs(hlc3 - esa), 10)
ci = (hlc3 - esa) / (0.015 * d)
wt = ema(ci, 21)
Where esa is the calculated Heikin-Ashi moving average, d is the mean of the difference between the Heikin-Ashi moving average and the absolute value of the price. ci is the so-called adaptive range, reflecting the volatility of prices. wt is the moving average of ci, which determines the price trend direction and is the key indicator for long and short.
The RSI indicator is used to determine overbought/oversold situations. The RSI calculation formula in the code is:
rsiup = rma(max(change(close), 0), 14)
rsidown = rma(-min(change(close), 0), 14)
rsi = rsidown == 0 ? 100 : rsiup == 0 ? 0 : 100 - (100 / (1 + rsiup / rsidown))
Its standard value is 0-100. Above 70 is overbought and below 30 is oversold.
Combined with these two indicators, when RSI is below 25 and WaveTrend is below -60, it is oversold to go long. When RSI is above 75 and WaveTrend is above 60, it is overbought to go short.
Advantage Analysis
The advantages of this strategy include:
- WaveTrend indicator can accurately and reliably determine the price trend direction.
- RSI filters can avoid unnecessary trades and improve win rate.
- Trend tracking method can maximize profits from catching price trends.
- The strategy idea is simple and clear, parameters are flexible to adjust for different products and markets.
- Easy to implement and test in live trading, good for further optimization.
Risk Analysis
There are also some risks:
- Both WaveTrend and RSI have some lag, may miss price reversal points.
- False signals may still occur in sideways markets despite filters.
- Lack of effective stop loss method to control single loss.
- Reasonable parameter tuning needs to match characteristics and trading frequency.
Solutions:
- Add indicators for combinational optimizations to improve signal accuracy.
- Add stop loss strategies to control single loss.
- Find optimal parameter combinations to adapt the strategy.
Optimization Directions
The strategy can be optimized in the following directions:
Change or add judgment indicators to improve signal accuracy, e.g. MACD, KD etc.
Optimize parameter settings to adapt different products, e.g. adjust smooth periods.
Add tracking stop loss strategies to control single loss, e.g. percentage stop loss, trailing stop loss etc.
Consider different pyramiding strategies, e.g. Martingale instead of fixed quantity.
Optimize adaptive range parameters to improve judgment accuracy.
Conclusion
The overall idea of the strategy is clear, using volatility indicators to determine price trends and filter noise effectively. There is room for optimization in multiple aspects to make the strategy more robust. Through parameter tuning, it can be adapted to different products and is worth further live testing.
Parameters
| Name | Default | What it controls |
|---|---|---|
| v_input_1 | true | Long |
| v_input_2 | true | Short |
| v_input_3 | false | Use Martingale |
| v_input_4 | 100 | Capital, % |
| v_input_5 | true | Show Arrows |
| v_input_6 | 2018 | From Year |
| v_input_7 | 2100 | To Year |
| v_input_8 | true | From Month |
| v_input_9 | 12 | To Month |
| v_input_10 | true | From day |
| v_input_11 | 31 | To day |
Source Pine Script
/*backtest
start: 2024-01-01 00:00:00
end: 2024-01-31 23:59:59
period: 1h
basePeriod: 15m
exchanges: [{"eid":"Futures_Binance","currency":"BTC_USDT"}]
*/

//Noro
//2018

//@version=2
strategy(title = "Noro's WaveTrender Strategy v1.0", shorttitle = "WaveTrender str 1.0", overlay = true, default_qty_type = strategy.percent_of_equity, default_qty_value = 100, pyramiding = 10)

//Settings
needlong = input(true, defval = true, title = "Long")
needshort = input(true, defval = true, title = "Short")
usemar = input(false, defval = false, title = "Use Martingale")
capital = input(100, defval = 100, minval = 1, maxval = 10000, title = "Capital, %")
showarr = input(true, defval = true, title = "Show Arrows")
fromyear = input(2018, defval = 2018, minval = 1900, maxval = 2100, title = "From Year")
toyear = input(2100, defval = 2100, minval = 1900, maxval = 2100, title = "To Year")
frommonth = input(01, defval = 01, minval = 01, maxval = 12, title = "From Month")
tomonth = input(12, defval = 12, minval = 01, maxval = 12, title = "To Month")
fromday = input(01, defval = 01, minval = 01, maxval = 31, title = "From day")
today = input(31, defval = 31, minval = 01, maxval = 31, title = "To day")

//RSI
rsiup = rma(max(change(close), 0), 14)
rsidown = rma(-min(change(close), 0), 14)
rsi = rsidown == 0 ? 100 : rsiup == 0 ? 0 : 100 - (100 / (1 + rsiup / rsidown))

//WaveTrend
esa = ema(hlc3, 10)
d = ema(abs(hlc3 - esa), 10)
ci = (hlc3 - esa) / (0.015 * d)
wt = ema(ci, 21)

//Body
body = abs(close - open)
abody = sma(body, 10)

//Signals
bar = close > open ? 1 : close < open ? -1 : 0
overs = rsi < 25 and wt < -60
overb = rsi > 75 and wt > 60
up1 = (strategy.position_size == 0 or close < strategy.position_avg_price) and overs and bar == -1
dn1 = (strategy.position_size == 0 or close > strategy.position_avg_price) and overb and bar == 1
exit = (strategy.position_size > 0 and overs == false) or (strategy.position_size < 0 and overb == false)

//Arrows
col = exit ? black : up1 or dn1 ? blue : na
needup = up1
needdn = dn1
needexitup = exit and strategy.position_size < 0
needexitdn = exit and strategy.position_size > 0
plotarrow(showarr and needup ? 1 : na, colorup = blue, colordown = blue, transp = 0)
plotarrow(showarr and needdn ? -1 : na, colorup = blue, colordown = blue, transp = 0)
plotarrow(showarr and needexitup ? 1 : na, colorup = black, colordown = black, transp = 0)
plotarrow(showarr and needexitdn ? -1 : na, colorup = black, colordown = black, transp = 0)

//Trading
profit = exit ? ((strategy.position_size > 0 and close > strategy.position_avg_price) or (strategy.position_size < 0 and close < strategy.position_avg_price)) ? 1 : -1 : profit[1]
mult = usemar ? exit ? profit == -1 ? mult[1] * 2 : 1 : mult[1] : 1
lot = strategy.position_size == 0 ? strategy.equity / close * capital / 100 * mult : lot[1]

if up1
    if strategy.position_size < 0
        strategy.close_all()

    strategy.entry("Long", strategy.long, needlong == false ? 0 : lot)

if dn1
    if strategy.position_size > 0
        strategy.close_all()

    strategy.entry("Short", strategy.short, needshort == false ? 0 : lot)

if exit
strategy.close_all()Published by ChaoZhang on the FMZ strategy square · last modified 2024-02-18. Collected in the Quant Trading Vault. Unvalidated research: re-test with your own data and costs before trusting it.
Build this with AgenKit
A spec is not a trading system. Paste this into your coding agent and AgenKit runs a specialist team — architecture, test-first build, risk gates, review — with paper trading on by default.
/agenkit build a production-grade trading bot with a backtest engine, risk controls and paper trading by default from strategies/Volatility-Trend-Tracking-Strategy.md- npx agenkit install engineering-kit in your project
- Paste the command into your agent and approve each phase
- Get tests, backtest, risk controls and a paper-trading switch
Understand it first
Before you run this, read the lesson behind the idea and how to backtest it honestly. Specs like this one are the survivors of an unknown number of trials; deflate their results accordingly.
Related specs
- Dynamic ATR Trailing Stop with EMA Cross Combination StrategyPine Script · Trend following · 2h
- SuperTrend Trailing Stop Strategy Based on Heikin AshiPine Script · Trend following · 4h
- WaveTrend and DER Based Swing Trading StrategyPine Script · Trend following · 1d
- Dynamic Moving Average Trend Trading StrategyPine Script · Trend following · 1d
- Multiple Timeframe Filtered Trend Following StrategyPine Script · Trend following · 1h
- Smoothed Heikin Ashi Trend Following StrategyPine Script · Trend following · 10m