Strategy vault / Mean reversion
Volume Divergence
It's a simply volume indicator. You should watch for breaks on both volume uptrend and volume downtrend. It uses fibonacci numbers to build smoothed moving average of volume . Also you can check divergences for trend…
It's a simply volume indicator. You should watch for breaks on both volume uptrend and volume downtrend. It uses fibonacci numbers to build smoothed moving average of volume .
Also you can check divergences for trend reversal and momentum loss.
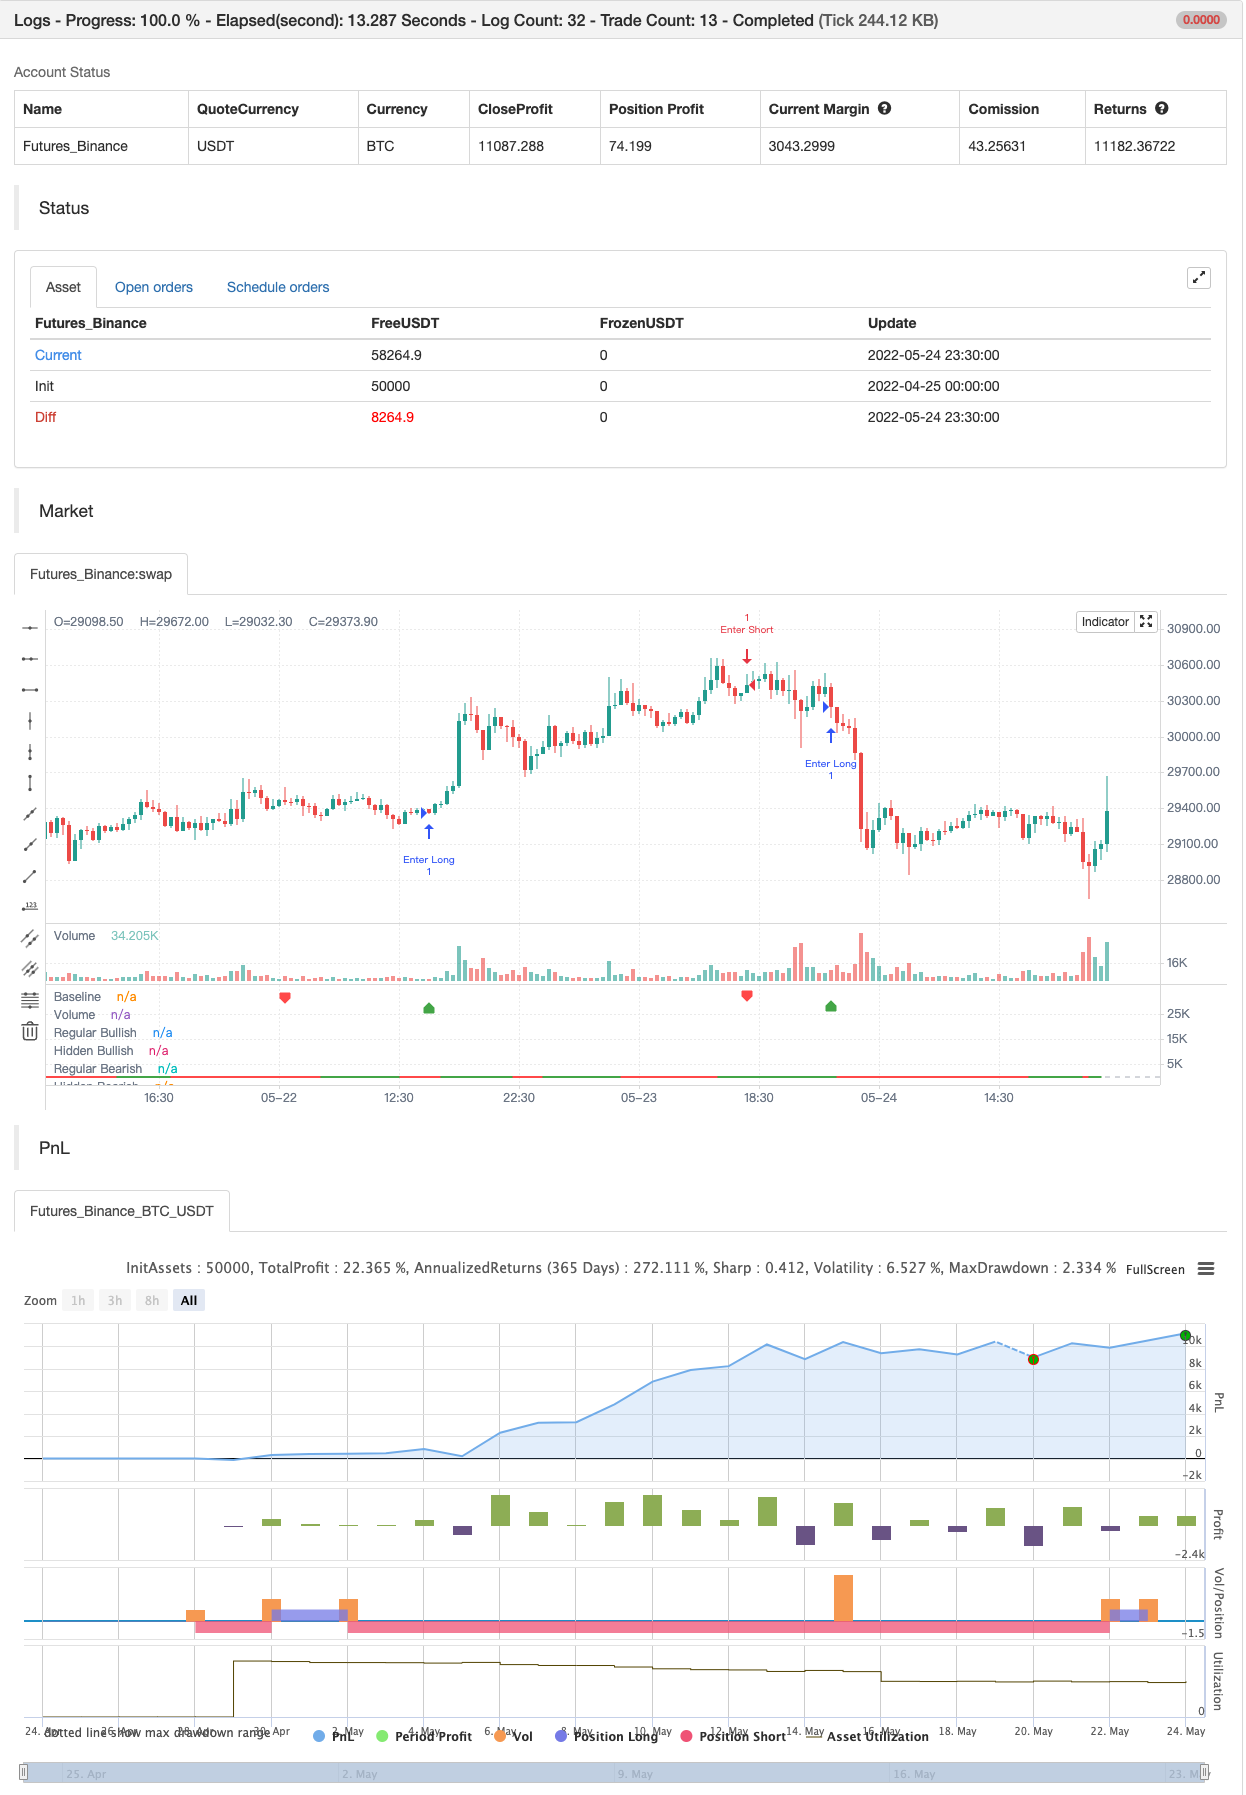
backtest
Parameters
| Name | Default | What it controls |
|---|---|---|
| v_input_1 | 5 | First Moving Average length |
| v_input_2 | 8 | Second Moving Average length |
| v_input_3 | 5 | Pivot Lookback Right |
| v_input_4 | 5 | Pivot Lookback Left |
| v_input_5 | 60 | Max of Lookback Range |
| v_input_6 | 5 | Min of Lookback Range |
| v_input_7 | true | Plot Bullish |
| v_input_8 | false | Plot Hidden Bullish |
| v_input_9 | true | Plot Bearish |
| v_input_10 | false | Plot Hidden Bearish |
Source Pine Script
/*backtest
start: 2022-04-25 00:00:00
end: 2022-05-24 23:59:00
period: 30m
basePeriod: 15m
exchanges: [{"eid":"Futures_Binance","currency":"BTC_USDT"}]
*/

// This source code is subject to the terms of the Mozilla Public License 2.0 at https://mozilla.org/MPL/2.0/
// © baymucuk

//@version=4
study(title="Volume Divergence by MM", shorttitle="Volume Divergence", format=format.volume)

pine_wma(x, y) =>
    norm = 0.0
    sum = 0.0
    for i = 0 to y - 1
        weight = (y - i) * y
        norm := norm + weight
        factor = close[i] < open[i] ? -1 : 1
        sum := sum + (x[i] * weight * factor)
    sum / norm

vl1 = input(defval=5, title="First Moving Average length", type=input.integer)
vl2 = input(defval=8, title="Second Moving Average length", type=input.integer)
vl3 = vl1 + vl2
vl4 = vl2 + vl3
vl5 = vl3 + vl4

v1 = pine_wma(volume, vl1)
v2 = pine_wma(v1, vl2)
v3 = pine_wma(v2, vl3)
v4 = pine_wma(v3, vl4)
vol = pine_wma(v4, vl5)

vol_color = vol > 0 ? color.green : color.red
hline(0, title="Baseline", color=color.silver, linewidth=1)
plot(vol, color=vol_color, linewidth=2, title="Volume")

lbR = input(title="Pivot Lookback Right", defval=5)
lbL = input(title="Pivot Lookback Left", defval=5)
rangeUpper = input(title="Max of Lookback Range", defval=60)
rangeLower = input(title="Min of Lookback Range", defval=5)
plotBull = input(title="Plot Bullish", defval=true)
plotHiddenBull = input(title="Plot Hidden Bullish", defval=false)
plotBear = input(title="Plot Bearish", defval=true)
plotHiddenBear = input(title="Plot Hidden Bearish", defval=false)

bearColor = color.red
bullColor = color.green
hiddenBullColor = color.new(color.green, 25)
hiddenBearColor = color.new(color.red, 25)
textColor = color.white
noneColor = color.new(color.white, 100)

plFound = na(pivotlow(vol, lbL, lbR)) ? false : true
phFound = na(pivothigh(vol, lbL, lbR)) ? false : true

_inRange(cond) =>
    bars = barssince(cond == true)
    rangeLower <= bars and bars <= rangeUpper

//------------------------------------------------------------------------------
// Regular Bullish

// vol: Higher Low
volHL = vol[lbR] > valuewhen(plFound, vol[lbR], 1) and _inRange(plFound[1])

// Price: Lower Low
priceLL = low[lbR] < valuewhen(plFound, low[lbR], 1)

bullCond = plotBull and priceLL and volHL and plFound

plot(
	 plFound ? vol[lbR] : na,
	 offset=-lbR,
	 title="Regular Bullish",
	 linewidth=2,
	 color=(bullCond ? bullColor : noneColor),
	 transp=0
	 )

plotshape(
	 bullCond ? vol[lbR] : na,
	 offset=-lbR,
	 title="Regular Bullish Label",
	 text=" Bull ",
	 style=shape.labelup,
	 location=location.absolute,
	 color=bullColor,
	 textcolor=textColor,
	 transp=0
	 )

//------------------------------------------------------------------------------
// Hidden Bullish

// vol: Lower Low
volLL = vol[lbR] < valuewhen(plFound, vol[lbR], 1) and _inRange(plFound[1])

// Price: Higher Low
priceHL = low[lbR] > valuewhen(plFound, low[lbR], 1)

hiddenBullCond = plotHiddenBull and priceHL and volLL and plFound

plot(
	 plFound ? vol[lbR] : na,
	 offset=-lbR,
	 title="Hidden Bullish",
	 linewidth=2,
	 color=(hiddenBullCond ? hiddenBullColor : noneColor),
	 transp=0
	 )

plotshape(
	 hiddenBullCond ? vol[lbR] : na,
	 offset=-lbR,
	 title="Hidden Bullish Label",
	 text=" H Bull ",
	 style=shape.labelup,
	 location=location.absolute,
	 color=bullColor,
	 textcolor=textColor,
	 transp=0
	 )

//------------------------------------------------------------------------------
// Regular Bearish

// vol: Lower High
volLH = vol[lbR] < valuewhen(phFound, vol[lbR], 1) and _inRange(phFound[1])

// Price: Higher High
priceHH = high[lbR] > valuewhen(phFound, high[lbR], 1)

bearCond = plotBear and priceHH and volLH and phFound

plot(
	 phFound ? vol[lbR] : na,
	 offset=-lbR,
	 title="Regular Bearish",
	 linewidth=2,
	 color=(bearCond ? bearColor : noneColor),
	 transp=0
	 )

plotshape(
	 bearCond ? vol[lbR] : na,
	 offset=-lbR,
	 title="Regular Bearish Label",
	 text=" Bear ",
	 style=shape.labeldown,
	 location=location.absolute,
	 color=bearColor,
	 textcolor=textColor,
	 transp=0
	 )

//------------------------------------------------------------------------------
// Hidden Bearish

// vol: Higher High
volHH = vol[lbR] > valuewhen(phFound, vol[lbR], 1) and _inRange(phFound[1])

// Price: Lower High
priceLH = high[lbR] < valuewhen(phFound, high[lbR], 1)

hiddenBearCond = plotHiddenBear and priceLH and volHH and phFound

plot(
	 phFound ? vol[lbR] : na,
	 offset=-lbR,
	 title="Hidden Bearish",
	 linewidth=2,
	 color=(hiddenBearCond ? hiddenBearColor : noneColor),
	 transp=0
	 )

plotshape(
	 hiddenBearCond ? vol[lbR] : na,
	 offset=-lbR,
	 title="Hidden Bearish Label",
	 text=" H Bear ",
	 style=shape.labeldown,
	 location=location.absolute,
	 color=bearColor,
	 textcolor=textColor,
	 transp=0
	 )


if bullCond
    strategy.entry("Enter Long", strategy.long)
else if bearCond
strategy.entry("Enter Short", strategy.short)Published by ChaoZhang on the FMZ strategy square · last modified 2022-05-26. Collected in the Quant Trading Vault. Unvalidated research: re-test with your own data and costs before trusting it.
Build this with AgenKit
A spec is not a trading system. Paste this into your coding agent and AgenKit runs a specialist team — architecture, test-first build, risk gates, review — with paper trading on by default.
/agenkit build a production-grade trading bot with a backtest engine, risk controls and paper trading by default from strategies/Volume-Divergence.md- npx agenkit install engineering-kit in your project
- Paste the command into your agent and approve each phase
- Get tests, backtest, risk controls and a paper-trading switch
Understand it first
Before you run this, read the lesson behind the idea and how to backtest it honestly. Specs like this one are the survivors of an unknown number of trials; deflate their results accordingly.
Related specs
- Advanced Fibonacci Retracement Trend Following and Reversal Trading StrategyPine Script · Mean reversion · 3h
- EMA Crossover Fibonacci Reversal StrategyPine Script · Mean reversion · 1h
- Fibonacci Channel Based Candlestick Reversal Trading StrategyPine Script · Mean reversion · 1h
- Fibonacci Progression With BreaksPine Script · Mean reversion · 5m
- Multi Timeframe Gold Reversal Tracking StrategyPine Script · Mean reversion · 2h
- Fibonacci Retracement Reversal StrategyPine Script · Mean reversion · 1h