Volume MA based Adaptive Pyramiding Dynamic Stop Loss and Take Profit Trading Strategy
This strategy combines multiple technical indicators, including the Hull Moving Average (HMA), Moving Average Convergence Divergence (MACD), Average True Range (ATR), Relative Strength Index (RSI), On-Balance Volume…
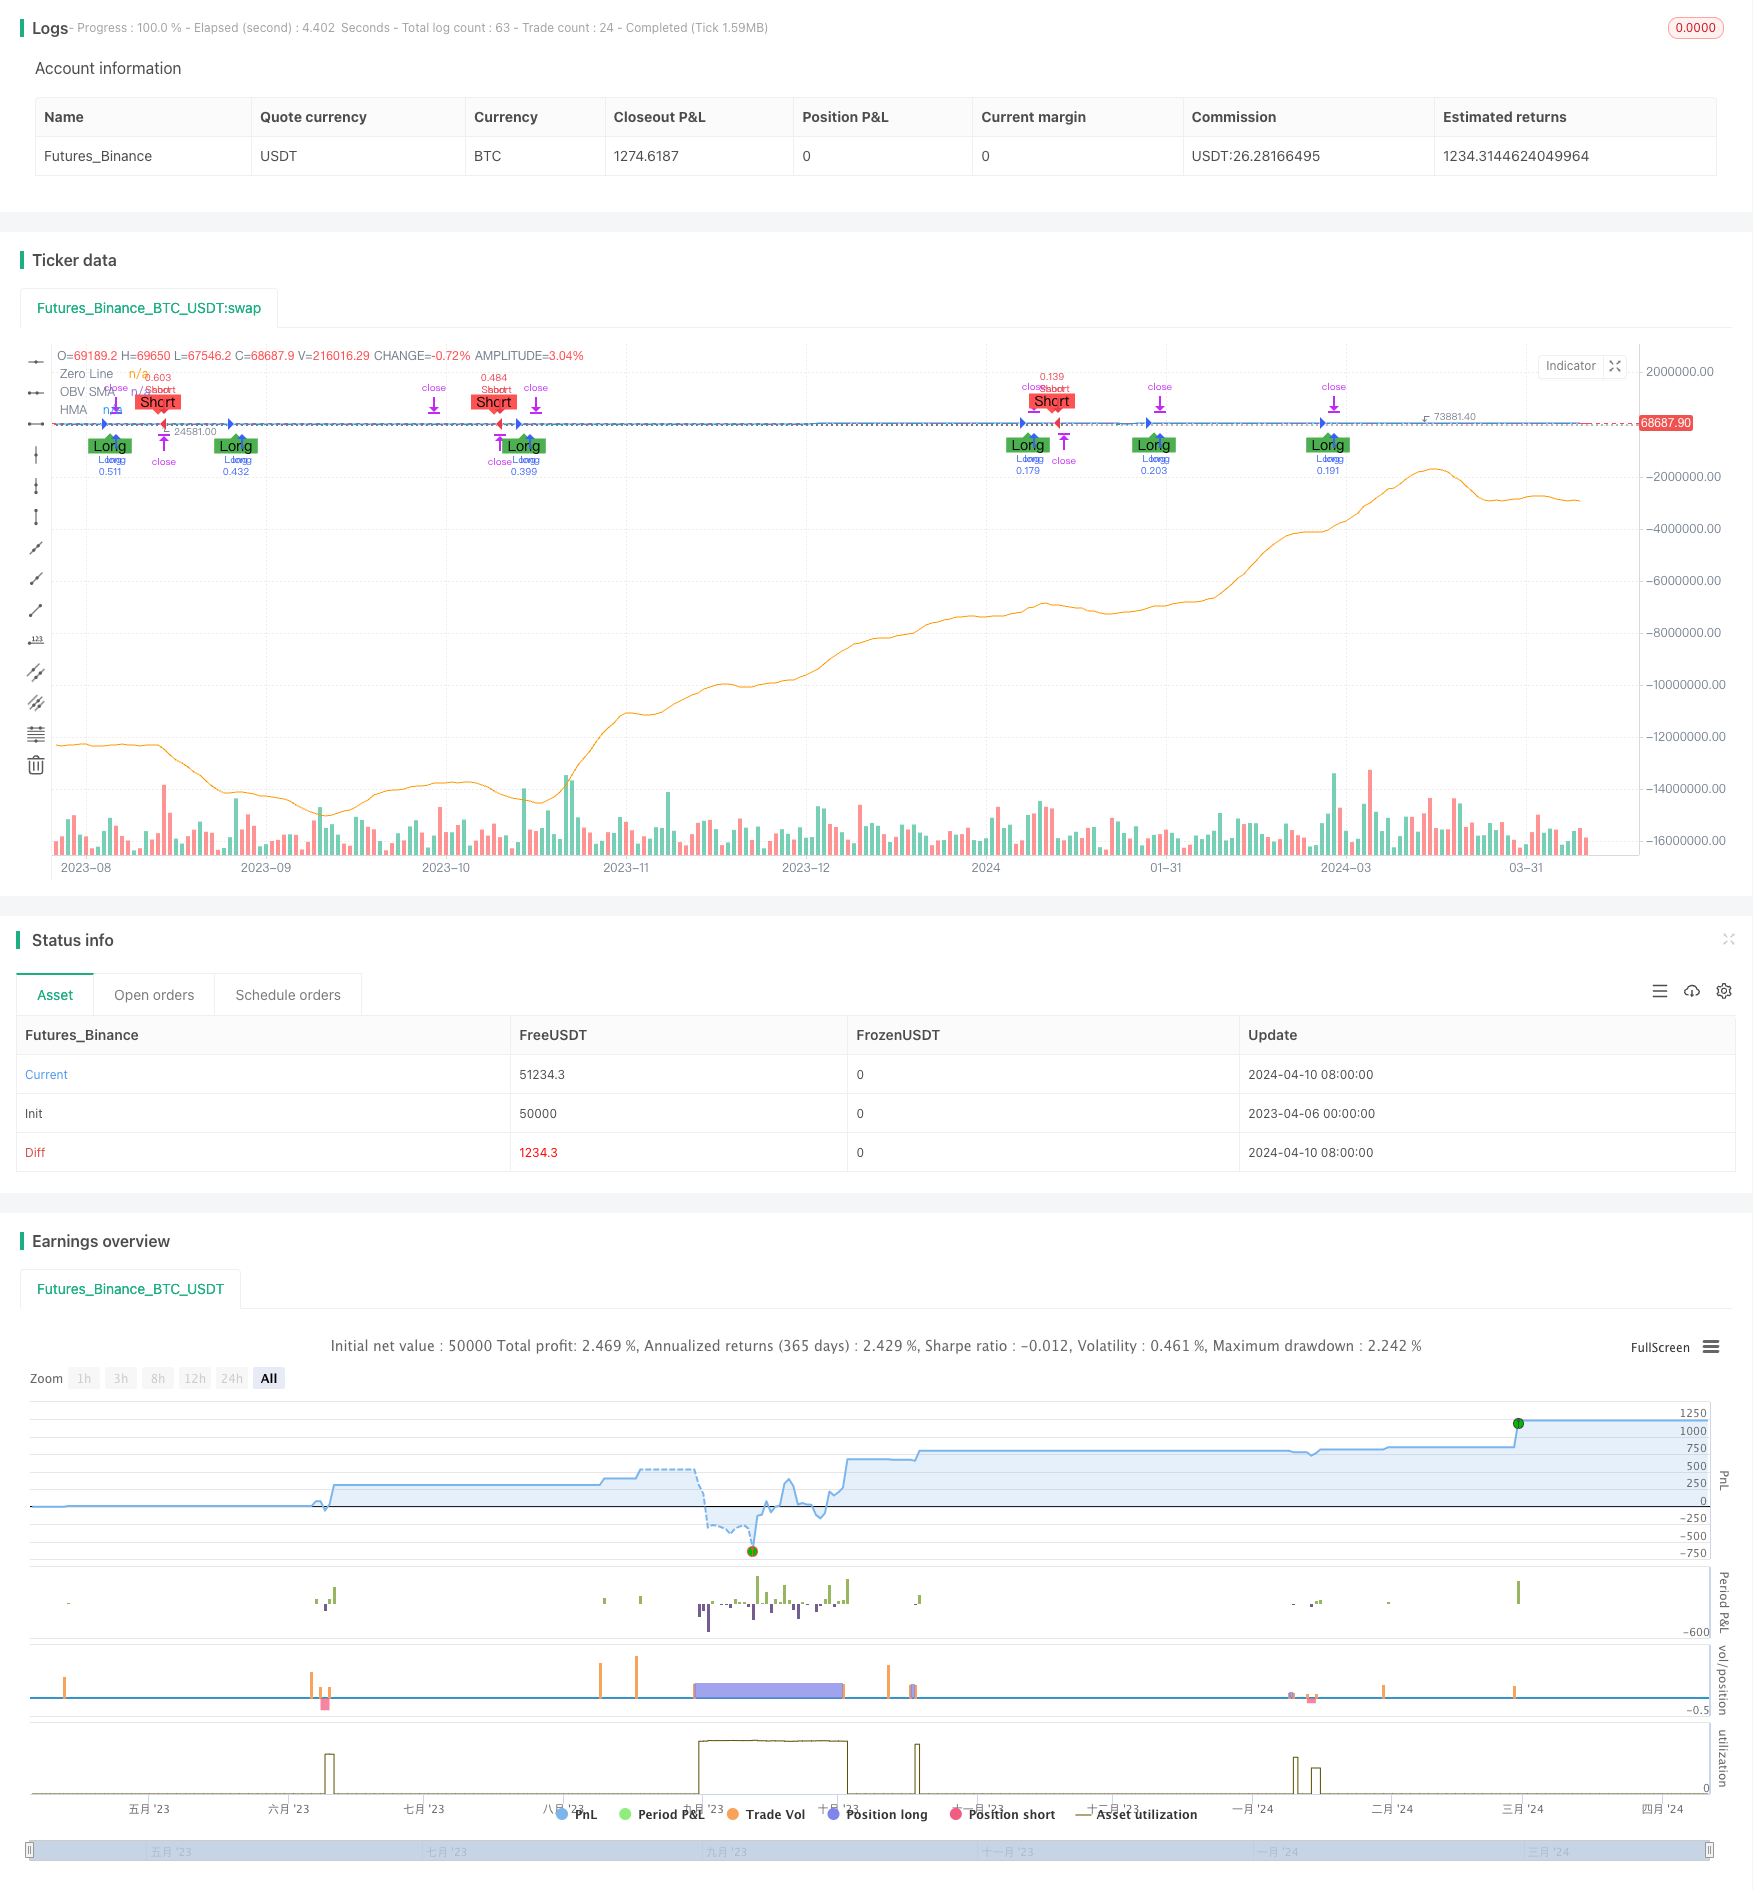
Overview
This strategy combines multiple technical indicators, including the Hull Moving Average (HMA), Moving Average Convergence Divergence (MACD), Average True Range (ATR), Relative Strength Index (RSI), On-Balance Volume (OBV), and Volume Moving Average. By comprehensively analyzing these indicators, the strategy aims to identify market trends and potential entry opportunities. Moreover, the strategy employs risk management techniques such as pyramiding, dynamic stop loss and take profit, and trailing stop loss to capture trend opportunities while strictly controlling risks.
Strategy Principles
- Calculate indicators such as HMA, MACD, ATR, RSI, OBV, and Volume Moving Average
- Determine long and short conditions based on the crossover of MACD lines, the relationship between OBV and its moving average, RSI levels, and the comparison of volume to its moving average
- Set the maximum number of pyramid positions and the proportion of each additional position, gradually increasing positions as the trend continues
- Dynamically adjust stop loss and take profit levels based on ATR, and adopt a trailing stop loss strategy to protect profits
- Calculate the position size for each entry based on account equity, risk percentage, and ATR, achieving dynamic position management
- Draw stop loss and take profit level lines on the chart to visually display risk control
Strategy Advantages
- Multi-indicator combination for improved signal reliability: The strategy comprehensively considers factors such as price, trend, momentum, and volume, and confirms trading signals through multiple indicators, thus improving the reliability of trading signals.
- Adaptive position management for dynamic risk control: Based on factors such as account equity, risk percentage, and ATR, the strategy can dynamically adjust the position size for each entry, automatically reducing positions when market volatility increases, effectively controlling risks.
- Pyramiding to fully capture trend opportunities: After a trend is established, the strategy gradually increases positions through pyramiding, maximizing participation in trend movements and enhancing the strategy's profitability.
- Dynamic stop loss and take profit for timely loss control and profit protection: The strategy adjusts stop loss and take profit levels in real-time based on changes in ATR, promptly stopping losses when the trend reverses, while continuously protecting profits through the trailing stop loss strategy, effectively reducing the strategy's drawdown.
- Intuitive chart display for easy monitoring and decision-making: The strategy plots key indicators and stop loss/take profit level lines on the chart, allowing traders to intuitively monitor market movements and strategy execution, providing a basis for timely strategy adjustments.
Strategy Risks
- Parameter optimization risk: The strategy involves multiple parameters, and improper parameter selection may lead to poor strategy performance. Therefore, in practical applications, parameters need to be optimized and tested to ensure the robustness of the strategy.
- Market environment change risk: The strategy is backtested and optimized based on historical data, but market conditions may change, causing the strategy's future performance to differ significantly from its historical performance. Therefore, it is necessary to regularly evaluate the strategy's performance and make adjustments when necessary.
- Black swan event risk: Extreme market movements (such as sharp rises or falls) may cause the strategy to experience significant drawdowns. To address this risk, additional risk control measures can be considered, such as setting a maximum drawdown threshold and stopping trading once the threshold is reached.
- Overfitting risk: If the strategy parameters are too complex, overfitting may occur, where the strategy performs well on historical data but poorly in actual applications. To avoid overfitting, methods such as cross-validation can be used to evaluate the strategy.
Strategy Optimization Directions
- Dynamic parameter optimization: Consider using methods such as machine learning to adjust strategy parameters in real-time based on changes in market conditions, improving the adaptability of the strategy.
- Multi-market and multi-asset applicability: Extend the strategy to more markets and assets to enhance the robustness of the strategy through diversified investment.
- Combination with fundamental analysis: In addition to technical analysis, incorporate considerations of macroeconomic and industry trends to improve the comprehensiveness of the strategy.
- Incorporation of market sentiment analysis: Introduce market sentiment indicators, such as the fear index, to capture extreme changes in market sentiment and provide more trading opportunities for the strategy.
- Optimization of risk control measures: Further improve the risk control system, such as introducing an adaptive adjustment mechanism for stop loss strategies, to enhance the strategy's risk management capabilities.
Summary
By employing methods such as multi-indicator combination, adaptive position management, pyramiding, and dynamic stop loss and take profit, this strategy aims to capture trend opportunities while strictly controlling risks, demonstrating a certain level of robustness and profitability. However, the strategy also faces risks such as parameter optimization, changes in market conditions, and black swan events, requiring continuous optimization and improvement in practical applications. In the future, improvements can be considered in areas such as dynamic parameter optimization, multi-market expansion, combination with fundamental analysis, market sentiment analysis, and risk control optimization to enhance the adaptability and robustness of the strategy.
Parameters
| Name | Default | What it controls |
|---|---|---|
| v_input_1 | 9 | HMA Length |
| v_input_2 | 12 | MACD Fast Length |
| v_input_3 | 26 | MACD Slow Length |
| v_input_4 | 9 | Signal Smoothing |
| v_input_5 | 14 | ATR Length |
| v_input_6 | 14 | RSI Length |
| v_input_7 | 10 | OBV Length |
| v_input_8 | 10 | Volume MA Length |
| v_input_9 | 3 | Max Pyramid Positions |
| v_input_10 | 0.5 | Pyramid Factor |
| v_input_11 | true | Risk per Trade (%) |
| v_input_12 | 1.5 | ATR Multiplier for Stop Loss |
| v_input_13 | 3 | ATR Multiplier for Take Profit |
| v_input_14 | 2 | ATR Multiplier for Trailing Stop |
Source Pine Script
/*backtest
start: 2023-04-06 00:00:00
end: 2024-04-11 00:00:00
period: 1d
basePeriod: 1h
exchanges: [{"eid":"Futures_Binance","currency":"BTC_USDT"}]
*/

//@version=4
strategy("Enhanced Trading Strategy v5 with Visible SL/TP", overlay=true)

// Input settings
hma_length = input(9, title="HMA Length")
fast_length = input(12, title="MACD Fast Length")
slow_length = input(26, title="MACD Slow Length")
siglen = input(9, title="Signal Smoothing")
atr_length = input(14, title="ATR Length")
rsi_length = input(14, title="RSI Length")
obv_length = input(10, title="OBV Length")
volume_ma_length = input(10, title="Volume MA Length")

// Pyramiding inputs
max_pyramid_positions = input(3, title="Max Pyramid Positions")
pyramid_factor = input(0.5, title="Pyramid Factor")

// Risk and Reward Management Inputs
risk_per_trade = input(1.0, title="Risk per Trade (%)")
atr_multiplier_for_sl = input(1.5, title="ATR Multiplier for Stop Loss")
atr_multiplier_for_tp = input(3.0, title="ATR Multiplier for Take Profit")
trailing_atr_multiplier = input(2.0, title="ATR Multiplier for Trailing Stop")

// Position sizing functions
calc_position_size(equity, risk_pct, atr) =>
    pos_size = (equity * risk_pct / 100) / (atr_multiplier_for_sl * atr)
    pos_size

calc_pyramid_size(current_size, max_positions) =>
    pyramid_size = current_size * (max_positions - strategy.opentrades) / max_positions
    pyramid_size

// Pre-calculate lengths for HMA
half_length = ceil(hma_length / 2)
sqrt_length = round(sqrt(hma_length))

// Calculate indicators
hma = wma(2 * wma(close, half_length) - wma(close, hma_length), sqrt_length)
my_obv = cum(close > close[1] ? volume : close < close[1] ? -volume : 0)
obv_sma = sma(my_obv, obv_length)
[macd_line, signal_line, _] = macd(close, fast_length, slow_length, siglen)
atr = atr(atr_length)
rsi = rsi(close, rsi_length)
vol_ma = sma(volume, volume_ma_length)

// Conditions
long_condition = crossover(macd_line, signal_line) and my_obv > obv_sma and rsi > 50 and volume > vol_ma
short_condition = crossunder(macd_line, signal_line) and my_obv < obv_sma and rsi < 50 and volume > vol_ma

// Strategy Entry with improved risk-reward ratio
var float long_take_profit = na
var float long_stop_loss = na
var float short_take_profit = na
var float short_stop_loss = na

if (long_condition)
    size = calc_position_size(strategy.equity, risk_per_trade, atr)
    strategy.entry("Long", strategy.long, qty = size)
    long_stop_loss := close - atr_multiplier_for_sl * atr
    long_take_profit := close + atr_multiplier_for_tp * atr

if (short_condition)
    size = calc_position_size(strategy.equity, risk_per_trade, atr)
    strategy.entry("Short", strategy.short, qty = size)
    short_stop_loss := close + atr_multiplier_for_sl * atr
    short_take_profit := close - atr_multiplier_for_tp * atr

// Drawing the SL/TP lines
// if (not na(long_take_profit))
//     line.new(bar_index[1], long_take_profit, bar_index, long_take_profit, width = 2, color = color.green)
//     line.new(bar_index[1], long_stop_loss, bar_index, long_stop_loss, width = 2, color = color.red)

// if (not na(short_take_profit))
//     line.new(bar_index[1], short_take_profit, bar_index, short_take_profit, width = 2, color = color.green)
//     line.new(bar_index[1], short_stop_loss, bar_index, short_stop_loss, width = 2, color = color.red)

// Pyramiding logic
if (strategy.position_size > 0)
    if (close > strategy.position_avg_price * (1 + pyramid_factor))
        strategy.entry("Long Add", strategy.long, qty = calc_pyramid_size(strategy.position_size, max_pyramid_positions))

if (strategy.position_size < 0)
    if (close < strategy.position_avg_price * (1 - pyramid_factor))
        strategy.entry("Short Add", strategy.short, qty = calc_pyramid_size(-strategy.position_size, max_pyramid_positions))

// Trailing Stop
strategy.exit("Trailing Stop Long", "Long", trail_points = atr * trailing_atr_multiplier, trail_offset = atr * trailing_atr_multiplier)
strategy.exit("Trailing Stop Short", "Short", trail_points = atr * trailing_atr_multiplier, trail_offset = atr * trailing_atr_multiplier)

// Plots
plot(hma, title="HMA", color=color.blue)
plot(obv_sma, title="OBV SMA", color=color.orange)
hline(0, "Zero Line", color=color.gray, linestyle=hline.style_dotted)
plotshape(long_condition, title="Long Entry", location=location.belowbar, color=color.green, style=shape.labelup, text="Long")
plotshape(short_condition, title="Short Entry", location=location.abovebar, color=color.red, style=shape.labeldown, text="Short")
Published by ChaoZhang on the FMZ strategy square · last modified 2024-04-12. Collected in the Quant Trading Vault. Unvalidated research: re-test with your own data and costs before trusting it.
Build this with AgenKit
A spec is not a trading system. Paste this into your coding agent and AgenKit runs a specialist team — architecture, test-first build, risk gates, review — with paper trading on by default.
/agenkit build a production-grade trading bot with a backtest engine, risk controls and paper trading by default from strategies/Volume-MA-based-Adaptive-Pyramiding-Dynamic-Stop-Loss-and-Take-Profit-Trading-Strategy.md- npx agenkit install engineering-kit in your project
- Paste the command into your agent and approve each phase
- Get tests, backtest, risk controls and a paper-trading switch
Understand it first
Before you run this, read the lesson behind the idea and how to backtest it honestly. Specs like this one are the survivors of an unknown number of trials; deflate their results accordingly.
Related specs
- Multi Indicator Comprehensive Analysis Quantitative Trading Strategy Trend Momentum and Volatility Collaborative Prediction ModelPine Script · Momentum · 3m
- KST EMA Momentum Trend Following StrategyPine Script · Momentum · 1d
- Multi Indicator Trend Momentum Trading Strategy with Dynamic Risk Management SystemPine Script · Momentum · 1h
- Multi Indicator Trend Momentum Trading Strategy An Optimized Quantitative Trading System Based on Bollinger Bands Fibonacci and ATRPine Script · Momentum · 1h
- Multi Trend Momentum Crossover Strategy with Volatility Optimization SystemPine Script · Momentum · 1d
- Dynamic Risk Managed Rapid SMA Crossover Momentum Capture StrategyPine Script · Momentum · 2d