Strategy vault / Mean reversion
VRSI and MARSI Strategy
The VRSI and MARSI strategy utilizes moving averages to smooth the RSI indicators and implements a dual indicator strategy. It uses both the RSI indicator of price and volume, combined with their moving averages, to…
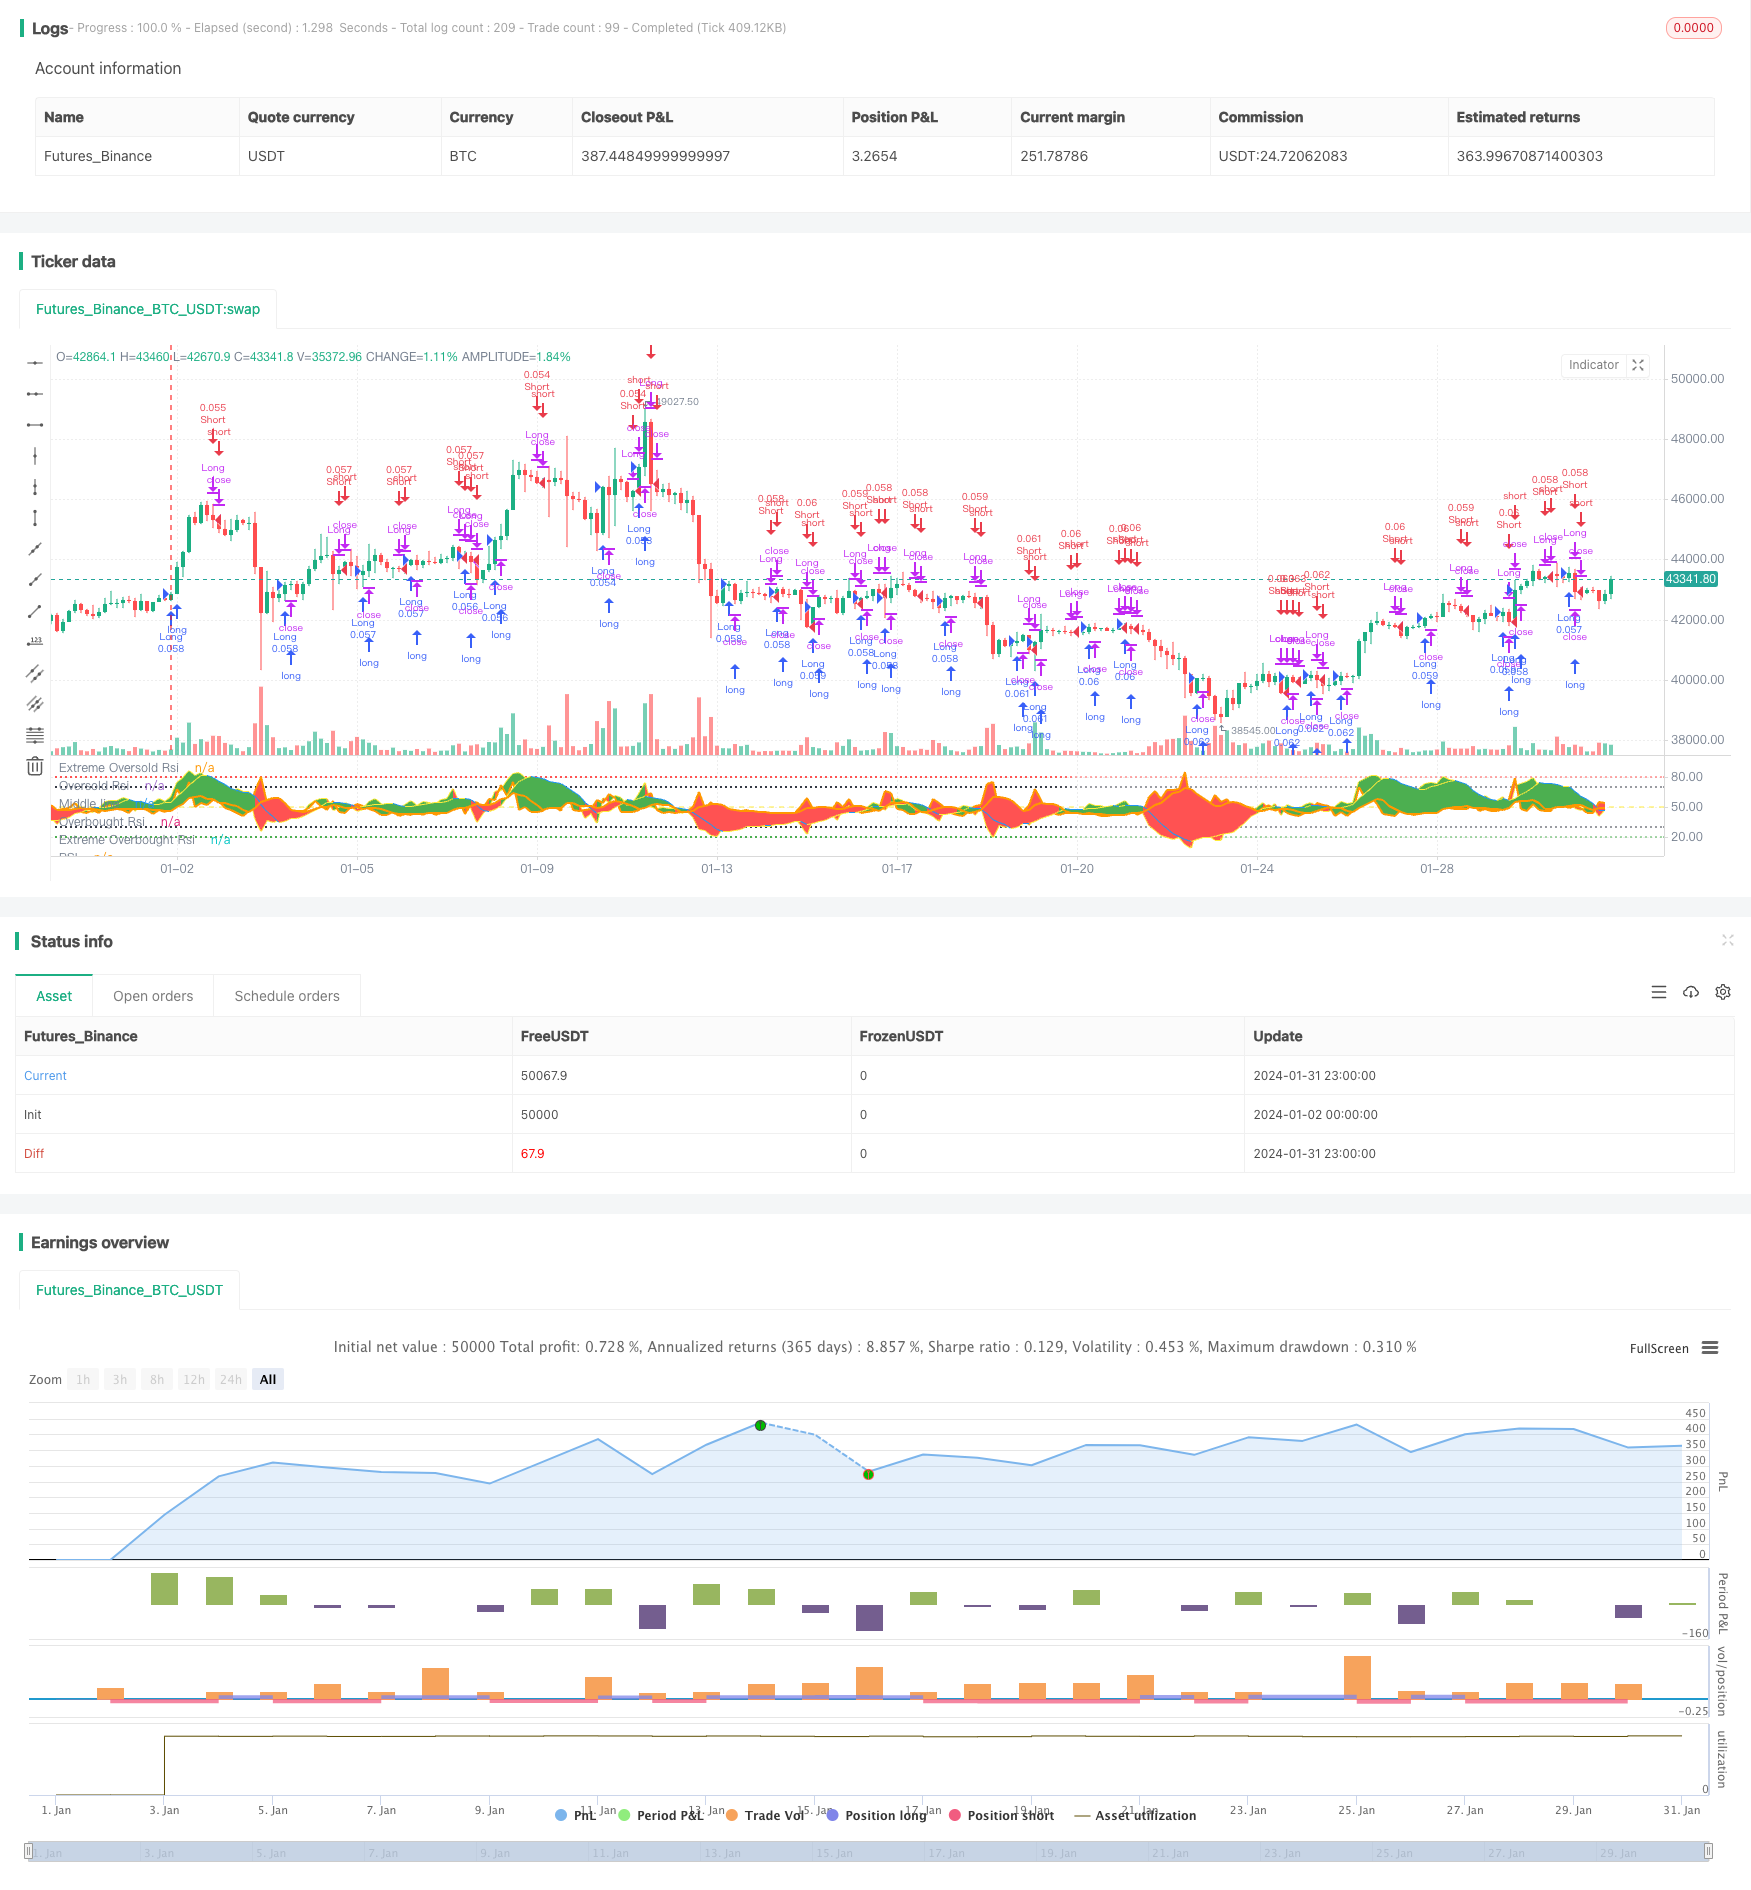
Overview
The VRSI and MARSI strategy utilizes moving averages to smooth the RSI indicators and implements a dual indicator strategy. It uses both the RSI indicator of price and volume, combined with their moving averages, to generate trading signals. It goes long when the price RSI rises and goes short when the price RSI falls. Meanwhile, it observes the changes in the volume RSI to judge the market strength and possible trend changes.
Strategy Logic
The strategy first calculates the 9-period RSI indicator of price (RSI) and the 9-period RSI indicator of volume (VRSI). Then it calculates the 5-period simple moving average (MARSI and MAVRSI) of these two RSI indicators.
The trading signals are generated based on the MARSI indicator. It goes long when MARSI rises and goes short when MARSI falls. In addition, the MAVRSI indicator is used to judge market strength and possible trend changes.
For example, during an uptrend, if price continues going up but volume starts decreasing, this signals that the bullish strength may be weakening and one should prepare to close long positions. On the contrary, during a downtrend, if price keeps falling but volume rises, this signals strengthening bearish power and short positions can be held further.
Advantage Analysis
By combining the moving averages of dual RSI indicators, this strategy can effectively catch trends, while using volume changes to judge market strength and avoid being trapped. Compared to a single RSI indicator, this strategy can grasp market rhythm more precisely.
The use of moving averages also filters out some noise to make the signals more reliable. Also, different parameter settings like RSI period and moving average period provide possibilities for strategy optimization.
Risk Analysis
The major risk of this strategy lies in divergences that may occur between the dual indicators. When there is a divergence between price and volume, the trading signals can become less reliable. Manual judgement of the relationship between the indicators is needed then.
Another risk is being trapped in range-bound markets. When price moves in a range, the RSI indicator tends to oscillate up and down, triggering unnecessary trades. Parameter adjustment or judging absolute level of indicators is required then.
Optimization Directions
The strategy can be optimized in the following aspects:
Adjust parameters of RSI and moving averages to find optimal combinations
Add other conditions when generating signals, e.g. reversal signals triggered in overbought/oversold area tend to be more reliable
Add stop loss strategies like moving stop loss or indicator stop loss
Incorporate other indicators e.g. candlestick patterns, volatility indicators etc. to avoid traps
Summary
The VRSI and MARSI strategy successfully combines the RSI indicators of price and volume. The comparison and judgement between the dual indicators can improve signal accuracy and profitability. Parameter optimization and stop loss strategies also make stable running possible. In summary, by combining indicators, this strategy achieves superior performance over a single RSI indicator.
Parameters
| Name | Default | What it controls |
|---|---|---|
| v_input_1 | 9 | Length RSI |
| v_input_2 | 9 | Length VRSI) |
| v_input_3 | 5 | Length MARSI |
| v_input_4 | 5 | Length MAVRSI |
| v_input_5 | true | Xlong |
| v_input_6 | true | Xshort |
Source Pine Script
/*backtest
start: 2024-01-02 00:00:00
end: 2024-02-01 00:00:00
period: 3h
basePeriod: 15m
exchanges: [{"eid":"Futures_Binance","currency":"BTC_USDT"}]
*/

//@version=4
strategy("VRSI-MARSI Strategy", shorttitle="(V/MA)RSI Str.", overlay=false, default_qty_type=strategy.percent_of_equity, calc_on_order_fills=true, calc_on_every_tick=true, pyramiding=0, default_qty_value=5, initial_capital=100)

// RSI(close, ="RSI") and RSI(Volume, ="VRSI")
src = close, len = input(9, minval=1, title="Length RSI")
src2 = volume, len2 = input(9, minval=1, title="Length VRSI)")
up = rma(max(change(src), 0), len)
down = rma(-min(change(src), 0), len)
up2 = rma(max(change(src2), 0), len2)
down2 = rma(-min(change(src2), 0), len2)
rsi = down == 0 ? 100 : up == 0 ? 0 : 100 - (100 / (1 + up / down))
rsi2 = down2 == 0 ? 100 : up2 == 0 ? 0 : 100 - (100 / (1 + up2 / down2))

// MA(=Moving Average) of RSI(close, ="MARSI") and RSI(Volume, ="MAVRSI")
len3 = input(5, minval=1, title="Length MARSI")
marsi = sma(rsi, len3)
len4 = input(5, minval=1, title="Length MAVRSI")
marsi2 = sma(rsi2, len4)

// Plot:
// Default plot of RSI and VRSI: not visible but can be made visible
// Default plot MARSI and MAVRSI: visible
p1 = plot(rsi, linewidth=2, transp=100, color=color.yellow, title="RSI")
p2 = plot(rsi2, linewidth=2, transp=100, color=color.orange, title="VRSI")
m1 = plot(marsi, color=(marsi>=0 ? (marsi[1] < marsi ? color.yellow : color.blue) : (marsi[1] < marsi ? color.yellow : color.blue) ), linewidth = 2, transp = 0, title="MARSI")
m2 = plot(marsi2, color=color.orange, linewidth = 2, transp = 0, title="MAVRSI")

// Color fill:
// Default color fill "RSI - VRSI": not visible but can be made visible
// Default color fill "MARSI - MAVRSI": visible
fill(p1,p2, color = rsi>rsi2 ? color.green : color.red, transp=100, title="BG RSI-VRSI")
fill(m1,m2, color = marsi>marsi2 ? color.green : color.red, transp=75, title="BG MARSI-MAVRSI")

// Lines:
h2=hline(20, color=color.green, linestyle=hline.style_dotted, title="Extreme Oversold Rsi")
h3=hline(30, color=color.black, linestyle=hline.style_dotted, title="Oversold Rsi")
h5=hline(50, color=color.yellow, linestyle=hline.style_dashed, title="Middle line")
h7=hline(70, color=color.black, linestyle=hline.style_dotted, title="Overbought Rsi")
h8=hline(80, color=color.red, linestyle=hline.style_dotted, title="Extreme Overbought Rsi")

// Color fill between Lines "20-30" and "70-80" represents the crossing of "MARSI" and "MAVRSI":
fill(h2, h3, color=(marsi2 > marsi ? color.red : color.green), transp=80, title="20-30 BG color X MARSI/MAVRSI")
fill(h7, h8, color=(marsi2 > marsi ? color.red : color.green), transp=80, title="70-80 BG color X MARSI/MAVRSI")

///Long Entry///
longCondition = marsi > marsi[1]
if (longCondition)
    strategy.entry("Long", strategy.long)

///Long exit///
Xlong =input(true)
closeConditionLong = marsi < marsi[1] and Xlong
if (closeConditionLong)
    strategy.close("Long")

///Short Entry///
shortCondition = marsi < marsi[1]
if (shortCondition)
    strategy.entry("Short", strategy.short)

///Short exit///
Xshort =input(true)
closeConditionShort = marsi > marsi[1] and Xshort
if (closeConditionShort)
    strategy.close("Short")
Published by ChaoZhang on the FMZ strategy square · last modified 2024-02-02. Collected in the Quant Trading Vault. Unvalidated research: re-test with your own data and costs before trusting it.
Build this with AgenKit
A spec is not a trading system. Paste this into your coding agent and AgenKit runs a specialist team — architecture, test-first build, risk gates, review — with paper trading on by default.
/agenkit build a production-grade trading bot with a backtest engine, risk controls and paper trading by default from strategies/VRSI-and-MARSI-Strategy.md- npx agenkit install engineering-kit in your project
- Paste the command into your agent and approve each phase
- Get tests, backtest, risk controls and a paper-trading switch
Understand it first
Before you run this, read the lesson behind the idea and how to backtest it honestly. Specs like this one are the survivors of an unknown number of trials; deflate their results accordingly.
Related specs
- Adaptive Mean Reversion Trading Strategy Based on Chande Momentum OscillatorPine Script · Mean reversion · 1d
- Advanced 15 Minute Chart Trading Signal StrategyPine Script · Mean reversion · 3h
- Advanced Momentum EMA Trend Following with RSI Overbought Oversold Trading StrategyPine Script · Mean reversion · 1d
- Advanced Quantitative Trading Strategy Combining RSI Divergence and Moving AveragesPine Script · Mean reversion · 1h
- Advanced Strategy with Volume and Price Pullback Multiple Take ProfitPine Script · Mean reversion · 1h
- BONK Multi Factor Trading StrategyPine Script · Mean reversion · 1d