VWAP and RSI Combination Strategy
The strategy is named "Value Weighted Average Price and Relative Strength Index Combination Strategy". It utilizes the Value Weighted Average Price (VWAP) and Relative Strength Index (RSI) indicators to implement a…
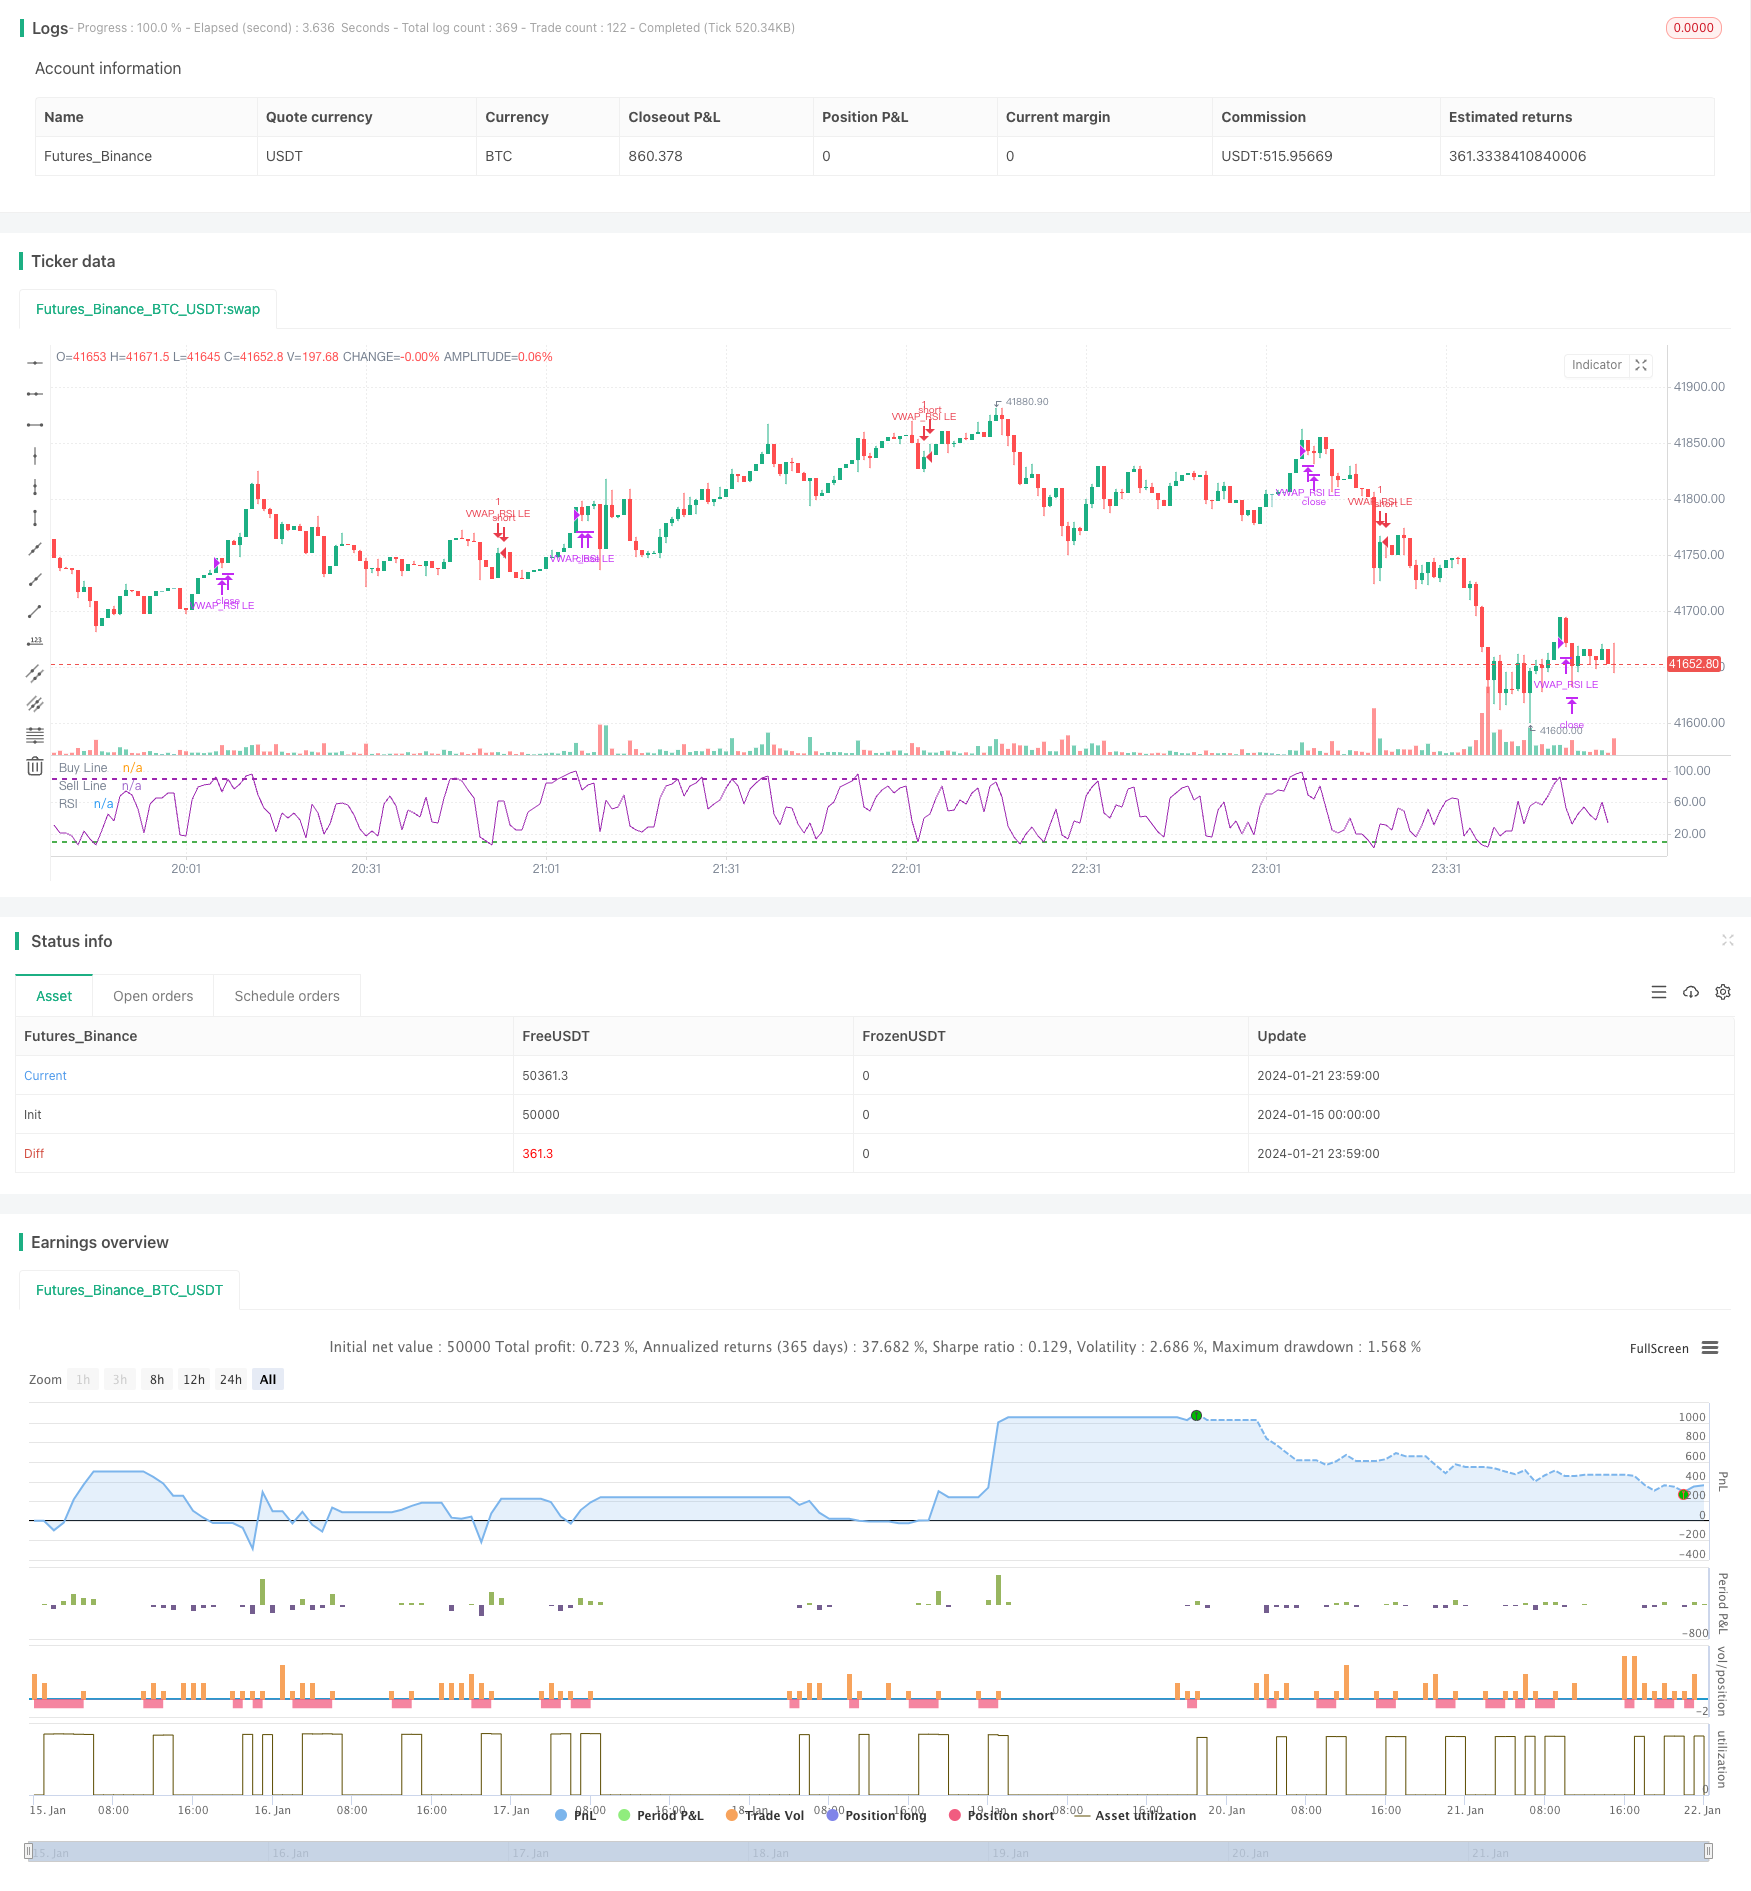
Overview
The strategy is named "Value Weighted Average Price and Relative Strength Index Combination Strategy". It utilizes the Value Weighted Average Price (VWAP) and Relative Strength Index (RSI) indicators to implement a combination strategy of trend following entry and overbought oversold exit.
Strategy Principle
The main logic of this strategy is based on the following points:
- Use the 50-day exponential moving average crossing above the 200-day line as a signal that the market trend is up.
- When the closing price is higher than the VWAP price of the day, and the closing price is higher than the opening price, it is considered that the market is going stronger and can enter the market.
- If the RSI indicator on at least one of the previous 10 K-lines is lower than 10, it is regarded as an oversold formation and a strong entry signal.
- When the RSI indicator crosses down the overbought area of 90 again, exit the market.
- Set a 5% stop loss to avoid excessive losses.
The above is the basic trading logic of this strategy. EMA judges the big trend, VWAP judges the daily trend, RSI judges the overbought and oversold area to achieve effective combination of multiple indicators, which ensures the correct direction of the main trading while increasing entry and exit signals.
Advantage Analysis
The biggest advantage of this strategy is the combination use of indicators. The single VWAP cannot perfectly cope with all market conditions. At this time, with the help of RSI, some short-term oversold breakthrough opportunities can be identified. In addition, the application of EMA also ensures that only long-cycle upward trends are selected, avoiding being trapped by short-term reversals.
This way of using combined indicators also increases the stability of the strategy. In the case of one or two false breakouts of the RSI, there are still VWAP and EMA for backup, and it is unlikely to make wrong trades. Similarly, when VWAP has false breakouts, there is also confirmation from RSI indicators. Therefore, this combination usage greatly improves the success rate of strategy implementation.
Risk Analysis
The main risk of this strategy lies in the use of the VWAP indicator. VWAP represents the average transaction price of the day, but not every day's price fluctuation fluctuates around VWAP. Therefore, VWAP breakout signals do not necessarily ensure that prices can continue to break through afterwards. Pseudo breakouts may cause losses in transactions.
In addition, RSI indicators are prone to have divergences. When the market is in a shock consolidation phase, the RSI may repeatedly touch the overbought and oversold zones multiple times, resulting in frequent output of trading signals. In this case, blindly following RSI signals for trading also faces certain risks.
To address this issue, we use the EMA exponential moving average as a large cycle judgment in the strategy, only considering trading when the large cycle is upward, which can alleviate the impact of the above two issues on the strategy to some extent. In addition, setting a stop loss can also keep a single loss within a certain range.
Optimization Direction
There is still room for further optimization of this strategy, mainly in the following aspects:
Introduce more indicators for combination. Such as Kalman lines, Bollinger bands, etc., to make trading signals clearer and more reliable.
Optimize transaction costs. The existing strategy does not consider the impact of fees and commissions. It can be combined with real trading accounts to optimize the size of the number of open positions.
Adjust the stop loss model. The existing stop loss method is relatively simple and cannot perfectly match market changes. Moving stop loss, tracking stop loss and other methods can be tested.
Test the application effects of different varieties. Currently only tested on the S&P 500 and Nasdaq indices. The sample range can be expanded to find the varieties that best match this strategy.
Summary
This strategy integrates the advantages of EMA, VWAP and RSI indicators to achieve effective combination of trend tracking and overbought oversold signals, which can find reasonable entry opportunities both in big cycle ups and short-term adjustments. At the same time, the strategy has considerable room for optimization, and it is promising to further improve the win rate and profit level of the strategy through introducing more indicators, adjusting stop loss methods, etc.
Parameters
| Name | Default | What it controls |
|---|---|---|
| v_input_1 | 200 | Long EMA |
| v_input_2 | 50 | short EMA |
| v_input_3 | 3 | RSI Period |
| v_input_4 | 10 | RSI Buy Line |
| v_input_5 | 90 | RSI Sell Line |
| v_input_6 | 5 | Stop Loss% |
Source Pine Script
/*backtest
start: 2024-01-15 00:00:00
end: 2024-01-22 00:00:00
period: 1m
basePeriod: 1m
exchanges: [{"eid":"Futures_Binance","currency":"BTC_USDT"}]
*/

// This source code is subject to the terms of the Mozilla Public License 2.0 at https://mozilla.org/MPL/2.0/
// © mohanee

//@version=4
strategy(title="VWAP and RSI strategy [EEMANI]", overlay=false)
//This strategy combines VWAP and RSI indicators
//BUY RULE
//1. EMA50 > EMA 200
//2. if current close > vwap session  value and  close>open
//3. check if RSI3 is dipped below 10  for any of last 10 candles
//EXIT RULE
//1. RSI3   crossing down 90 level
//STOP LOSS EXIT
//1. As configured --- default is set to 5%


// variables  BEGIN

longEMA = input(200, title="Long EMA", minval=1)
shortEMA = input(50, title="short EMA", minval=1)

rsi1 = input(3,title="RSI Period", minval=1)
rsi_buy_line = input(10,title="RSI Buy Line", minval=5)
rsi_sell_line = input(90,title="RSI Sell Line", minval=50)

stopLoss = input(title="Stop Loss%", defval=5, minval=1)

//variables  END


longEMAval= ema(close, longEMA)
shortEMAval= ema(close, shortEMA)
rsiVal=rsi(close,rsi1)
vwapVal=vwap(hlc3)


// Drawings

plot_rsi = plot(rsiVal, title="RSI", color=color.purple, linewidth=1)
//plot_fill = plot(0, color=color.green, editable=false)
//fill(plot_rsi, plot_fill, title="Oscillator Fill", color=color.blue, transp=75)
hline(rsi_buy_line, color=color.green, title="Buy Line", linewidth=2, linestyle=hline.style_dashed)
hline(rsi_sell_line, color=color.purple, title="Sell Line", linewidth=2, linestyle=hline.style_dashed)
//plot(value_ma, title="MA", color=color_ma, linewidth=2)

longCondition=  shortEMAval > longEMAval and  close>open and  close>vwapVal
rsiDipped =  rsiVal[1]<rsi_buy_line or rsiVal[2]<rsi_buy_line or rsiVal[3]<rsi_buy_line  or rsiVal[4]<rsi_buy_line  or rsiVal[5]<rsi_buy_line  or rsiVal[6]<rsi_buy_line or rsiVal[7]<rsi_buy_line  or rsiVal[8]<rsi_buy_line  or rsiVal[9]<rsi_buy_line  or rsiVal[10]<rsi_buy_line

//Entry
strategy.entry(id="VWAP_RSI LE", comment="VR LE" , long=true,  when= longCondition and rsiDipped )

//Take profit Exit
strategy.close(id="VWAP_RSI LE", comment="TP Exit",   when=crossunder(rsiVal,90) )


//stoploss
stopLossVal =   strategy.position_avg_price -  (strategy.position_avg_price*stopLoss*0.01)
strategy.close(id="VWAP_RSI LE", comment="SL Exit",   when= close < stopLossVal)
Published by ChaoZhang on the FMZ strategy square · last modified 2024-01-23. Collected in the Quant Trading Vault. Unvalidated research: re-test with your own data and costs before trusting it.
Build this with AgenKit
A spec is not a trading system. Paste this into your coding agent and AgenKit runs a specialist team — architecture, test-first build, risk gates, review — with paper trading on by default.
/agenkit build a production-grade trading bot with a backtest engine, risk controls and paper trading by default from strategies/VWAP-and-RSI-Combination-Strategy.md- npx agenkit install engineering-kit in your project
- Paste the command into your agent and approve each phase
- Get tests, backtest, risk controls and a paper-trading switch
Understand it first
Before you run this, read the lesson behind the idea and how to backtest it honestly. Specs like this one are the survivors of an unknown number of trials; deflate their results accordingly.
Related specs
- Multi Filter Trend Breakthrough Smart Moving Average Trading StrategyPine Script · Breakout · 1h
- Dynamic Multi indicator Quantitative Trading StrategyPine Script · Breakout · 1d
- Cross Timeframe SuperTrend Breakout StrategyPine Script · Breakout · 1h
- Multi Indicator Breakout and Reversal Trading Strategy A Dual Entry System with Opening Range OptimizationPine Script · Breakout · 1h
- Trend Following Strategy Based on Moving Average BreakoutPine Script · Breakout · 1h
- VWAP Trading StrategyPine Script · Breakout · 1h