Strategy vault / Trend following
WaveTrend Oscillator Divergence Strategy
This strategy combines the WaveTrend Oscillator (WT) and the Volume Weighted Average Price (VWAP) to capture potential trend reversal opportunities by identifying divergences between price and the indicator. The…
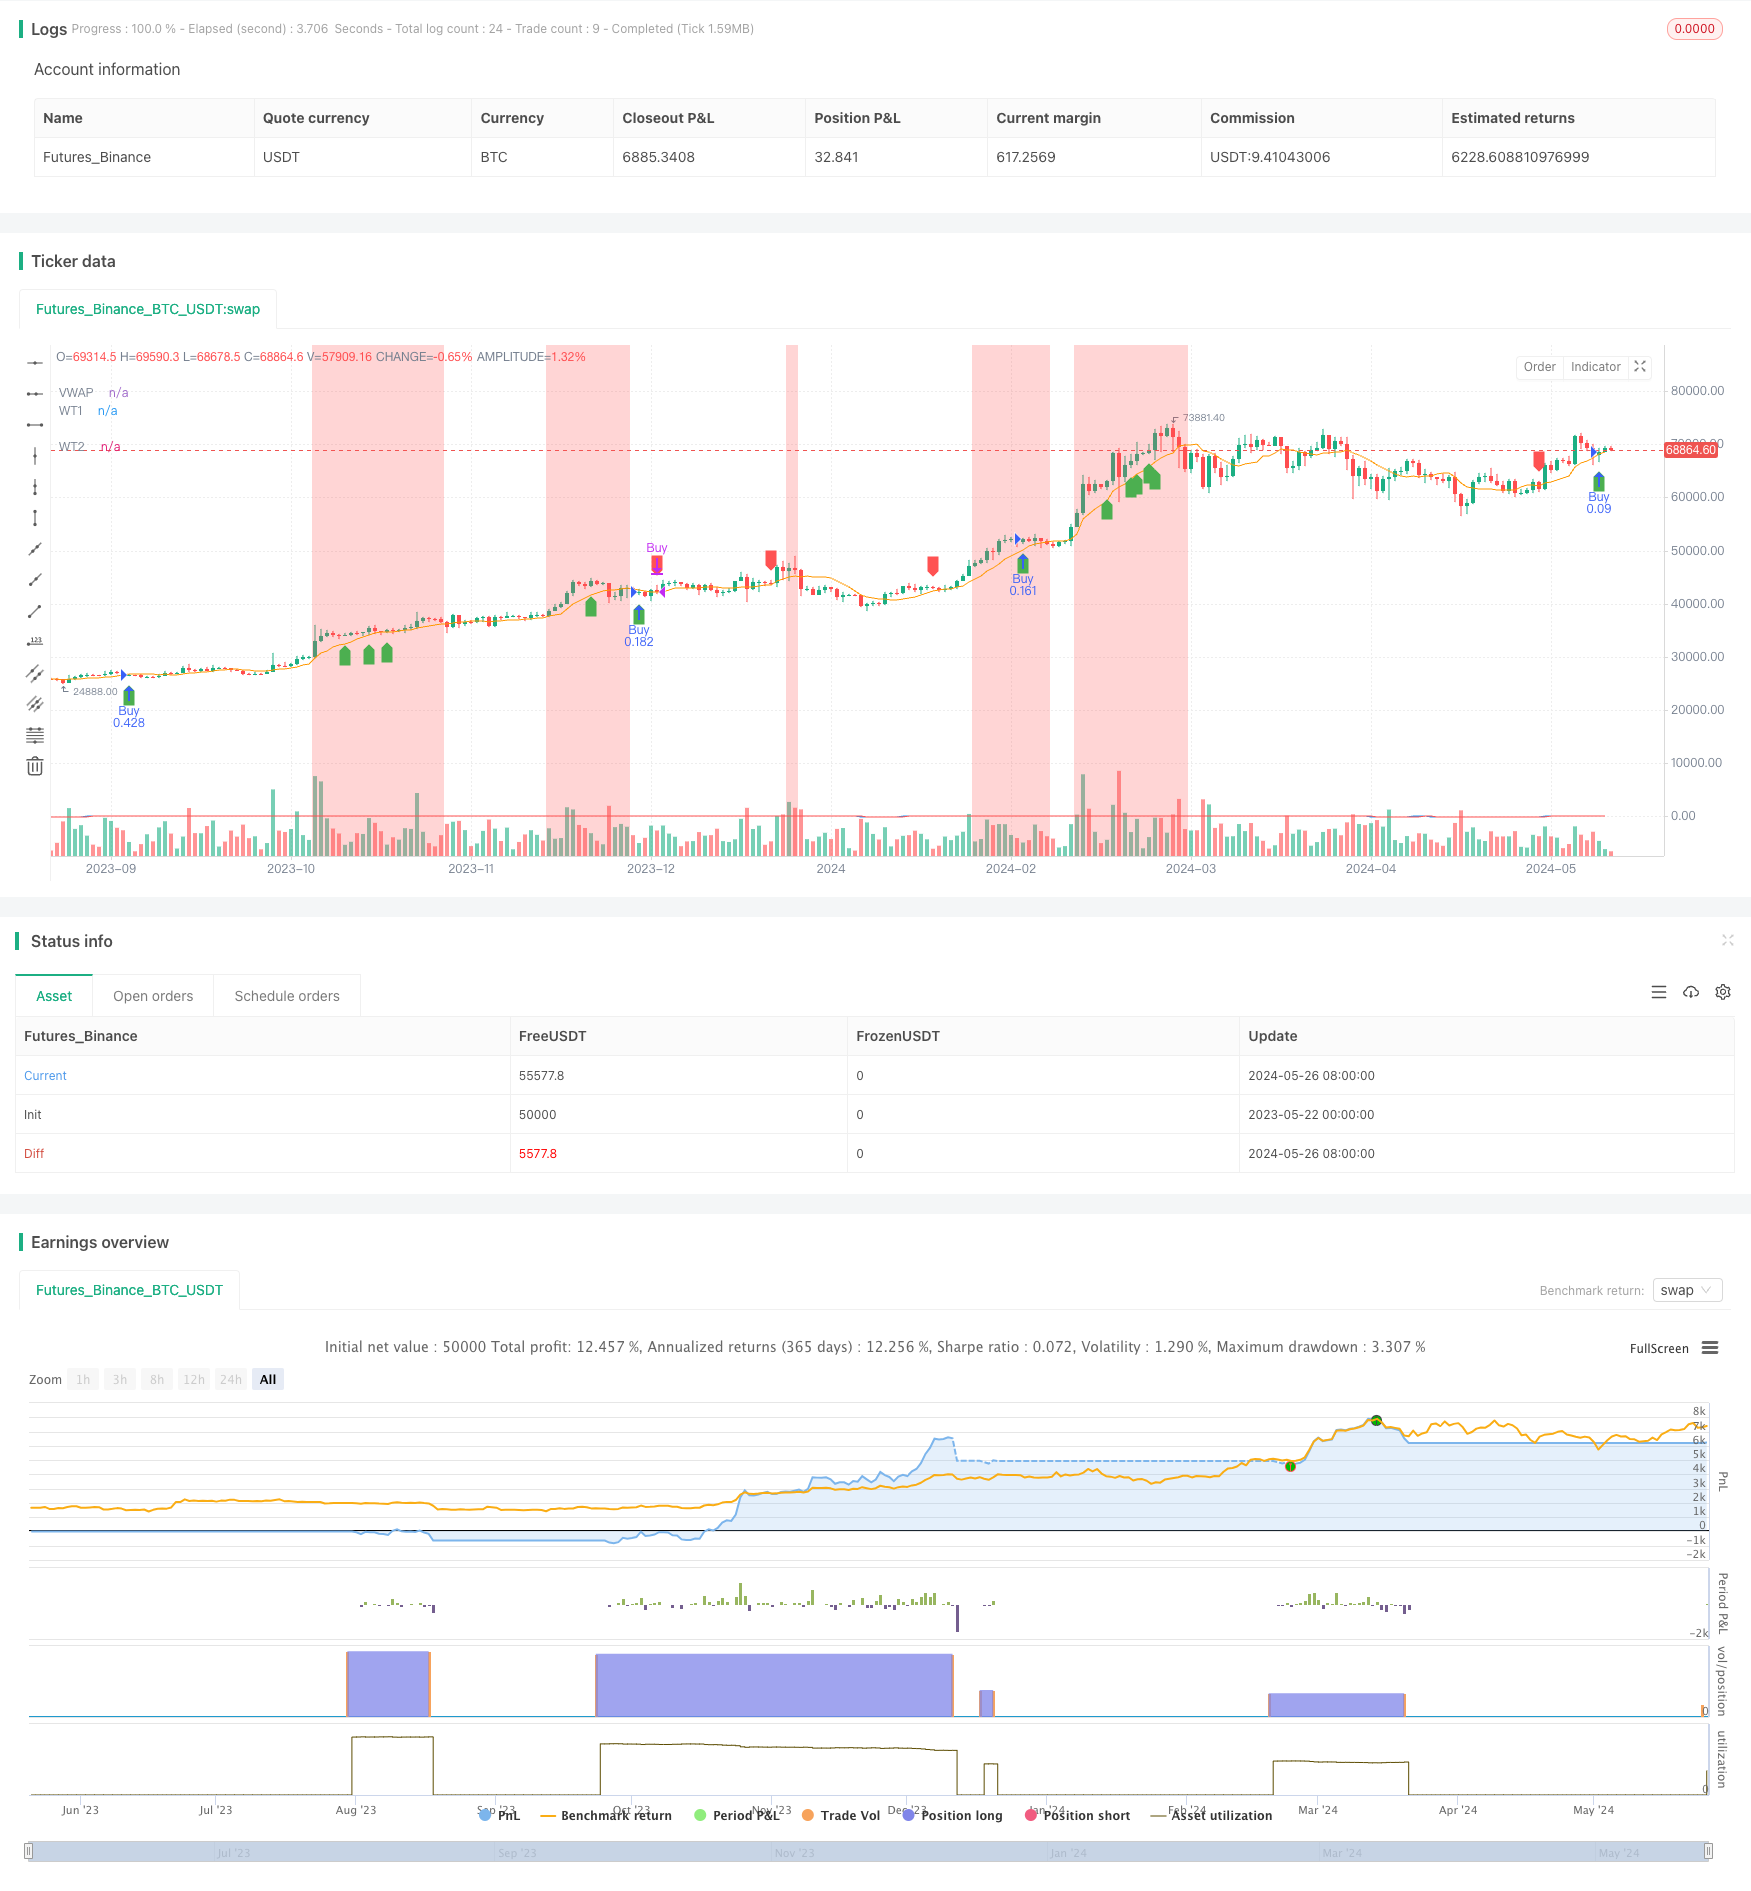
Overview
This strategy combines the WaveTrend Oscillator (WT) and the Volume Weighted Average Price (VWAP) to capture potential trend reversal opportunities by identifying divergences between price and the indicator. The strategy uses the Average True Range (ATR) to determine stop-loss levels and dynamically adjusts position sizing based on account risk percentage. The main strengths of the strategy lie in its trend-following capabilities and risk management measures, but it may suffer losses in choppy markets. Optimization directions include adding additional filters and improving entry and exit rules.
Strategy Principles
- Calculate the WaveTrend Oscillator (WT): Generate a momentum oscillator by comparing the current price with its channel and average.
- Calculate the Volume Weighted Average Price (VWAP): Compute a moving average price weighted by volume.
- Identify divergences between price and the WT indicator: A potential trend reversal is indicated when price makes a new high/low while the indicator fails to do so.
- Entry conditions: Open a long position when a bullish divergence is identified; close the position when a bearish divergence is identified.
- Stop-loss: Set dynamic stop-loss levels based on the Average True Range (ATR).
- Position sizing: Dynamically adjust the position size for each trade based on the account risk percentage and stop-loss distance.
- Background color: Change the background color based on the overbought/oversold levels of the indicator, providing additional visual cues.
Advantages Analysis
- Trend following: By identifying divergences between price and the indicator, the strategy can capture potential trend reversal opportunities.
- Risk management: The use of ATR-based dynamic stop-losses and position sizing based on risk percentage helps control potential losses.
- Visual cues: The background color changes based on the overbought/oversold state of the indicator, providing additional visual signals to traders.
- Flexibility: The strategy's parameters (e.g., channel length, average length, overbought/oversold levels) can be adjusted to suit different market conditions and trading styles.
Risk Analysis
- Choppy markets: In market conditions lacking clear trends, the strategy may suffer consecutive losses.
- Parameter optimization: The strategy's performance largely depends on the choice of parameters, and suboptimal parameter settings may lead to subpar results.
- Overtrading: Frequent entry and exit signals may result in high trading costs, affecting the overall performance of the strategy.
Optimization Directions
- Trend filters: Introduce additional trend confirmation indicators (e.g., moving averages) when divergences occur to filter out potential false signals.
- Dynamic parameters: Adjust indicator parameters based on market volatility, using shorter channel and average lengths during low volatility and longer parameters during high volatility.
- Take-profit: Introduce dynamic take-profit levels based on risk-reward ratios or target prices to better manage profitable positions.
- Long/short filters: Filter trading signals based on the overall market trend direction (e.g., long-term moving averages) to only trade in the direction of the trend.
Summary
The WaveTrend Oscillator Divergence Strategy combines the WaveTrend indicator and the Volume Weighted Average Price to identify potential trend reversal opportunities. The strategy's strengths lie in its trend-following capabilities and risk management measures, but it may face risks in choppy markets. The strategy can be further optimized by introducing additional filters, dynamic parameter adjustments, and improved entry and exit rules. Thorough backtesting and forward-looking analysis are crucial before implementing the strategy.
Source Pine Script
/*backtest
start: 2023-05-22 00:00:00
end: 2024-05-27 00:00:00
period: 1d
basePeriod: 1h
exchanges: [{"eid":"Futures_Binance","currency":"BTC_USDT"}]
*/

//@version=5
strategy("PipShiesty Swagger", overlay=true)

// WaveTrend Oscillator (WT)
n1 = input.int(10, "Channel Length")
n2 = input.int(21, "Average Length")
obLevel1 = input.float(60.0, "Overbought Level 1")
obLevel2 = input.float(53.0, "Overbought Level 2")
osLevel1 = input.float(-60.0, "Oversold Level 1")
osLevel2 = input.float(-53.0, "Oversold Level 2")

ap = hlc3
esa = ta.ema(ap, n1)
d = ta.ema(math.abs(ap - esa), n1)
ci = (ap - esa) / (0.015 * d)
tci = ta.ema(ci, n2)

// VWAP
vwap = ta.vwma(close, n1)

// Signal Line
wt1 = tci
wt2 = ta.sma(wt1, 4)

// Bullish and Bearish Divergences
bullishDivergence = (ta.lowest(close, 5) > ta.lowest(close[1], 5)) and (wt1 < wt1[1]) and (close > close[1])
bearishDivergence = (ta.highest(close, 5) < ta.highest(close[1], 5)) and (wt1 > wt1[1]) and (close < close[1])

// Plot WaveTrend Oscillator
plot(wt1, title="WT1", color=color.blue)
plot(wt2, title="WT2", color=color.red)

// Plot Divergences
plotshape(series=bullishDivergence, location=location.belowbar, color=color.green, style=shape.labelup, title="Bullish Divergence")
plotshape(series=bearishDivergence, location=location.abovebar, color=color.red, style=shape.labeldown, title="Bearish Divergence")

// Risk Management Parameters
riskPercentage = input.float(1, title="Risk Percentage per Trade", minval=0.1, step=0.1) / 100
stopLossATR = input.float(1.5, title="Stop Loss ATR Multiplier", minval=0.5, step=0.1)

// ATR Calculation
atr = ta.atr(14)

// Position Size Calculation
calculatePositionSize(stopLoss) =>
    riskAmount = strategy.equity * riskPercentage
    positionSize = riskAmount / stopLoss
    positionSize

// Entry and Exit Logic with Stop Loss
if bullishDivergence
    stopLoss = low - atr * stopLossATR
    positionSize = calculatePositionSize(close - stopLoss)
    strategy.entry("Buy", strategy.long, qty=positionSize)
    strategy.exit("Sell", from_entry="Buy", stop=stopLoss)

if bearishDivergence
    strategy.close("Buy")

// Plot VWAP
plot(vwap, title="VWAP", color=color.orange)

// Background color to indicate Overbought/Oversold conditions
bgcolor(wt1 > obLevel1 ? color.new(color.red, 90) : na, title="Overbought Level 1")
bgcolor(wt1 < osLevel1 ? color.new(color.green, 90) : na, title="Oversold Level 1")
bgcolor(wt1 > obLevel2 ? color.new(color.red, 70) : na, title="Overbought Level 2")
bgcolor(wt1 < osLevel2 ? color.new(color.green, 70) : na, title="Oversold Level 2")
Published by ChaoZhang on the FMZ strategy square · last modified 2024-05-28. Collected in the Quant Trading Vault. Unvalidated research: re-test with your own data and costs before trusting it.
Build this with AgenKit
A spec is not a trading system. Paste this into your coding agent and AgenKit runs a specialist team — architecture, test-first build, risk gates, review — with paper trading on by default.
/agenkit build a production-grade trading bot with a backtest engine, risk controls and paper trading by default from strategies/WaveTrend-Oscillator-Divergence-Strategy.md- npx agenkit install engineering-kit in your project
- Paste the command into your agent and approve each phase
- Get tests, backtest, risk controls and a paper-trading switch
Understand it first
Before you run this, read the lesson behind the idea and how to backtest it honestly. Specs like this one are the survivors of an unknown number of trials; deflate their results accordingly.
Related specs
- Fixed Range Volume Profile And Anchored VWAP Trend Identification Strategy With Dynamic Stop LossPine Script · Trend following · 1h
- Trend Following Strategy Based on Moving Average 439858Pine Script · Trend following · 1d
- Multi Period Trend Confirmation Dynamic Risk Control Quantitative Trading StrategyPine Script · Trend following · 1h
- An Optimization of Dual Moving Average Trend Following Strategy Based on Indicators CombinationPine Script · Trend following · 4h
- Multi Timeframe Volume and Trend Confluence Trading StrategyPine Script · Trend following · 1d
- Intelligent Multi Dimensional Adaptive Trend Trading SystemPine Script · Trend following · 1h