Weighted Moving Average Breakout Reversal Strategy
The main idea of this strategy is to take positions by reversals that test important support/resistance levels around Weighted Moving Average. When prices spike up/down then pullback to test the moving average, it is…
Weighted Moving Average Breakout Reversal Strategy
Overview
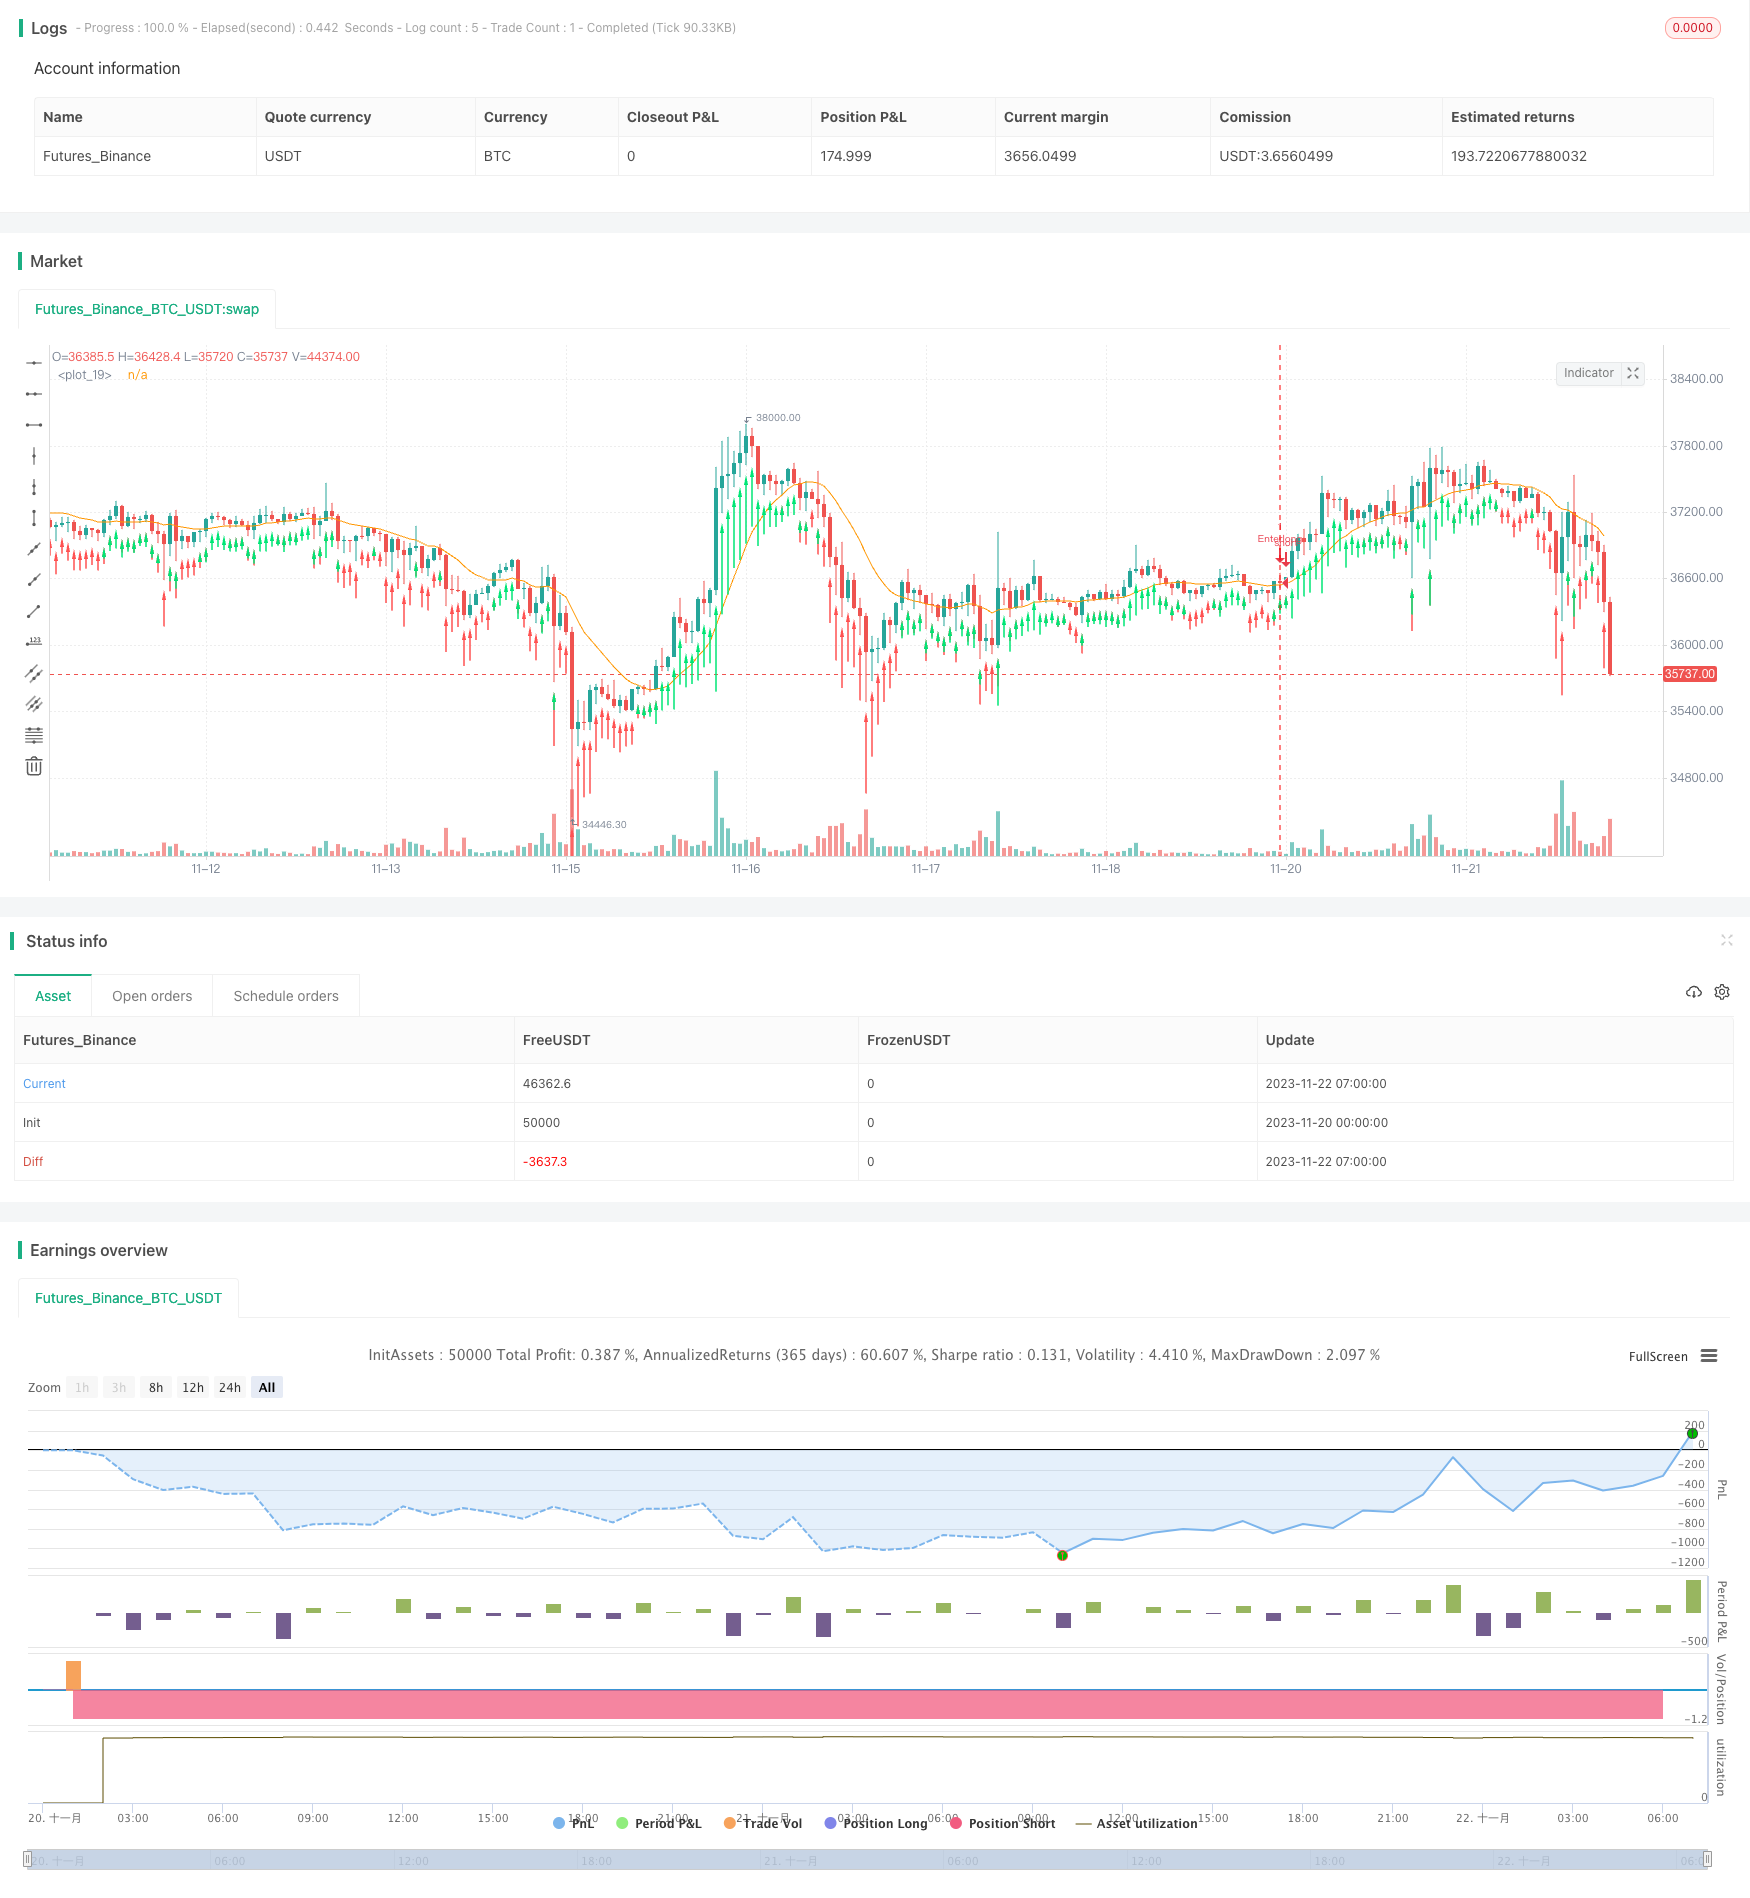
The main idea of this strategy is to take positions by reversals that test important support/resistance levels around Weighted Moving Average. When prices spike up/down then pullback to test the moving average, it is likely to form support/resistance levels and generate reversal opportunities.
Strategy Logic
This strategy is based on the Weighted Moving Average indicator. It firstly calculates the WMA of a certain length, then monitors if the price breaks out of the WMA by some range. When the breakout distance reaches a threshold, it plots an arrow and opens positions. To go long, the price needs to break down first by some range; To go short, the price needs to break up first by some range. By forming reversal signals through breakouts and combining with WMA's support/resistance levels, it helps to optimize the market entry timing.
The strategy provides options between trailing stop loss and fixed stop loss through the trail parameter, so risks can be controlled by adjusting stop loss range. It also locks in partial profits with limit orders. Moreover, time filters can restrict specific time periods for opening positions.
Advantage Analysis
The biggest advantage lies in combining reversal setups with moving averages to capture key market turning points for opening positions. Reversal strategies often have good win rate and risk reward ratio, with risks being easy to control. This strategy also equipped with comprehensive stop loss mechanisms and partial profit taking methods, which further helps to reduce risks and improve stability.
As it builds on moving averages, ample room is available for parameter optimization by adjusting values like WMA length, breakout range etc to test adaptiveness across different markets.
Risk Analysis
The biggest risk is failed reversals. If the price fails to trigger stop loss or take profit after forming reversal signals, and keeps running in the original direction, it would incur considerably floating losses.
Also, it relies heavily on parameter optimization. Inappropriate parameter settings may easily miss price reversal timing or generate false signals. Proper understanding of market behavior and prudent evaluation of parameter choices are required through sufficient backtests.
Optimization Directions
More indicators could be introduced to improve signal quality and accuracy. For instance, before price reversals, incremental values in certain recent periods could be checked, especially short-term increment data, to characterize price fluctuation patterns. Or certain quantitative factors could be added to detect price momentum, volatility etc for multifactor modeling.
Machine learning methods could also be tested to forecast near-term price movement based on historical trade signals and pricing data, which helps to filter out false signals and improve signal quality.
In addition, some adaptive optimization mechanisms could be implemented. According to actual trade results, parameters or rule weights could be dynamically adjusted to realize self-optimization and ENO of the strategy.
Summary
The overall operation of this strategy is stable. Within reasonable parameter space and market environments, it can achieve considerable returns. The biggest advantage lies in the controllable risks and optimization potential. Next step efforts will be focused on improving signal quality and incorporating adaptive optimization capabilities. It is believed that on persistent enhancements, this strategy can become a compelling choice in investment portfolios.
Parameters
| Name | Default | What it controls |
|---|---|---|
| v_input_1 | 20 | Length |
| v_input_2_close | 0 | Source: close | high | low | open | hl2 | hlc3 | hlcc4 | ohlc4 |
| v_input_3 | 0.003 | When price drops (In Ticks) Enter Long |
| v_input_4 | 0.003 | When price climbs (In Ticks) Enter Short |
| v_input_5 | true | Trailing Stop(checked), Market stop(unchecked) |
| v_input_6 | 10 | Stop (in ticks) |
| v_input_7 | 5 | Limit Out |
| v_input_8 | true | Limit Time of Day (Buying Side) |
| v_input_9 | 1600-0500 | Start/Stop trades (Est time) |
Source Pine Script
/*backtest
start: 2023-11-20 00:00:00
end: 2023-11-22 08:00:00
period: 1h
basePeriod: 15m
exchanges: [{"eid":"Futures_Binance","currency":"BTC_USDT"}]
*/

//@version=3
strategy(title="WMA Breakout",overlay=true, initial_capital=25000, default_qty_value=1, commission_type=strategy.commission.cash_per_contract, commission_value=3.02)
len = input(20, minval=1, title="Length")
src = input(close, title="Source")
out = wma(src, len)
price_drop = input(.003, "When price drops (In Ticks) Enter Long", step=.001)
price_climb = input(.003, "When price climbs (In Ticks) Enter Short", step=.001)
trail = input(true, "Trailing Stop(checked), Market stop(unchecked)")
stop = input(10, "Stop (in ticks)", step=1)
limit = input(5, "Limit Out", step=1)
//size = input(1, "Limit Position Size (pyramiding)", minval=1)
timec = input(true, "Limit Time of Day (Buying Side)")


//Time Session
sess = input("1600-0500", "Start/Stop trades (Est time)")
t = time(timeframe.period, sess)
//plots
plot(wma(src,len))
z = if low+price_drop<out
    (out-low)
plotarrow(z, colorup=red)

a = if high-price_climb>out
    (high-out)
plotarrow(a, colorup=lime)
av=wma(src,len)

//Orders
if(timec)
    strategy.entry("Enterlong", long=true, when=z and t>1)
else
    strategy.entry("Enterlong", long=true, when=z)
if(trail)
    strategy.exit("Exit","Enterlong", profit=limit, trail_points = 0, trail_offset = stop )
else
    strategy.exit("Exit","Enterlong", profit=limit, loss = stop )

if(timec)
    strategy.entry("Entershort", long=false, when=a and t>1)
else
    strategy.entry("Entershort", long=false, when=a)
if(trail)
    strategy.exit("Exit","Entershort", profit=limit, trail_points = 0, trail_offset = stop )
else
    strategy.exit("Exit","Entershort", profit=limit, loss = stop )
Published by ChaoZhang on the FMZ strategy square · last modified 2023-11-28. Collected in the Quant Trading Vault. Unvalidated research: re-test with your own data and costs before trusting it.
Build this with AgenKit
A spec is not a trading system. Paste this into your coding agent and AgenKit runs a specialist team — architecture, test-first build, risk gates, review — with paper trading on by default.
/agenkit build a production-grade trading bot with a backtest engine, risk controls and paper trading by default from strategies/Weighted-Moving-Average-Breakout-Reversal-Strategy.md- npx agenkit install engineering-kit in your project
- Paste the command into your agent and approve each phase
- Get tests, backtest, risk controls and a paper-trading switch
Understand it first
Before you run this, read the lesson behind the idea and how to backtest it honestly. Specs like this one are the survivors of an unknown number of trials; deflate their results accordingly.
Related specs
- Bollinger Bands Breakout Trading StrategyPine Script · Breakout · 1h
- Bollinger Bands Dynamic Breakout StrategyPine Script · Breakout · 1h
- Cross period Value Area Breakout StrategyPine Script · Breakout · 1d
- Donchian Channel Breakout Strategy 442842Pine Script · Breakout · 4h
- Dynamic Support Resistance Breakout Moving Average Crossover StrategyPine Script · Breakout · 1d
- Dynamic Support and Resistance Adaptive Pivot Trading StrategyPine Script · Breakout · 1d